
Hi Traders, Join us for a live trading session via zoom. we will start shortly https://zoom.us/webinar/register/WN_pavY24q0TKiVyS7bhLqb6Q
Zoom Video Communications
Welcome! You are invited to join a webinar: Live trading with Nour Eldeen Al-Hammoury. After registering, you will receive a confirmation…
How do professionals trade? FBS Chief analyst Nour Eldeen Al-Hammoury will do live market analysis, share trading tips, and open trades. Learn from the best!
FBS Analytics
Good Morning traders. Dont chase EURUSD down trend. Declining for 6 sessions in a row. Instead, i would risk a long position around this area. Good Luck Nourldeen Al Hammoury
Hi traders, if you are afraid of a loss, you can move your Stop Loss now to the entry at 1.13. This is a risk free trade now. Good luck!
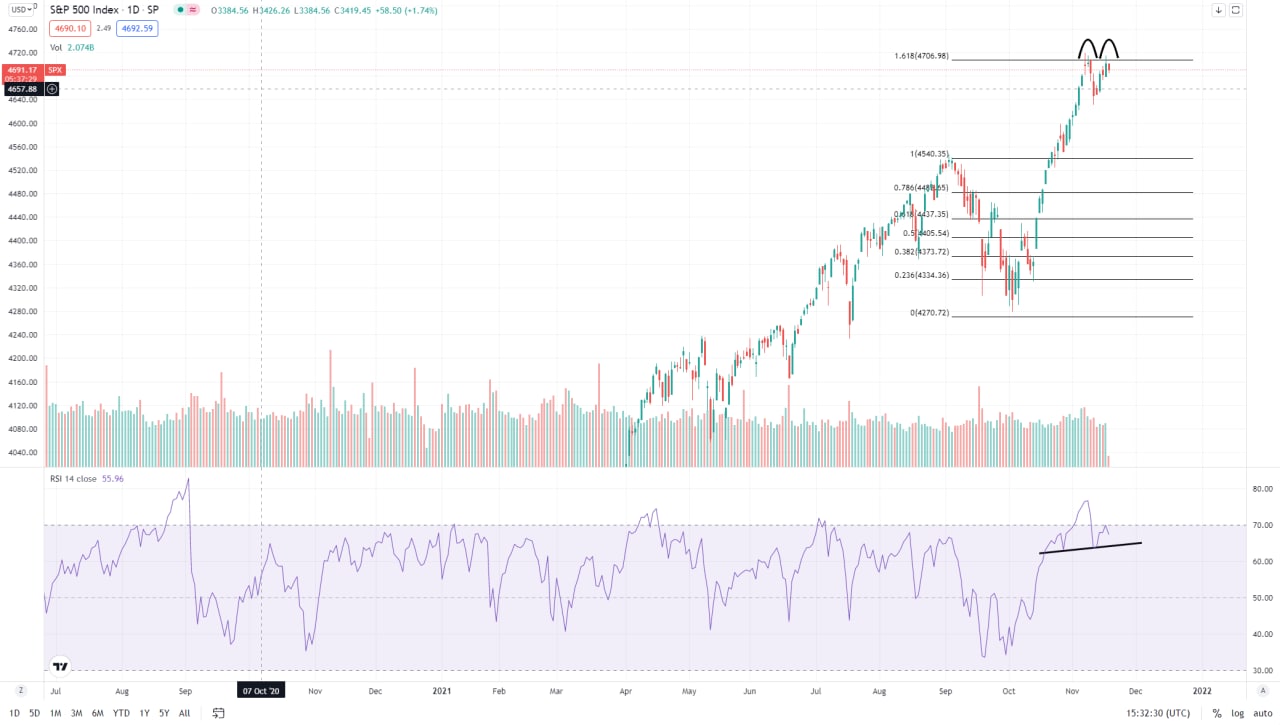
US500 is ready to reverse!🔥🔥
Guys, if you trade stocks or indices this information will be important for you!
There are several signs of an upcoming reversal:
🛑The price locates right under the resistance level and already got rejected twice
✌️Double top pattern might occur on the price chart
✅The RSI is forming head with shoulders pattern.
There are three options to enter this trade:
1) Sell at 4700
2) Sell after RSI chart breaks the neckline
3) Sell after the price chart breaks the previous low at 4645
Take profit: 4600
Stop loss: according to your risk management
Information is not at investment advice.
Guys, if you trade stocks or indices this information will be important for you!
There are several signs of an upcoming reversal:
🛑The price locates right under the resistance level and already got rejected twice
✌️Double top pattern might occur on the price chart
✅The RSI is forming head with shoulders pattern.
There are three options to enter this trade:
1) Sell at 4700
2) Sell after RSI chart breaks the neckline
3) Sell after the price chart breaks the previous low at 4645
Take profit: 4600
Stop loss: according to your risk management
Information is not at investment advice.
👍1
Big Event for USD: Philly Fed Manufacturing Index😏
What will happen?
The US will release the Philly Fed Manufacturing Index – the impactful event for the USD and thus for all the major pairs. It will be out on November 18 at 15:30 MT (GMT+2).
Why is it important?
This report is based on the survey of about 250 manufacturers in the Philadelphia Federal Reserve district. They are asked to rate the level of current business conditions. Businesses react quickly to market conditions, that’s why the changes in their sentiment can be an early signal of future economic activity.
Last time, the Philly Fed Manufacturing Index came out worse than expected. As a result, USD/CAD dropped by 130 points just in half an hour after the release.
How to trade on Philly Fed Manufacturing Index?
Open the economic calendar and compare the actual numbers with the market forecast.
If the Manufacturing Index is greater than the forecasts, the USD will jump.
Otherwise – fall.
Instruments to trade: EUR/USD, GBP/USD, USD/CAD
What will happen?
The US will release the Philly Fed Manufacturing Index – the impactful event for the USD and thus for all the major pairs. It will be out on November 18 at 15:30 MT (GMT+2).
Why is it important?
This report is based on the survey of about 250 manufacturers in the Philadelphia Federal Reserve district. They are asked to rate the level of current business conditions. Businesses react quickly to market conditions, that’s why the changes in their sentiment can be an early signal of future economic activity.
Last time, the Philly Fed Manufacturing Index came out worse than expected. As a result, USD/CAD dropped by 130 points just in half an hour after the release.
How to trade on Philly Fed Manufacturing Index?
Open the economic calendar and compare the actual numbers with the market forecast.
If the Manufacturing Index is greater than the forecasts, the USD will jump.
Otherwise – fall.
Instruments to trade: EUR/USD, GBP/USD, USD/CAD
👍1
#MarketNews
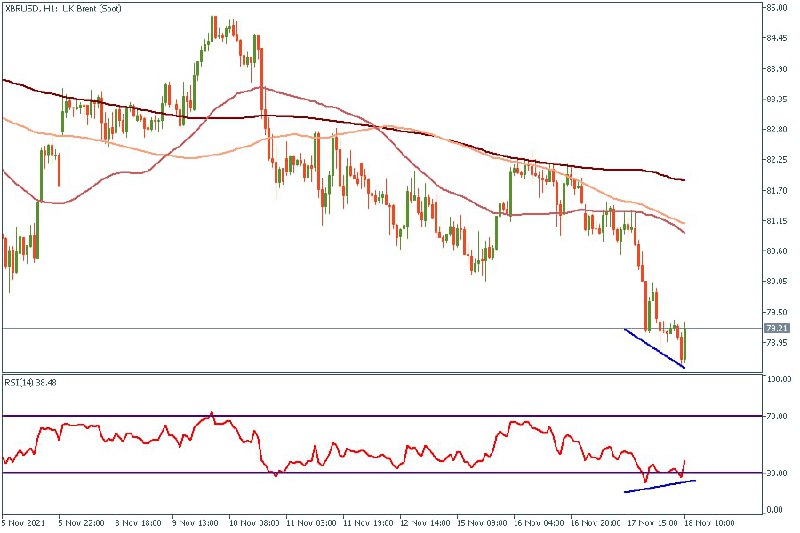
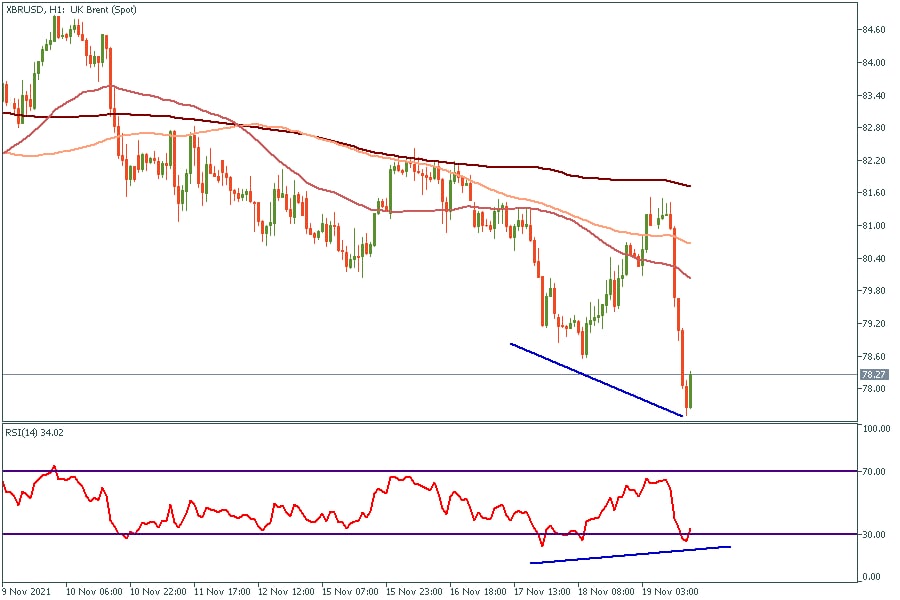
🇨🇳China sold oil from its strategic request after the USA request. XBR/USD dropped below $80.
🇹🇷Bearish bets on the Turkish lira jumped to highest level in more than six months as traders braced for the central bank to cut its key rate by another 100 basis points on Thursday.
🏥AZN Announces new analyses of two AZD7442 COVID-19 Phase III trials in high-risk populations confirm robust efficacy and long-term prevention. Separate treatment trial showed 88% reduced risk of severe COVID-19 or death.
🟢Santiment states there is a spike in interest in BTC buyout after the latest drop.
👆Positive correlation between SP500 and BTC has been rising significantly since July and continues to increase.
🇨🇳China sold oil from its strategic request after the USA request. XBR/USD dropped below $80.
🇹🇷Bearish bets on the Turkish lira jumped to highest level in more than six months as traders braced for the central bank to cut its key rate by another 100 basis points on Thursday.
🏥AZN Announces new analyses of two AZD7442 COVID-19 Phase III trials in high-risk populations confirm robust efficacy and long-term prevention. Separate treatment trial showed 88% reduced risk of severe COVID-19 or death.
🟢Santiment states there is a spike in interest in BTC buyout after the latest drop.
👆Positive correlation between SP500 and BTC has been rising significantly since July and continues to increase.
👍1
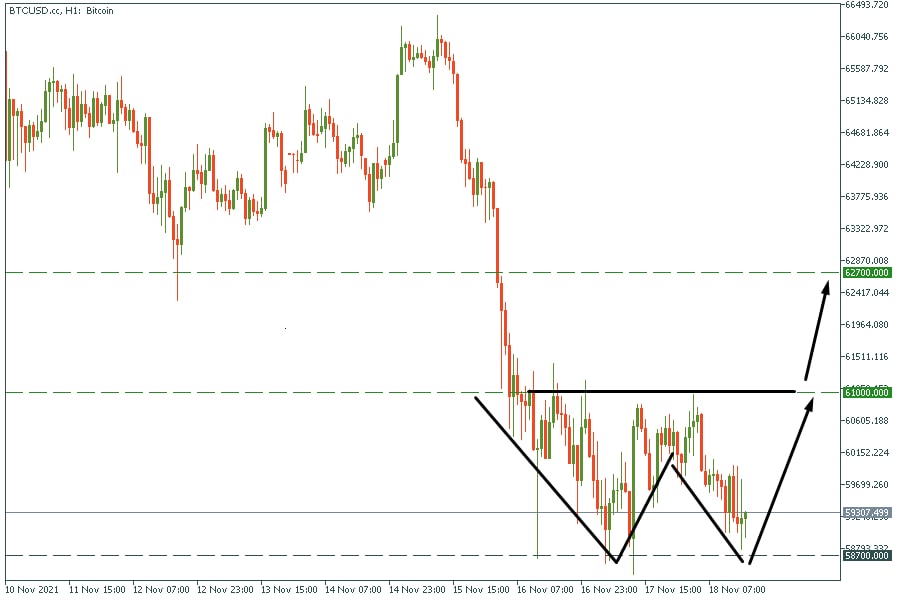
🔥Risky, but worthy!🔥
✅Bitcoin has a potential to form a double bottom pattern!
There are two options to enter this trade:
1) Buy by market (SL $58 100)
2) Buy after a breakout of $61 000 (SL $60 000)
Take profit: $62 700 - $63 000
Stop loss: $58 000
Target: $62 700 - $63 000
Information is not at investment advice.
✅Bitcoin has a potential to form a double bottom pattern!
There are two options to enter this trade:
1) Buy by market (SL $58 100)
2) Buy after a breakout of $61 000 (SL $60 000)
Take profit: $62 700 - $63 000
Stop loss: $58 000
Target: $62 700 - $63 000
Information is not at investment advice.
👍1
FBS Analytics
Good Morning traders. Dont chase EURUSD down trend. Declining for 6 sessions in a row. Instead, i would risk a long position around this area. Good Luck Nourldeen Al Hammoury
if you are still holding the positions. congrats for being patient. its wise to close some of the position if you have multiple contracts +70 pips. and let the rest run to 1.14. always aim for small losses and big winners. Enjoy
#TradingNews
☀️ Good morning traders! Here’s what you need to know for today
🇹🇷 Turkish lira rose 8% in a day due to news about further rate decrease. The pair is quite volatile for now and it looks like lira’s plunge against the dollar will continue
🥇 Gold is still consolidating. The main support levels are 1855 and 1850. Watch out for the news because they may push the metal in any direction. As for now the figures are rather bearish.
⚡️Higher energy costs caused Japanese consumer prices to edge up for a second month in October, with Prime Minister Fumio Kishida expected later Friday to deliver a stimulus package that includes countermeasures to ease the pain from more expensive fuel.
🇦🇺 Bank of Australia Chief said that one of the biggest risks banks faces when it comes to cryptocurrencies is being left out of the market altogether. Meanwhile, Bitcoin is still in a local downtrend. The next support area is at $55-54K.
🥈 Silver is also worth a look with inverse head & shoulders bullish pattern has been finished recently. The targets for the price of metal are $25.3 and $26.5
🍀 Except for the gold, what do you like to trade the most? Give us a pair and we’ll make an analysis
☀️ Good morning traders! Here’s what you need to know for today
🇹🇷 Turkish lira rose 8% in a day due to news about further rate decrease. The pair is quite volatile for now and it looks like lira’s plunge against the dollar will continue
🥇 Gold is still consolidating. The main support levels are 1855 and 1850. Watch out for the news because they may push the metal in any direction. As for now the figures are rather bearish.
⚡️Higher energy costs caused Japanese consumer prices to edge up for a second month in October, with Prime Minister Fumio Kishida expected later Friday to deliver a stimulus package that includes countermeasures to ease the pain from more expensive fuel.
🇦🇺 Bank of Australia Chief said that one of the biggest risks banks faces when it comes to cryptocurrencies is being left out of the market altogether. Meanwhile, Bitcoin is still in a local downtrend. The next support area is at $55-54K.
🥈 Silver is also worth a look with inverse head & shoulders bullish pattern has been finished recently. The targets for the price of metal are $25.3 and $26.5
🍀 Except for the gold, what do you like to trade the most? Give us a pair and we’ll make an analysis
👍1
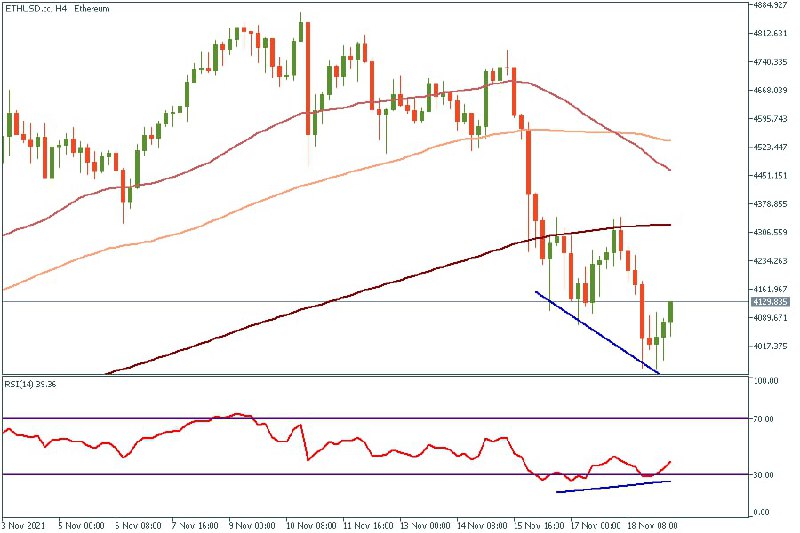
🔥🔥Crypto market finally recovers!
The bullish divergence occurred on ETH/USD H4 chart! It is a strong buy signal!
The bullish divergence occurred on ETH/USD H4 chart! It is a strong buy signal!
👍1
If you watch on your laptop, join the chat using this link ➡️➡️
https://t.me/fbsanalytics?voicechat=84898a74e9b574be54
https://t.me/fbsanalytics?voicechat=84898a74e9b574be54
Telegram
FBS Analytics
Market news & trade ideas & analysis and more by FBS team
More analytics: https://bit.ly/3q6UAUi
Start trading with FBS: https://bit.ly/2NH9X88
More analytics: https://bit.ly/3q6UAUi
Start trading with FBS: https://bit.ly/2NH9X88
Team, today is that day!😎😎
We have lots of trading ideas an here is one of them - HK50 is going to get pumped soon. 🇨🇳
There are 2 reasons:
1) If you check HK50 weekly chart you will find the reversed head with shoulders pattern.
2) There is reversed head with shoulders pattern on the RSI (H1 timeframe).
✅Do not hesitate indices, guys! You should know how to trade each instrument to be a professional!
We have lots of trading ideas an here is one of them - HK50 is going to get pumped soon. 🇨🇳
There are 2 reasons:
1) If you check HK50 weekly chart you will find the reversed head with shoulders pattern.
2) There is reversed head with shoulders pattern on the RSI (H1 timeframe).
✅Do not hesitate indices, guys! You should know how to trade each instrument to be a professional!

👍1
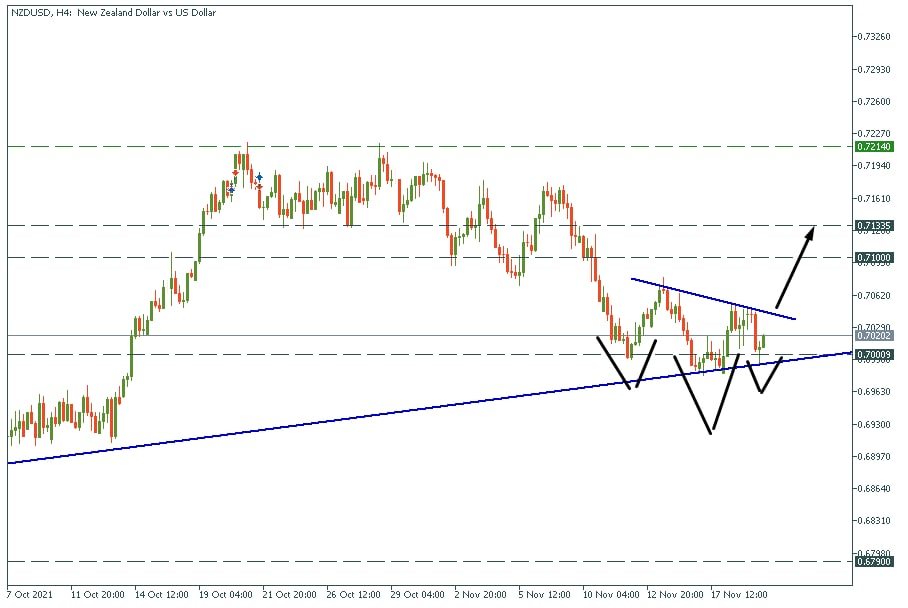
✅NZD/USD is drawing reversed head with shoulders pattern right above the support line
You already know what to do😉
You already know what to do😉
👍1
💭Last week was not full of events, but we still saw decent moves in the charts of majors, S&P500, NASDAQ, oil, and crypto.
The upcoming week will bring even more volatility to your favorite assets! Let’s look at the preview.➡
https://bit.ly/30JsNBP
The upcoming week will bring even more volatility to your favorite assets! Let’s look at the preview.➡
https://bit.ly/30JsNBP
FBS
Market news for November 22-26
Find out the main insights for Forex, stocks, oil, metal markets for the upcoming week
👍1
#MarketNews
☀️ Good morning, traders! It’s nice to meet you again in another fresh market report. Below this line you’ll find what to look after for this trading session. Let’s go!
🛢 Oil pressured to the downside but is on approach to key support levels which are $77.0 and $75.5. Crude oil inventories on Wednesday will help market to decide the further destination of the asset.
🇨🇳 Billionaire owners of Chinese developers have dipped into their own pockets for at least $3.8 billion to save their troubled companies from default. China Evergrande Group, whose share price dropped more than 80% this year, will be removed from the Hang Seng China Enterprises Index. The pressure on HK50 may decrease after such transformations.
💸 Avalanche cryptocurrency has signed a contract with Deloitte (one of the biggest audit companies in the world). This means that now the crypto gets an assessment and evaluation from the most legit source. The price of the coin has increased by 168% for the last month. AVX/USD pair is now available to trade with FBS. Join the crypto rally now.
🦃 In observation of the Thanksgiving Day holiday, both the US stock and bond market will close, and no trading will take place Thursday. Consider this in your trading strategies.
🥇 Gold is falling after several days of consolidation. The support line at $1845 has been tested several times and broken from above. Now the next short-term target for the metal is $1830.
📉 What are your thoughts of XAU/USD? Tell us in the comments!
☀️ Good morning, traders! It’s nice to meet you again in another fresh market report. Below this line you’ll find what to look after for this trading session. Let’s go!
🛢 Oil pressured to the downside but is on approach to key support levels which are $77.0 and $75.5. Crude oil inventories on Wednesday will help market to decide the further destination of the asset.
🇨🇳 Billionaire owners of Chinese developers have dipped into their own pockets for at least $3.8 billion to save their troubled companies from default. China Evergrande Group, whose share price dropped more than 80% this year, will be removed from the Hang Seng China Enterprises Index. The pressure on HK50 may decrease after such transformations.
💸 Avalanche cryptocurrency has signed a contract with Deloitte (one of the biggest audit companies in the world). This means that now the crypto gets an assessment and evaluation from the most legit source. The price of the coin has increased by 168% for the last month. AVX/USD pair is now available to trade with FBS. Join the crypto rally now.
🦃 In observation of the Thanksgiving Day holiday, both the US stock and bond market will close, and no trading will take place Thursday. Consider this in your trading strategies.
🥇 Gold is falling after several days of consolidation. The support line at $1845 has been tested several times and broken from above. Now the next short-term target for the metal is $1830.
📉 What are your thoughts of XAU/USD? Tell us in the comments!
👍2
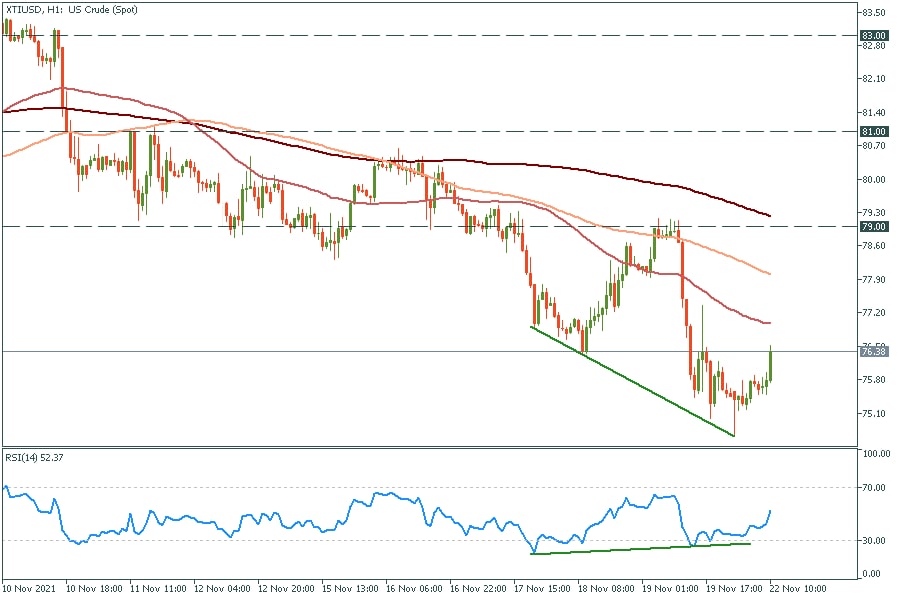
📈 Classic bullish divergence has been formed on H1 timeframe on US Crude Oil chart. Possible upside move may occur. Check it by yourself!
👍1