
What indicators do you use during your trading session? Let’s look through one of them, Rate of Change! ⏱
▪️Rate of Change (ROC) is a technical indicator of momentum, which measures the percentage change in price between the current price and the price a certain number of periods ago. The main difference between ROC and Momentum indicator is that ROC divides the difference between the current price and the price n periods ago by the price n periods ago and expresses it in percent. Most calculations for the momentum indicator don’t do it.
▪️Signals generated by the ROC indicator, like overbought and oversold conditions, breakthroughs, zero-line crossing, and divergences, give a perfect opportunity to trade.
➡️To add it to your chart, just choose “Insert”, then click “Indicator”, and in the “Custom” section, you’ll find “ROC”.
👌🏻The ROC perfectly collaborates with other indicators; Stochastic and Moving Averages are the best for such combinations.
✅Knowing how to use it will boost your technical analysis skill and provide a more exciting experience in Forex trading!
Have you already tried Rate of Change? Share your experience in the comments!⬇️
▪️Rate of Change (ROC) is a technical indicator of momentum, which measures the percentage change in price between the current price and the price a certain number of periods ago. The main difference between ROC and Momentum indicator is that ROC divides the difference between the current price and the price n periods ago by the price n periods ago and expresses it in percent. Most calculations for the momentum indicator don’t do it.
▪️Signals generated by the ROC indicator, like overbought and oversold conditions, breakthroughs, zero-line crossing, and divergences, give a perfect opportunity to trade.
➡️To add it to your chart, just choose “Insert”, then click “Indicator”, and in the “Custom” section, you’ll find “ROC”.
👌🏻The ROC perfectly collaborates with other indicators; Stochastic and Moving Averages are the best for such combinations.
✅Knowing how to use it will boost your technical analysis skill and provide a more exciting experience in Forex trading!
Have you already tried Rate of Change? Share your experience in the comments!⬇️
👍25🔥6
📈Earnings season has started! Great chance to trade stocks!✨
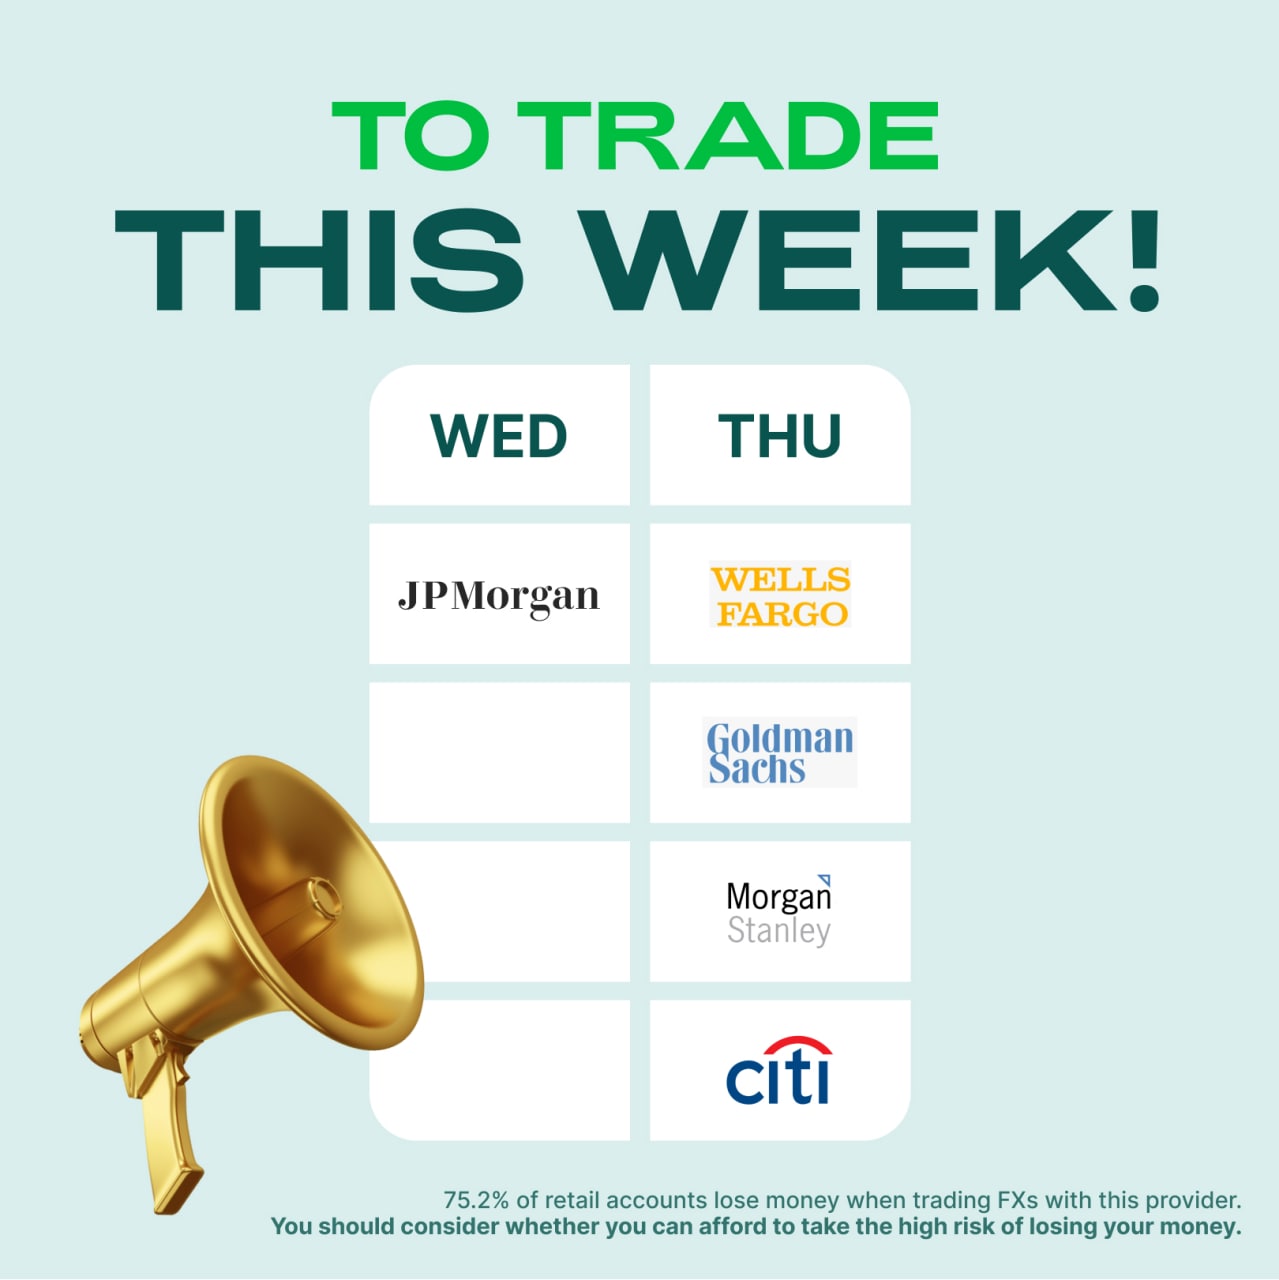
Yesterday, April 13, JP Morgan published its earnings report. The bank’s first-quarter earnings fell sharply from a year ago due to higher bad loan spending and market turmoil prompted by the war in Ukraine.
Adjusted earnings are $2.76 per share versus $2.69. Revenue is 31.59 billion dollars against the forecast of 30.86 billion dollars. Earnings fell 42% year-over-year to $8.28 billion, or $2.63 per share, according to the New York-based bank. Adjusted profit of $2.76 excluding Russia was 13% above analysts' number of $2.69. Shares of the bank dipped 3.2%, reaching a new 52-week low.
Today, April 14, be ready to trade: Wells Fargo, Citigroup, Morgan Stanley, Goldman Sachs.
❗️Don’t forget, the stocks are available for trading on weekdays from 15:30 to 22:00 MT!
What stock’s results is preferable for you? Share in the comments!⬇️
Yesterday, April 13, JP Morgan published its earnings report. The bank’s first-quarter earnings fell sharply from a year ago due to higher bad loan spending and market turmoil prompted by the war in Ukraine.
Adjusted earnings are $2.76 per share versus $2.69. Revenue is 31.59 billion dollars against the forecast of 30.86 billion dollars. Earnings fell 42% year-over-year to $8.28 billion, or $2.63 per share, according to the New York-based bank. Adjusted profit of $2.76 excluding Russia was 13% above analysts' number of $2.69. Shares of the bank dipped 3.2%, reaching a new 52-week low.
Today, April 14, be ready to trade: Wells Fargo, Citigroup, Morgan Stanley, Goldman Sachs.
❗️Don’t forget, the stocks are available for trading on weekdays from 15:30 to 22:00 MT!
What stock’s results is preferable for you? Share in the comments!⬇️
🔥15👍11🥰3
🔥 US CORE RETAIL SALES 1.1% VS 1.0% EXPECTED
🔥 UNEMPLOYMENT CLAIMS 185K VS 172K EXPECTED
Wait for the volatility
🔥 UNEMPLOYMENT CLAIMS 185K VS 172K EXPECTED
Wait for the volatility
🔥20👍12❤6👏2

#MarketNews
🇨🇳Stocks fell in Asia Friday as China unexpectedly opted against cutting a key policy interest rate, a reduction that had been widely expected to support an economy hamstrung by Covid lockdowns.
🥚US markets are closed today due to Easter. Forex and crypto trading is available.
🇯🇵At the April meeting, the BOJ is expected to raise its fiscal 2022 inflation forecast to above 1.5%, up from the current 1.1%. USDJPY is extremely bullish, with a possible target at 135.00.
🛢Oil reached $111.00 a barrel amid rising concerns that supply disruptions continue.
☢️Yesterday, a big player withdrew more than 27 000 Bitcoins ($10.8 billion) from an exchange. It is an extremely bullish sign for the price.
What are you looking at today?
🇨🇳Stocks fell in Asia Friday as China unexpectedly opted against cutting a key policy interest rate, a reduction that had been widely expected to support an economy hamstrung by Covid lockdowns.
🥚US markets are closed today due to Easter. Forex and crypto trading is available.
🇯🇵At the April meeting, the BOJ is expected to raise its fiscal 2022 inflation forecast to above 1.5%, up from the current 1.1%. USDJPY is extremely bullish, with a possible target at 135.00.
🛢Oil reached $111.00 a barrel amid rising concerns that supply disruptions continue.
☢️Yesterday, a big player withdrew more than 27 000 Bitcoins ($10.8 billion) from an exchange. It is an extremely bullish sign for the price.
What are you looking at today?
👍27🤔16🔥6🎉5
Know your candlesticks
Traders look at Japanese candles every day to check the situation on the market and use this opportunity to trade. What are they in general? Why do we need them? Let’s discuss.
🟢Candlestick chart is one of the chart types used in financial markets. A single candlestick shows the price dynamics during a particular period. For example, if you are at the M5 timeframe, each candlestick corresponds to 5 minutes of the price action.
🔴A candlestick consists of a body and vertical lines above and below it, named “shadows”, “wicks”, or “tails”. The wicks pinpoint the highest and lowest price during the time span of a candlestick.
🟢If the prices rose during the period, the candle is usually painted green and called bullish. In this case, the opening price is at the bottom of the body, and the closing price is at its top. If the prices fell, the candle is usually painted red and called bearish. In this case, the opening price is at the top of the body, and the closing price is at its bottom. In most cases, they represent the mirror images of each other.
🔴Candlesticks can tell traders a lot. Long candlesticks signal a very active session and short candlesticks hint at a stable and indecisive market. If you know what each candlestick shape means, you will know whether the price move is strong or weak. You will also manage to predict the future direction of the price chart.
Hope it was interesting and useful for you! Download the FBS Trader app to try the candles out! ✨
Traders look at Japanese candles every day to check the situation on the market and use this opportunity to trade. What are they in general? Why do we need them? Let’s discuss.
🟢Candlestick chart is one of the chart types used in financial markets. A single candlestick shows the price dynamics during a particular period. For example, if you are at the M5 timeframe, each candlestick corresponds to 5 minutes of the price action.
🔴A candlestick consists of a body and vertical lines above and below it, named “shadows”, “wicks”, or “tails”. The wicks pinpoint the highest and lowest price during the time span of a candlestick.
🟢If the prices rose during the period, the candle is usually painted green and called bullish. In this case, the opening price is at the bottom of the body, and the closing price is at its top. If the prices fell, the candle is usually painted red and called bearish. In this case, the opening price is at the top of the body, and the closing price is at its bottom. In most cases, they represent the mirror images of each other.
🔴Candlesticks can tell traders a lot. Long candlesticks signal a very active session and short candlesticks hint at a stable and indecisive market. If you know what each candlestick shape means, you will know whether the price move is strong or weak. You will also manage to predict the future direction of the price chart.
Hope it was interesting and useful for you! Download the FBS Trader app to try the candles out! ✨

👍61❤9👏7🔥3😁3
Happy Friday, guys! 🎉
We hope that you had a perfect trading week!
We prepared some new materials to look through at the weekends! ⬇️
▪️OUR NEW VIDEO - Top 3 Best Reversal patterns - https://youtu.be/1hcvQfH_xE0
▪️What is rate on change and how to use it for profitable trading? – https://bit.ly/3vhAyea
▪️What cryptocurrency should you keep an eye on? - https://bit.ly/3xINxIL
▪️What is the situation on the market and what trades ideas are the best this week? - https://bit.ly/3JFD03i
How was your week? Share in the comments!⬇️
We hope that you had a perfect trading week!
We prepared some new materials to look through at the weekends! ⬇️
▪️OUR NEW VIDEO - Top 3 Best Reversal patterns - https://youtu.be/1hcvQfH_xE0
▪️What is rate on change and how to use it for profitable trading? – https://bit.ly/3vhAyea
▪️What cryptocurrency should you keep an eye on? - https://bit.ly/3xINxIL
▪️What is the situation on the market and what trades ideas are the best this week? - https://bit.ly/3JFD03i
How was your week? Share in the comments!⬇️
YouTube
3 Reversal Patterns you HAVE to Know About!
By the end of this video you will learn three amazing patterns which can help you to spot the market reversal!
Join our Telegram channel: https://t.me/fbsanalytics
Join FBS!
Download FBS Trader for fast and convenient mobile trading: https://bit.ly/3zFappV…
Join our Telegram channel: https://t.me/fbsanalytics
Join FBS!
Download FBS Trader for fast and convenient mobile trading: https://bit.ly/3zFappV…
👍41❤7🔥7😁4👏2
NEW VIDEO: Continuation Patterns! 😱
📈We continue talking about patterns, and now it’s time to learn about continuation ones! We’ll tell you about TOP 3 the most popular of them! Watch it and don’t forget to subscribe to our Youtube channel if you haven’t done it yet! 👍🏻
Like this video and leave a comment👌🏻
https://www.youtube.com/watch?v=FG8ozcwm1nA
📈We continue talking about patterns, and now it’s time to learn about continuation ones! We’ll tell you about TOP 3 the most popular of them! Watch it and don’t forget to subscribe to our Youtube channel if you haven’t done it yet! 👍🏻
Like this video and leave a comment👌🏻
https://www.youtube.com/watch?v=FG8ozcwm1nA

🔥15👍12❤5😢3😁2
Hi traders! ✨
If you’re wondering what to do on Sunday when the market is sleeping, we suggest you reading some educational articles and watching analytical videos that our team made!
❗️Remember, the more you learn and read about strategies and news, the more you’re sure about your trading decisions.
INDICES
How to trade NASDAQ? - https://bit.ly/3Efr3A5
OIL
How to Make a Profit in Crude Oil Trading? - https://bit.ly/3uH6yJC
GOLD
Gold trading strategies - https://bit.ly/3M6fBte
What you need to know about Gold - https://bit.ly/3M85Qem
STOCKS
How to find and trade a growth stock - https://bit.ly/3M7y1d0
Earning on dividends - https://bit.ly/3rrSYaL
How to choose stocks? - https://bit.ly/3vhJ10W
How to trade stocks with FBS? - https://bit.ly/3xtftAb
What is Blue Chip Stock? - https://bit.ly/3jF1DSV
What you need to know before trading stocks - https://bit.ly/37dPyBR
PRICE ACTION
Breaking down the price action system- https://bit.ly/3rNnJr9
Trading strategy ‘HHLL’- https://bit.ly/3EbXgbE
How to Trade Trend Pullbacks - https://bit.ly/3KIfjZv
1-2-3 Reversal pattern strategy - https://bit.ly/3KNYGeP
Is Ross Hook the Most Powerful Price Action Pattern? - https://bit.ly/3uFD8eI
INDICATOR STRATEGIES
Strategy For Flat Trading: Rubber Band - https://bit.ly/3EhVXIi
Awesome Oscillator: perfect tool for trader - https://bit.ly/37JcoB3
Stochastic Oscillator: best tool for trade - https://bit.ly/3rsTTbb
MACD indicator: How to find trend reversal - https://bit.ly/3vhLcBE
RSI Indicator: every trader must have instrument- https://bit.ly/3EfprGL
Bollinger Bands: must-have tool in your trading arsenal - https://bit.ly/3jzHVbr
A scalping strategy you were hungry for - https://bit.ly/3vhtXjQ
Magic trading strategy with Ichimoku - https://bit.ly/3Ob4hhg
Share in the comments what would be interesting for you to learn about, and we’ll definitely do it! ⬇️
If you’re wondering what to do on Sunday when the market is sleeping, we suggest you reading some educational articles and watching analytical videos that our team made!
❗️Remember, the more you learn and read about strategies and news, the more you’re sure about your trading decisions.
INDICES
How to trade NASDAQ? - https://bit.ly/3Efr3A5
OIL
How to Make a Profit in Crude Oil Trading? - https://bit.ly/3uH6yJC
GOLD
Gold trading strategies - https://bit.ly/3M6fBte
What you need to know about Gold - https://bit.ly/3M85Qem
STOCKS
How to find and trade a growth stock - https://bit.ly/3M7y1d0
Earning on dividends - https://bit.ly/3rrSYaL
How to choose stocks? - https://bit.ly/3vhJ10W
How to trade stocks with FBS? - https://bit.ly/3xtftAb
What is Blue Chip Stock? - https://bit.ly/3jF1DSV
What you need to know before trading stocks - https://bit.ly/37dPyBR
PRICE ACTION
Breaking down the price action system- https://bit.ly/3rNnJr9
Trading strategy ‘HHLL’- https://bit.ly/3EbXgbE
How to Trade Trend Pullbacks - https://bit.ly/3KIfjZv
1-2-3 Reversal pattern strategy - https://bit.ly/3KNYGeP
Is Ross Hook the Most Powerful Price Action Pattern? - https://bit.ly/3uFD8eI
INDICATOR STRATEGIES
Strategy For Flat Trading: Rubber Band - https://bit.ly/3EhVXIi
Awesome Oscillator: perfect tool for trader - https://bit.ly/37JcoB3
Stochastic Oscillator: best tool for trade - https://bit.ly/3rsTTbb
MACD indicator: How to find trend reversal - https://bit.ly/3vhLcBE
RSI Indicator: every trader must have instrument- https://bit.ly/3EfprGL
Bollinger Bands: must-have tool in your trading arsenal - https://bit.ly/3jzHVbr
A scalping strategy you were hungry for - https://bit.ly/3vhtXjQ
Magic trading strategy with Ichimoku - https://bit.ly/3Ob4hhg
Share in the comments what would be interesting for you to learn about, and we’ll definitely do it! ⬇️
FBS
How to Trade Nasdaq? Benchmark for the US Tech Stocks
The stock market is full of various indices. Nasdaq is just one of them. But why is it so popular among traders? What makes it so special? Let’s find out.
👍74❤5👎2👏2😱2
#MarketNews
☀️Good morning traders! Are you ready for a new week? Here are some news you need to know:
💱Japanese and Chinese shares fell along with the S&P 500 and Nasdaq 100 contracts.
🛢Natural gas and oil rose, partly because of the risks associated with Russia's war in Ukraine. These include the possibility of a de facto EU embargo on Russian gas and the threat of some restrictions on crude oil under the next European sanctions. At the moment, XBRUSD is $111 and XNGUSD is $7.607.
🇺🇸Concerns are growing that the US economy faces a downturn as the Fed turns to aggressive policy tightening to curb rising costs of living.
☢️Bitcoin traded just below the $40 000 threshold that started the weekend. Now it’s approximately $38 900.
📈The two big names reporting this week will be Netflix (NFLX) and Tesla (TSLA), offering an early look at how some mega-cap tech companies performed earlier in the year.
What’s in economic calendar this week?
April 20, 15:30 MT CAD CPI m/m
April 21, 01:45 MT NZD CPI q/q
April 22, 10:30 MT German Flash Services PMI
Have a great day!✨
☀️Good morning traders! Are you ready for a new week? Here are some news you need to know:
💱Japanese and Chinese shares fell along with the S&P 500 and Nasdaq 100 contracts.
🛢Natural gas and oil rose, partly because of the risks associated with Russia's war in Ukraine. These include the possibility of a de facto EU embargo on Russian gas and the threat of some restrictions on crude oil under the next European sanctions. At the moment, XBRUSD is $111 and XNGUSD is $7.607.
🇺🇸Concerns are growing that the US economy faces a downturn as the Fed turns to aggressive policy tightening to curb rising costs of living.
☢️Bitcoin traded just below the $40 000 threshold that started the weekend. Now it’s approximately $38 900.
📈The two big names reporting this week will be Netflix (NFLX) and Tesla (TSLA), offering an early look at how some mega-cap tech companies performed earlier in the year.
What’s in economic calendar this week?
April 20, 15:30 MT CAD CPI m/m
April 21, 01:45 MT NZD CPI q/q
April 22, 10:30 MT German Flash Services PMI
Have a great day!✨
👏19👍16🔥11❤7🤯3
FBS Analytics
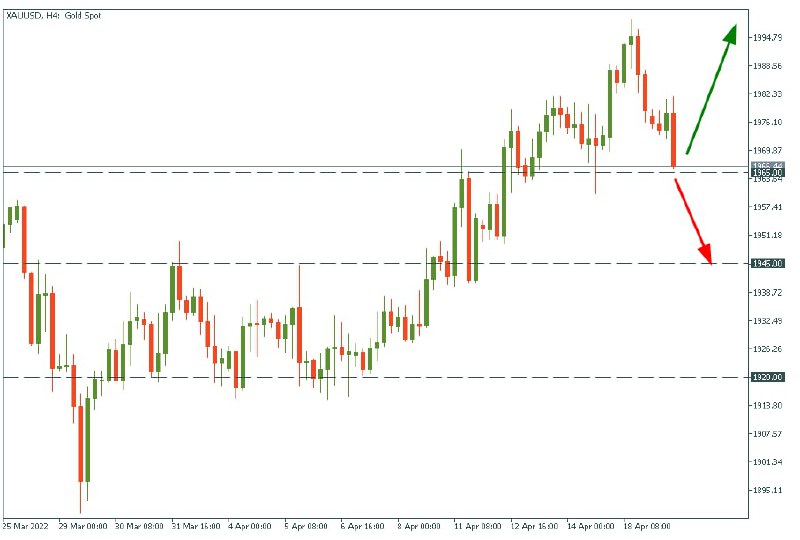
🥇#GOLD If Gold closes the H4 candle above $1965, it will still be bullish with the target at $2050. Otherwise, it will drop to $1945.
Is anyone still holding it? 😏
👍44🔥11🤬7💩7🤮3👏2
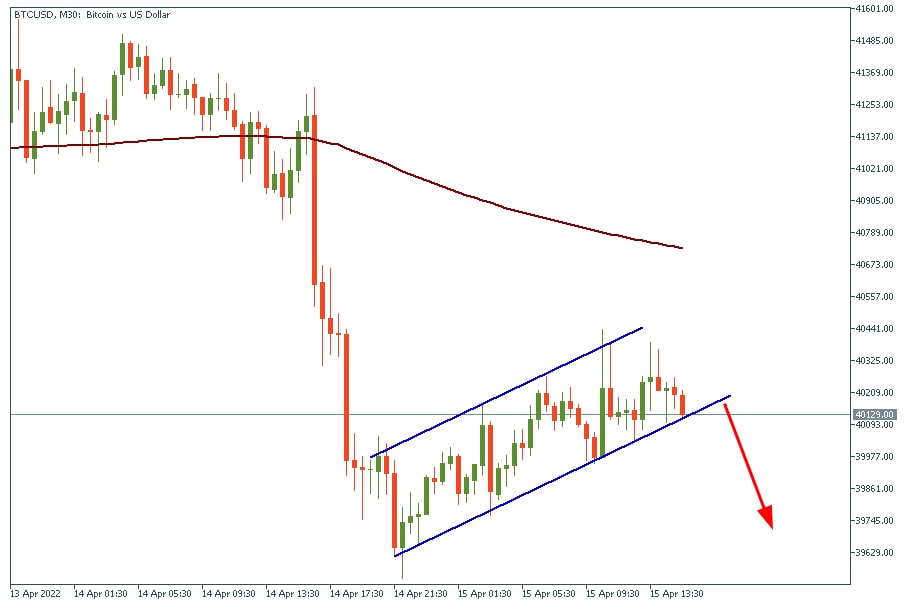
☢️#BTCUSD
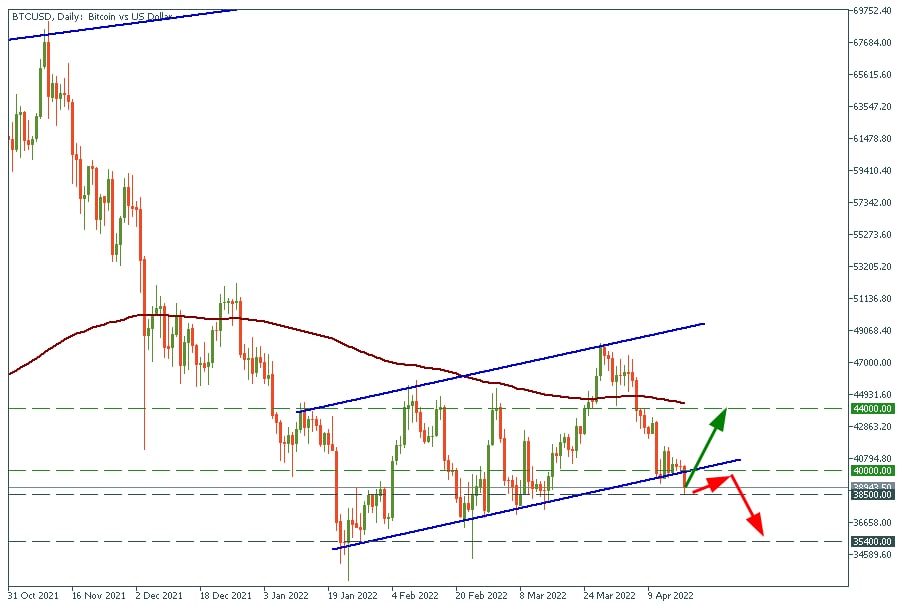
Bitcoin is breaking out of the bearish flag!
At the beginning of the trading session, the first cryptocurrency broke through the lower border of this pattern.
The situation will stabilize if bulls push the price above this line by the end of today's trading session.
Otherwise, it will signify the strong upcoming dump in risk assets.
Bitcoin is breaking out of the bearish flag!
At the beginning of the trading session, the first cryptocurrency broke through the lower border of this pattern.
The situation will stabilize if bulls push the price above this line by the end of today's trading session.
Otherwise, it will signify the strong upcoming dump in risk assets.
🔥15👍13❤4
❓ What asset do you trade the most? (Except for gold, please. We know that you love it. What else do you trade?)
👍10🔥4🤔4🥰3
🇪🇺🇺🇸#EURUSD
🧐The reversal is about to happen?
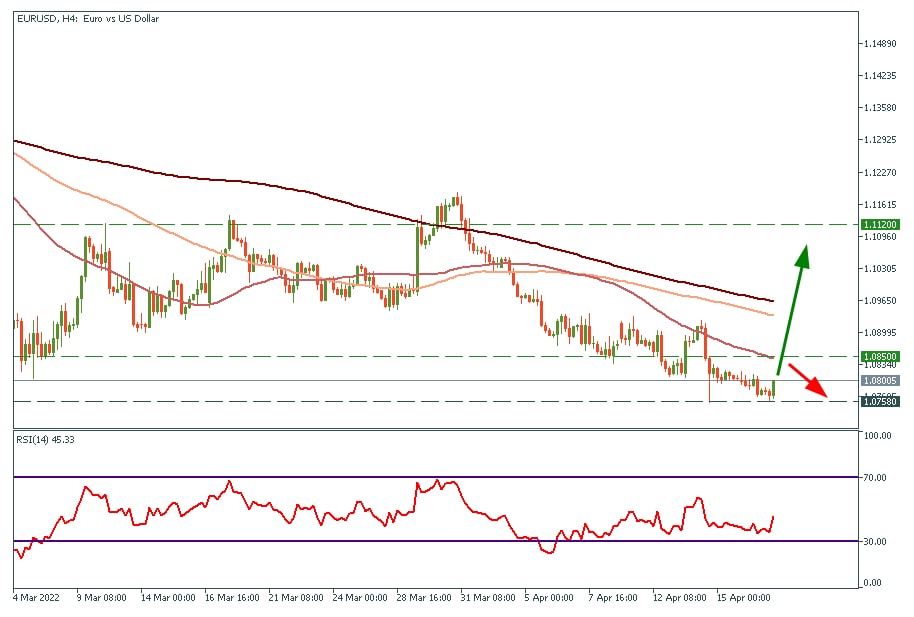
The price is bouncing from the support level of 1.0750. We expect EURUSD to increase at least to 1.0850. Here the main battle between bulls and bears will happen.
If the price gets rejected from 1.0850, it will decline to 1.0750 again.
Otherwise, we might see a massive pump to 1.1120.
What is your trading plan for EURUSD?
🧐The reversal is about to happen?
The price is bouncing from the support level of 1.0750. We expect EURUSD to increase at least to 1.0850. Here the main battle between bulls and bears will happen.
If the price gets rejected from 1.0850, it will decline to 1.0750 again.
Otherwise, we might see a massive pump to 1.1120.
What is your trading plan for EURUSD?
🔥22👍19😢7
FBS Analytics pinned «Hi traders! ✨ If you’re wondering what to do on Sunday when the market is sleeping, we suggest you reading some educational articles and watching analytical videos that our team made! ❗️Remember, the more you learn and read about strategies and news, the more…»
#Education
🎓ABC of currencies
Welcome to our weekly post, where we tell you about basic vocabulary in the trading world. Today we’ll talk about currencies!😎
In Forex, you deal in currencies. When placing an order on Forex, you buy one currency and sell another simultaneously, i.e., if you pick the EURUSD pair to purchase, you buy the euro and sell the dollar. In a pair, one currency will be stronger than the other, although the currency strength isn’t a constant and can change due to certain reasons, usually – important financial events in the region. Therefore, it makes sense to compare the currencies and value them against each other.
There are three types of pairs:
1) Majors or major pairs are the most popular Forex pairs and take up most of the trades on the market. There are seven of them:
EUR/USD, USD/JPY, GBP/USD, USD/CHF, AUD/USD, USD/CAD, NZD/USD.
As you can see, all Forex majors include the USD and another widespread currency. Together these pairs amount to about 75% of all trades – hence the name.
2) Cross pairs are the popular currency pairs made up of major currencies other than the US dollar. These include some of the most traded currencies, like EUR, GBP, or JPY. Some time ago, traders had to convert them through the American dollar (i.e. EURUSD and USDJPY), but now you can trade them directly, for example, making buy/sell trades in EURJPY. Even though the USD is still extremely popular, cross pairs trading is also quite common and convenient.
3) Exotic pairs are the pairs where one currency is a popular one like the USD, and the other one is a rare currency, usually a currency of a developing or emerging economy, such as the Mexican peso or the Brazilian real.
These types usually reflect the liquidity and the volatility of currency pairs. More popular pairs (such as major pairs) have higher liquidity. You can easily buy and sell EUR/USD in large quantities and not risk high variance. Volatility depends on the number of orders with this particular currency on the market, the region’s economic well-being, and certain macroeconomic events. Currencies with lower liquidity have higher volatility and vice versa. Generally, the less popular a pair, such as an exotic pair, the higher its volatility. High volatility can be a risk for traders, although it can also bring great profits: it all depends on your trading style and strategies.
Start trading with FBS!
💲What currency pairs are your favorite to trade? Write in the comments!
🎓ABC of currencies
Welcome to our weekly post, where we tell you about basic vocabulary in the trading world. Today we’ll talk about currencies!😎
In Forex, you deal in currencies. When placing an order on Forex, you buy one currency and sell another simultaneously, i.e., if you pick the EURUSD pair to purchase, you buy the euro and sell the dollar. In a pair, one currency will be stronger than the other, although the currency strength isn’t a constant and can change due to certain reasons, usually – important financial events in the region. Therefore, it makes sense to compare the currencies and value them against each other.
There are three types of pairs:
1) Majors or major pairs are the most popular Forex pairs and take up most of the trades on the market. There are seven of them:
EUR/USD, USD/JPY, GBP/USD, USD/CHF, AUD/USD, USD/CAD, NZD/USD.
As you can see, all Forex majors include the USD and another widespread currency. Together these pairs amount to about 75% of all trades – hence the name.
2) Cross pairs are the popular currency pairs made up of major currencies other than the US dollar. These include some of the most traded currencies, like EUR, GBP, or JPY. Some time ago, traders had to convert them through the American dollar (i.e. EURUSD and USDJPY), but now you can trade them directly, for example, making buy/sell trades in EURJPY. Even though the USD is still extremely popular, cross pairs trading is also quite common and convenient.
3) Exotic pairs are the pairs where one currency is a popular one like the USD, and the other one is a rare currency, usually a currency of a developing or emerging economy, such as the Mexican peso or the Brazilian real.
These types usually reflect the liquidity and the volatility of currency pairs. More popular pairs (such as major pairs) have higher liquidity. You can easily buy and sell EUR/USD in large quantities and not risk high variance. Volatility depends on the number of orders with this particular currency on the market, the region’s economic well-being, and certain macroeconomic events. Currencies with lower liquidity have higher volatility and vice versa. Generally, the less popular a pair, such as an exotic pair, the higher its volatility. High volatility can be a risk for traders, although it can also bring great profits: it all depends on your trading style and strategies.
Start trading with FBS!
💲What currency pairs are your favorite to trade? Write in the comments!

👍35😢3