
#MarketNews
Good morning, dear traders! Hope you’re doing well!💫
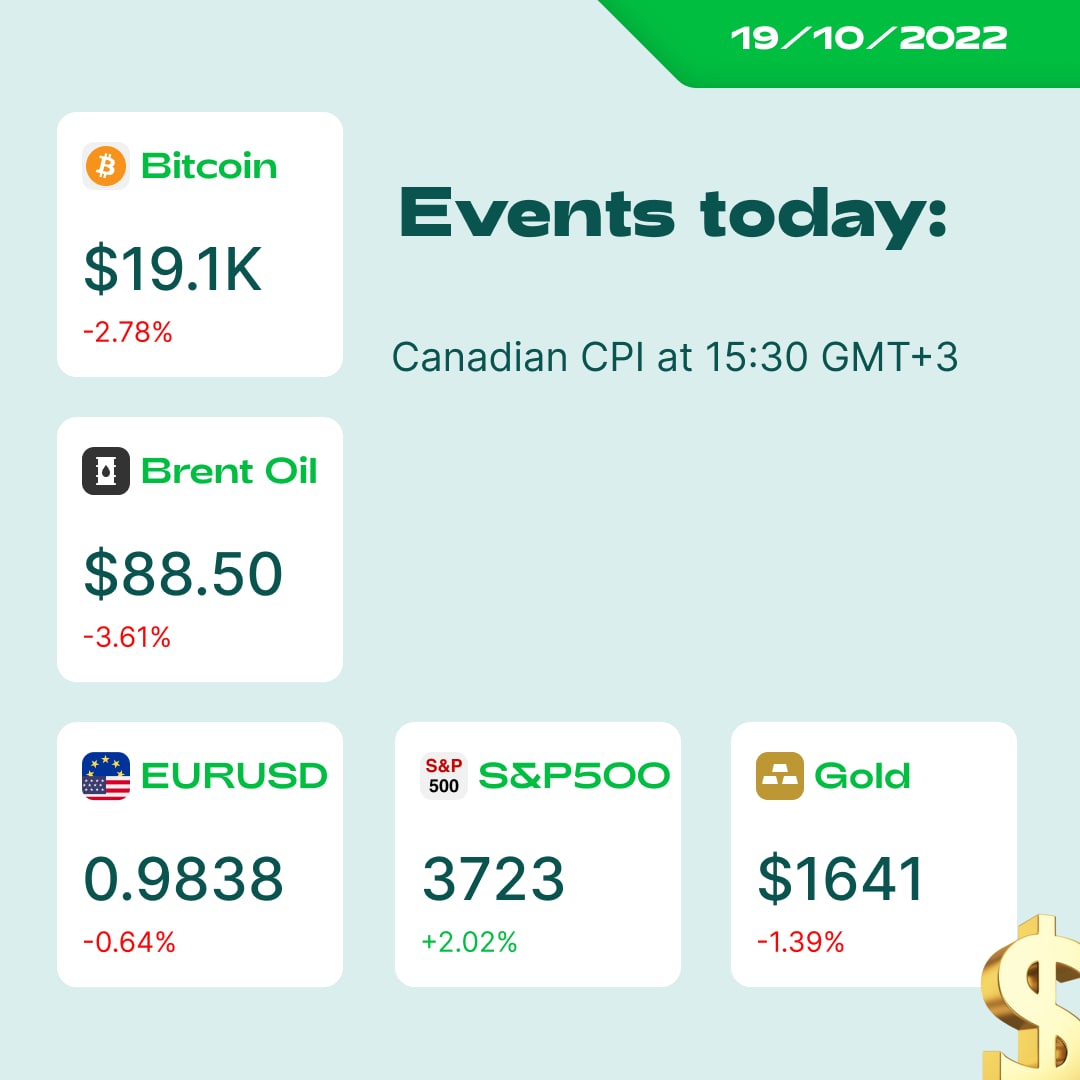
This day should be active, and the market is waiting for today’s Canadian CPI release at 15:30 GMT+3. Let’s discuss the news that is interesting today!
🇬🇧Inflation in the UK turned out to be higher than expected. UK CPI year by year was 10.1%, the forecast was 10%, and the previous was 9.9%. GBPUSD is 1.1260.
🍏Apple announced plans of cutting production of the iPhone 14 Plus. After this news, Apple stock fell by 4%.
📺Netflix reported an increase in subscribers and exceeded earnings expectations. Its stock is up by 15%.
🛢Oil rose from a two-week low on fears that the latest EU sanctions on Russian fuel could exacerbate market tensions. In addition, the Biden administration will announce a plan to release 15 million barrels of US emergency oil supplies on Wednesday to ease high gasoline prices. XTIUSD is 82.
☢️Bitcoin and Ethereum fell amid news that the European Union is considering a bill to limit the mining of energy-intensive cryptocurrencies like Bitcoin. BTCSUSD is 19100.
Read the full news and oil analysis here: https://bit.ly/3s4iGSP
Have a wonderful day! What assets are attractive for you today? Share in the comments!✨
Good morning, dear traders! Hope you’re doing well!💫
This day should be active, and the market is waiting for today’s Canadian CPI release at 15:30 GMT+3. Let’s discuss the news that is interesting today!
🇬🇧Inflation in the UK turned out to be higher than expected. UK CPI year by year was 10.1%, the forecast was 10%, and the previous was 9.9%. GBPUSD is 1.1260.
🍏Apple announced plans of cutting production of the iPhone 14 Plus. After this news, Apple stock fell by 4%.
📺Netflix reported an increase in subscribers and exceeded earnings expectations. Its stock is up by 15%.
🛢Oil rose from a two-week low on fears that the latest EU sanctions on Russian fuel could exacerbate market tensions. In addition, the Biden administration will announce a plan to release 15 million barrels of US emergency oil supplies on Wednesday to ease high gasoline prices. XTIUSD is 82.
☢️Bitcoin and Ethereum fell amid news that the European Union is considering a bill to limit the mining of energy-intensive cryptocurrencies like Bitcoin. BTCSUSD is 19100.
Read the full news and oil analysis here: https://bit.ly/3s4iGSP
Have a wonderful day! What assets are attractive for you today? Share in the comments!✨
👍25🔥8❤🔥3👏3🥰2🐳1
🥇#XAUUSD
🔥XAUUSD update!
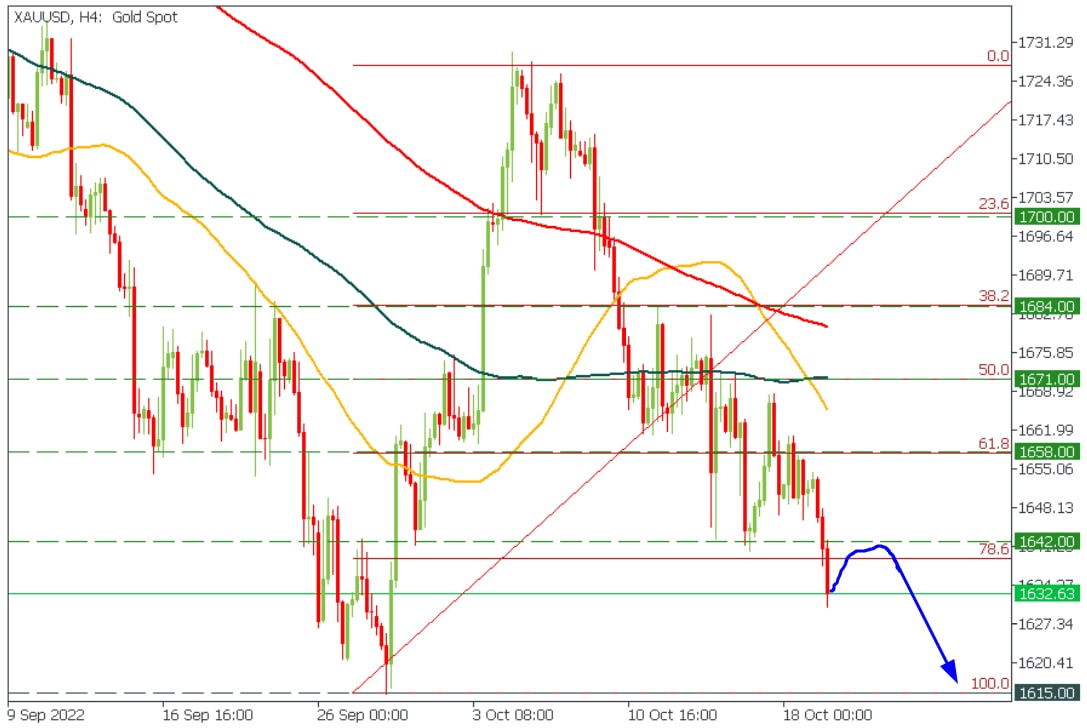
The price declined below 1642.00, which is 78.6 Fibonacci level. Now this level acts as major support for the yellow metal. Thus, we suggest you to sell XAUUSD if the price pulls back to 1642.00.
🎯Currently, our primary target for XAUUSD is 1615.00.
✅START TRADING ✅
🔥XAUUSD update!
The price declined below 1642.00, which is 78.6 Fibonacci level. Now this level acts as major support for the yellow metal. Thus, we suggest you to sell XAUUSD if the price pulls back to 1642.00.
🎯Currently, our primary target for XAUUSD is 1615.00.
✅START TRADING ✅
👍33❤9🔥8🤬7
FBS Analytics
🇺🇸🇯🇵#USDJPY 🔥USDJPY has broke through the upper border of the ascending triangle! According to the Fibonacci Retracement, the pair will head towards 149.40 after the breakout above 145.90! Do you think it is possible? ❤️ START TRADING ❤️
🇺🇸🇯🇵#USDJPY
🔥⚡️USDJPY keeps following our ideas!
🥳Nine days. Nine green candles. +3500 points. Congratulations to everybody who followed the idea!
The pair has formed a 148.88 - 149.40 support range. Consider buying USDJPY inside this range or follow the trend by opening buy trades every time the price breaks through the previous high!
🎯Our next targets are 151.32 and 153.40.
✅START TRADING ✅
🔥⚡️USDJPY keeps following our ideas!
🥳Nine days. Nine green candles. +3500 points. Congratulations to everybody who followed the idea!
The pair has formed a 148.88 - 149.40 support range. Consider buying USDJPY inside this range or follow the trend by opening buy trades every time the price breaks through the previous high!
🎯Our next targets are 151.32 and 153.40.
✅START TRADING ✅
👍33🔥8❤🔥6💩4❤3🤔3🤬3👏1
Fibonacci retracement explained👌🏻
💫 Fibonacci instruments seem like something very mysterious. However, they have their logic and its fans! Let’s see how works one of them- Fibonacci retracement.
🔹Fibonacci retracement levels are horizontal lines that have high support and resistance levels.
🔹Each level is associated with a percentage. The percentage shows how much the price has rolled back from the previous movement. Fibonacci retracement levels are 23.6%, 38.2%, 61.8% and 78.6%. While a 50% Fibonacci ratio is not official, it’s also used.
🔹The indicator is useful because it can be drawn between two sensitive points, as a maximum and a minimum. Then an indicator of the presence of levels between six two points.
🔹Let’s see an example. Imagine the asset’s price rises $10 and then drops $2.36. In this case, it pulled back 23.6%, a Fibonacci number. By the way, you can find Fibonacci numbers in nature. Therefore, many traders believe these facts are also relevant to historical markets.
How often do you use Fibonacci tools? Share in the comments! ⬇️
💫 Fibonacci instruments seem like something very mysterious. However, they have their logic and its fans! Let’s see how works one of them- Fibonacci retracement.
🔹Fibonacci retracement levels are horizontal lines that have high support and resistance levels.
🔹Each level is associated with a percentage. The percentage shows how much the price has rolled back from the previous movement. Fibonacci retracement levels are 23.6%, 38.2%, 61.8% and 78.6%. While a 50% Fibonacci ratio is not official, it’s also used.
🔹The indicator is useful because it can be drawn between two sensitive points, as a maximum and a minimum. Then an indicator of the presence of levels between six two points.
🔹Let’s see an example. Imagine the asset’s price rises $10 and then drops $2.36. In this case, it pulled back 23.6%, a Fibonacci number. By the way, you can find Fibonacci numbers in nature. Therefore, many traders believe these facts are also relevant to historical markets.
How often do you use Fibonacci tools? Share in the comments! ⬇️

👍59❤21🔥12❤🔥6🍌6👏5👎4🤩4😍2😁1🍓1
🇺🇸🇨🇦#USDCAD
💥⚡️USDCAD might decline soon!
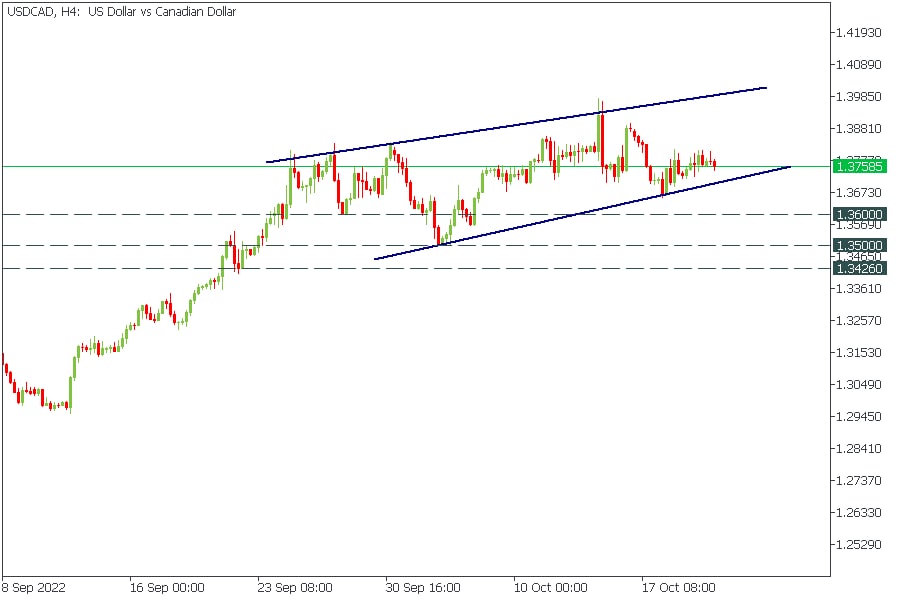
The price has formed a rising bearish wedge. Consider selling USDCAD after a breakout of the lower wedge's border.
🎯Targets: 1.3600, 1.3500, 1.3426
❗️Enter this trade only after a breakout❗️
✅START TRADING ✅
💥⚡️USDCAD might decline soon!
The price has formed a rising bearish wedge. Consider selling USDCAD after a breakout of the lower wedge's border.
🎯Targets: 1.3600, 1.3500, 1.3426
❗️Enter this trade only after a breakout❗️
✅START TRADING ✅
👍25❤5💩3❤🔥2🍌2⚡1
#MarketNews
🌅 Morning, traders! China delays GDP data because of potentially harmful numbers, but we will never delay our news because every release is an opportunity to trade on it! Here’s what will move markets today:
🇺🇸Federal Reserve member Bullard said Fed needs to reach the highest rate level at which inflation starts to shrink before making other moves. Still, he expects to see a slowdown in rising prices over 2023.
🇨🇦 Monthly CPI in Canada surpassed expectations (0.1% actual vs. -0.1% forecast). However, USDCAD remained still because Median CPI (another inflation measure) was down by 0.1%. Economists expect the Bank of Canada to continue its aggressive rate hike campaign.
💸 An unusual transaction happened in the Ethereum network. Someone paid 121 ETH ($150 000) as a fee for a transfer from one address to another. It’s one of the biggest fees paid ever. There are rumors such actions is a fraud and may lead to an emergency upgrade of the blockchain.
🇬🇧 Liz Truss has fired a minister because of the security breach. Many lawmakers in the UK want her to resign immediately, after only six weeks in the post. GBPUSD is about to have another red week.
🇯🇵The USDJPY surged to the highest level since 1990, touching the critical resistance of 150. We expect sellers to step into the game on the current levels.
Here you can find our analysis of the pair with entry points and take profits: https://bit.ly/3CQYqJc
💭 Write your thoughts on the market in the comments and have a beautiful trading day!
🌅 Morning, traders! China delays GDP data because of potentially harmful numbers, but we will never delay our news because every release is an opportunity to trade on it! Here’s what will move markets today:
🇺🇸Federal Reserve member Bullard said Fed needs to reach the highest rate level at which inflation starts to shrink before making other moves. Still, he expects to see a slowdown in rising prices over 2023.
🇨🇦 Monthly CPI in Canada surpassed expectations (0.1% actual vs. -0.1% forecast). However, USDCAD remained still because Median CPI (another inflation measure) was down by 0.1%. Economists expect the Bank of Canada to continue its aggressive rate hike campaign.
💸 An unusual transaction happened in the Ethereum network. Someone paid 121 ETH ($150 000) as a fee for a transfer from one address to another. It’s one of the biggest fees paid ever. There are rumors such actions is a fraud and may lead to an emergency upgrade of the blockchain.
🇬🇧 Liz Truss has fired a minister because of the security breach. Many lawmakers in the UK want her to resign immediately, after only six weeks in the post. GBPUSD is about to have another red week.
🇯🇵The USDJPY surged to the highest level since 1990, touching the critical resistance of 150. We expect sellers to step into the game on the current levels.
Here you can find our analysis of the pair with entry points and take profits: https://bit.ly/3CQYqJc
💭 Write your thoughts on the market in the comments and have a beautiful trading day!

👍26🔥5❤🔥4❤3😍3🐳2🤩1
🇨🇦🇯🇵#CADJPY
🔥CADJPY reached the resistance range. What is next?
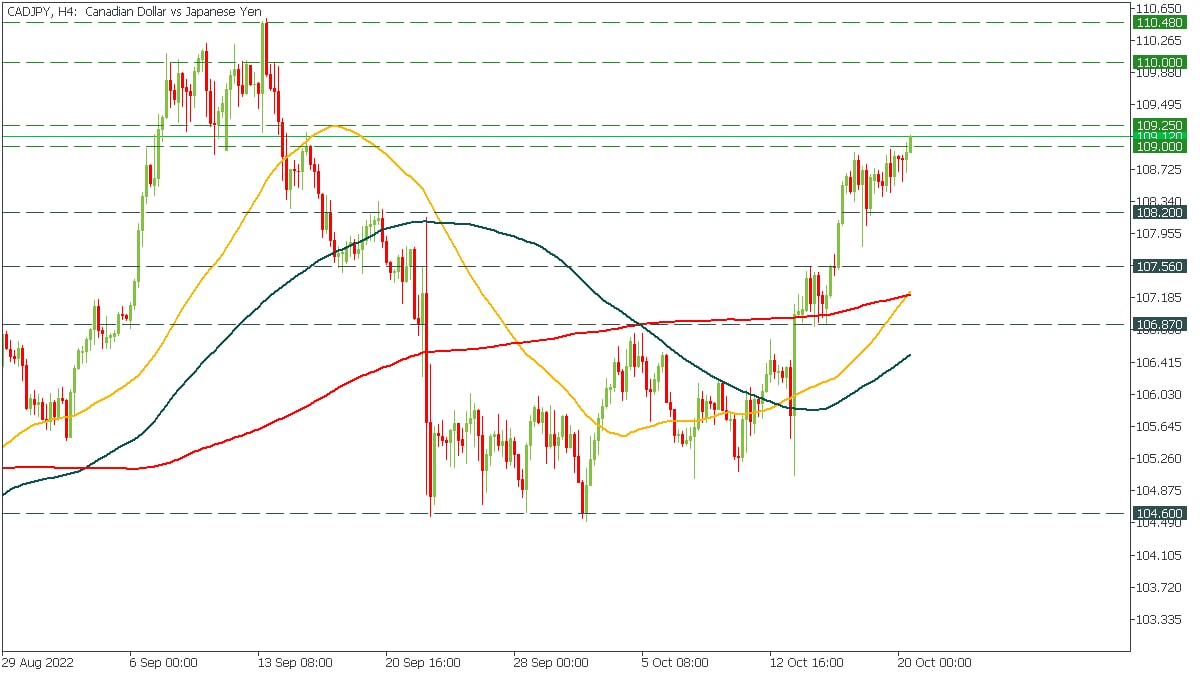
The pair is trading inside the 109.00 - 109.25 resistance range. We need to be patient and check how the price reacts to these levels.
👆If the price breaks above 109.25, we might BUY CADJPY with targets at 110.00 and 110.48.
👇On the other hand, if sellers defend this level and the price breaks below 109.00, we will sell with the target at 108.20.
What do you think about CADJPY?
✅START TRADING ✅
🔥CADJPY reached the resistance range. What is next?
The pair is trading inside the 109.00 - 109.25 resistance range. We need to be patient and check how the price reacts to these levels.
👆If the price breaks above 109.25, we might BUY CADJPY with targets at 110.00 and 110.48.
👇On the other hand, if sellers defend this level and the price breaks below 109.00, we will sell with the target at 108.20.
What do you think about CADJPY?
✅START TRADING ✅
🐳12👍8🔥3❤🔥2🌚1
🔥Philly Fed Manufacturing Index and Unemployment Claims will bring some volatility to the markets!
Today, our analyst Adetola Freeman would like to discuss the current situation on the Forex market with you!
Join the stream at 15:20 GMT+3!
❗️The link will appear here 1 minute before the stream start.
Today, our analyst Adetola Freeman would like to discuss the current situation on the Forex market with you!
Join the stream at 15:20 GMT+3!
❗️The link will appear here 1 minute before the stream start.

👍15🔥12🌚4❤🔥2❤1👏1
🔥Join the stream and ask your questions! 🔥
https://t.me/fbsanalytics?livestream
https://t.me/fbsanalytics?livestream
Telegram
FBS Analytics
Market news & trade ideas & Live streams and more by FBS team!🚀
🤝FBS Support: @fbs_official_bot
🌐FBS website: https://fbs.com
📲FBS Mobile app: https://fbspa.onelink.me/00Zt/8w2366it
❗️Channel rules: https://telegra.ph/FBS-analytics-chat-rules-11-22
🤝FBS Support: @fbs_official_bot
🌐FBS website: https://fbs.com
📲FBS Mobile app: https://fbspa.onelink.me/00Zt/8w2366it
❗️Channel rules: https://telegra.ph/FBS-analytics-chat-rules-11-22
👍22🔥7💩5❤4👎3⚡1
☺️In your opinion, which instrument is the most helpful for newbie traders?
Anonymous Poll
32%
✅RSI
7%
✅MACD
6%
✅ Bollinger Bands
5%
✅ Stochastic
17%
✅ Fibonacci Retracement
29%
✅ Moving Averages
4%
✅ Other (share your opinion)
❤🔥40👍16🔥13❤9⚡5🍌5🌭4👎3💩2
🥇#XAUUSD
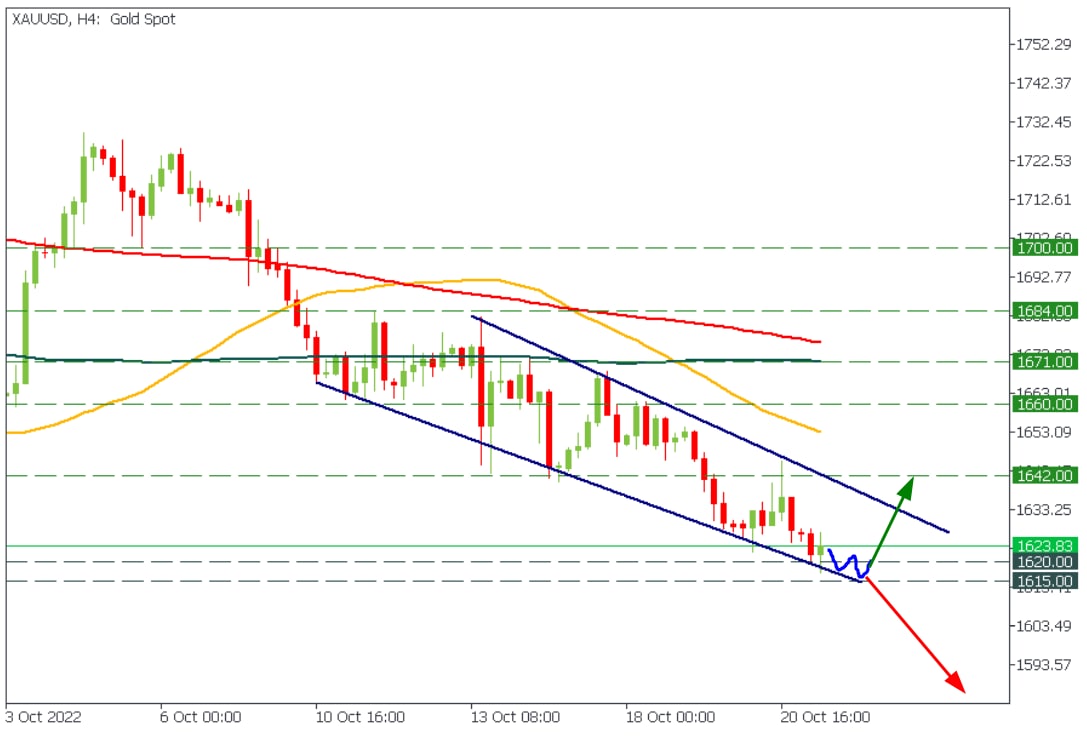
🔥 Gold reached 1615 - 1620. Time to look for BUY opportunities?
🎉As we discussed, Gold bounced off the 1642 - 1646 range and declined to the major support range of 1615 - 1620. Congratulations to everybody who was selling Gold!
👆Now, the price has formed a falling bullish wedge. You must observe the price movement inside the support range of 1615.00 - 1620.00. If the price shows signs of reversal, buy XAUUSD with the target at 1642.00.
👇However, if the price loses 1615 support, we expect a massive dump toward 1545.00.
What do you expect from the yellow metal in the near term?
✅START TRADING ✅
🔥 Gold reached 1615 - 1620. Time to look for BUY opportunities?
🎉As we discussed, Gold bounced off the 1642 - 1646 range and declined to the major support range of 1615 - 1620. Congratulations to everybody who was selling Gold!
👆Now, the price has formed a falling bullish wedge. You must observe the price movement inside the support range of 1615.00 - 1620.00. If the price shows signs of reversal, buy XAUUSD with the target at 1642.00.
👇However, if the price loses 1615 support, we expect a massive dump toward 1545.00.
What do you expect from the yellow metal in the near term?
✅START TRADING ✅
👍36❤10🔥8❤🔥5🍓4
#MarketNews
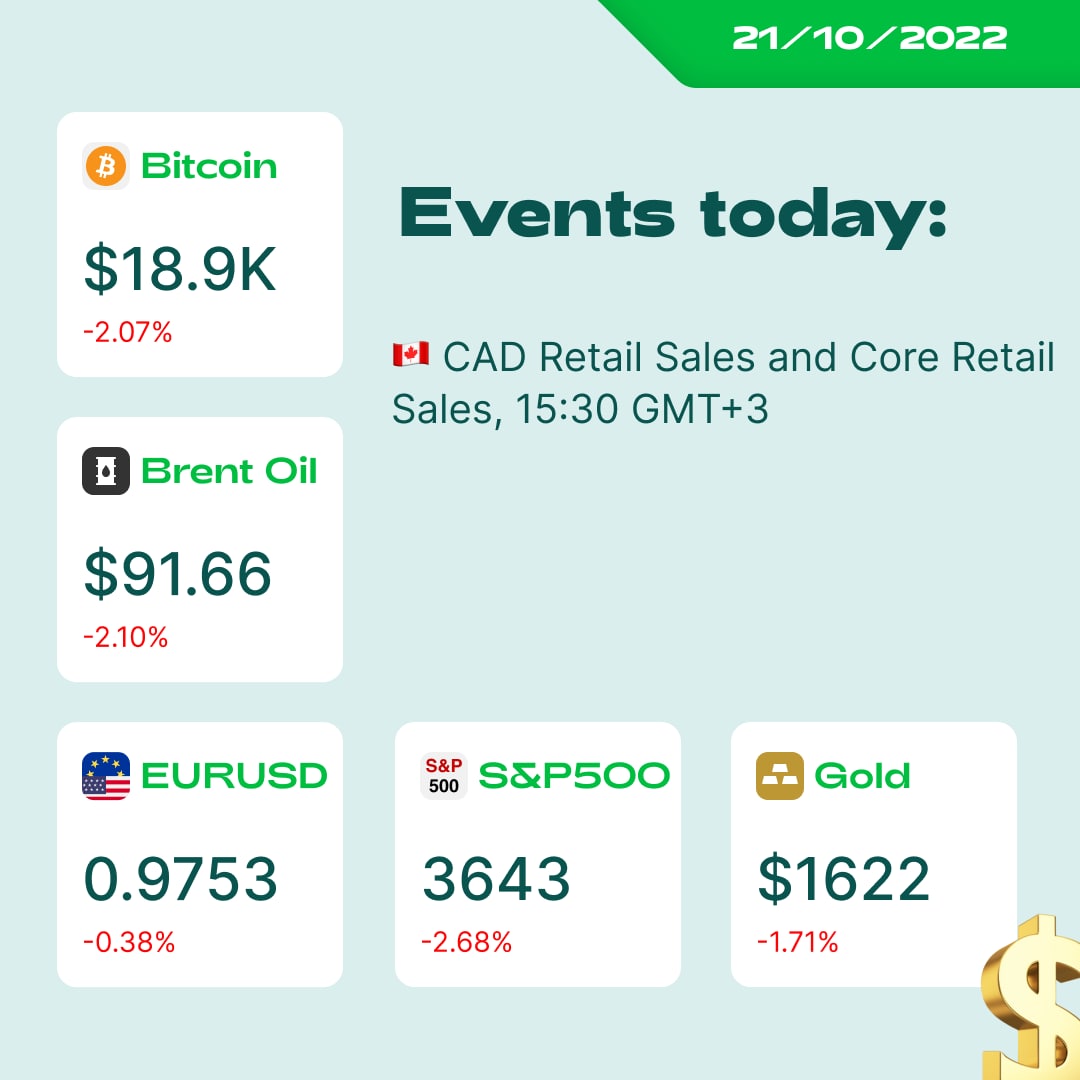
Happy Friday, dear traders! Are you ready for a productive trading day before the weekend? Let’s see what news excite the market💫
🇬🇧British Prime Minister Liz Truss has resigned after 44 days in office. A new prime minister will be chosen on Monday.
📈AT&T released a stable earnings report after a disastrous one last quarter and a recovery in demand for more expensive tariff plans. A company’s stock price gained 7.7%.
🇯🇵The advance of USDJPY above the symbolic $150 mark leaves traders wondering when the Japanese authorities will intervene to stop the yen from further depreciation. Next week the BoJ will update its interest rate and announce some plans for the future of monetary policy. At the moment, USDJPY is 150.430.
🇨🇳Stocks of some Chinese chip-related companies tumbled as the US considered imposing new export controls limiting China's access to powerful computing technology.
🛢Oil rose after a tough week. The fears of a global economic downturn continue to weigh on the market. XBRUSD is 90.60.
Read the full article and GBPUSD analysis here: https://bit.ly/3EWZLks
💫Have a fantastic day! What are you expecting from today? Share in the comments!⬇️
Happy Friday, dear traders! Are you ready for a productive trading day before the weekend? Let’s see what news excite the market💫
🇬🇧British Prime Minister Liz Truss has resigned after 44 days in office. A new prime minister will be chosen on Monday.
📈AT&T released a stable earnings report after a disastrous one last quarter and a recovery in demand for more expensive tariff plans. A company’s stock price gained 7.7%.
🇯🇵The advance of USDJPY above the symbolic $150 mark leaves traders wondering when the Japanese authorities will intervene to stop the yen from further depreciation. Next week the BoJ will update its interest rate and announce some plans for the future of monetary policy. At the moment, USDJPY is 150.430.
🇨🇳Stocks of some Chinese chip-related companies tumbled as the US considered imposing new export controls limiting China's access to powerful computing technology.
🛢Oil rose after a tough week. The fears of a global economic downturn continue to weigh on the market. XBRUSD is 90.60.
Read the full article and GBPUSD analysis here: https://bit.ly/3EWZLks
💫Have a fantastic day! What are you expecting from today? Share in the comments!⬇️
👍17🔥5❤3
🇺🇸#USDollarIndex #DXY
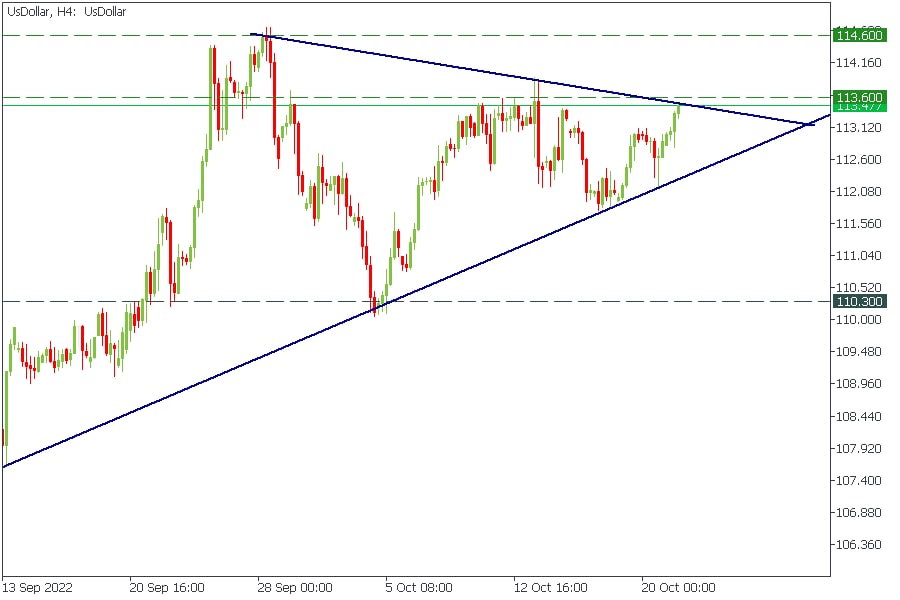
🔥US dollar index has formed a symmetrical triangle!
The price is testing the resistance line right now. If the index breaks above 113.60, it will go to 114.60. This will press EURUSD, GBPUSD, XAUUSD.
Do you use DXY while analyzing the markets?
✅START TRADING ✅
🔥US dollar index has formed a symmetrical triangle!
The price is testing the resistance line right now. If the index breaks above 113.60, it will go to 114.60. This will press EURUSD, GBPUSD, XAUUSD.
Do you use DXY while analyzing the markets?
✅START TRADING ✅
🔥26👍13❤7😍3⚡2😁2🤩2🐳2
FBS Analytics
🇬🇧🇺🇸#GBPUSD 🔥GBPUSD middle-term analysis! Buyers squeeze the price to 1.1470 resistance level! If they push the pair above this level, it will easily reach 1.1745. However, if buyers lose the support (blue) trend line, the pair might make another swing…
#GBPUSD
🔥GBPUSD is declining!
👍The pair is moving perfectly. It broke through the rising trendline, retested it from below, and dropped.
Now, we have to watch the 1.0922 support level. Some pullback might appear there, and technically the price might even bounce to 1.1200.
However, the best way to trade GBPUSD is to sell the pair on the breakout of 1.0922 support with the target at 1.0633!
☁️What are your thoughts about GBPUSD?
🔥GBPUSD is declining!
👍The pair is moving perfectly. It broke through the rising trendline, retested it from below, and dropped.
Now, we have to watch the 1.0922 support level. Some pullback might appear there, and technically the price might even bounce to 1.1200.
However, the best way to trade GBPUSD is to sell the pair on the breakout of 1.0922 support with the target at 1.0633!
☁️What are your thoughts about GBPUSD?
🤮367👎313💩220😱153😢136👍28❤🔥10❤4⚡3🎉3🍌1
🥇#XAUUSD
🔥XAUUSD has formed a double bottom with the bullish divergence!
We raise our target to 1668!
Are you buying the yellow metal right now?
✅START TRADING ✅
🔥XAUUSD has formed a double bottom with the bullish divergence!
We raise our target to 1668!
Are you buying the yellow metal right now?
✅START TRADING ✅

❤38👍15🔥14👏6🐳5💩4⚡3🤮3🏆3😍2
🤑 Everyone loves free stuff! Especially when you get something free that can make you money in the future
💸 Ten years ago, you could earn a Bitcoin for free; now, it is worth a lot of money. But you can get other cryptos completely free and try your luck. Maybe, you will find the next crypto that makes 100 000%
✅ Here's how you can earn crypto for free:
https://bit.ly/3CW8sZP
💸 Ten years ago, you could earn a Bitcoin for free; now, it is worth a lot of money. But you can get other cryptos completely free and try your luck. Maybe, you will find the next crypto that makes 100 000%
✅ Here's how you can earn crypto for free:
https://bit.ly/3CW8sZP

🔥45👍25💩14❤🔥6🏆6🎉5🍌5🍓2⚡1👏1
FBS Analytics
🥇#XAUUSD 🔥XAUUSD has formed a double bottom with the bullish divergence! We raise our target to 1668! Are you buying the yellow metal right now? ✅START TRADING ✅
🥇#XAUUSD
🔥⚡️The price has reached our target and dropped. What is next?
Now we suggest you watch the 1641.00 - 1646.00 support range carefully. If the price breaks through, you might sell with the target at 1620.00.
However, if the price shows any signs of reversal, buy XAUUSD with the targets at the 200-hour moving average (~1650.00) and 1668.00.
🤩Are you bullish or bearish on XAUUSD?
✅START TRADING ✅
🔥⚡️The price has reached our target and dropped. What is next?
Now we suggest you watch the 1641.00 - 1646.00 support range carefully. If the price breaks through, you might sell with the target at 1620.00.
However, if the price shows any signs of reversal, buy XAUUSD with the targets at the 200-hour moving average (~1650.00) and 1668.00.
🤩Are you bullish or bearish on XAUUSD?
✅START TRADING ✅
👍57🔥19⚡4🌭4👏1🍓1
🇪🇺🇦🇺#EURAUD
🔥⚡️EURAUD might get pumped soon!
Consider buying the pair on the breakout of the recent high (1.5680).
🎯Target: 1.5850
✅START TRADING ✅
🔥⚡️EURAUD might get pumped soon!
Consider buying the pair on the breakout of the recent high (1.5680).
🎯Target: 1.5850
✅START TRADING ✅

🔥15👍6❤🔥3👏2🤣2⚡1🐳1