
#WeeklyReview
👀All eyes will be on the US jobs report this week and on Fed Chair Jerome Powell and New York Fed President John Williams, who are among the central bank officials scheduled to speak.
🇺🇸USD. The US dollar index started the week with a massive decline. The price is heading toward the 104.50 - 105.00 support range. If the index loses these levels, it might drop to 103.40. In this case, pairs like EURUSD, GBPUSD, and gold will renew local highs.
🇪🇺🇺🇸EURUSD. The pair broke above the 200-day moving average at the end of the previous week. The pair started this week with a massive impulse toward the 1.0650 resistance level. The range of 1.0600 - 1.0750 is a solid resistance on the higher timeframes. Therefore, the volatility is expected to gain momentum this week.
🛢Oil. Brent slumped to the lowest level since December as the protests in China clouded the outlook for energy demand, adding stresses to an already-fragile global crude market. XBRUSD dropped below the 82.40 support level. If the price drops below 80.30, it might keep declining toward 76.80 and 72.40. In the reverse situation, a recovery to 90.00 is possible.
🥇XAUUSD. Gold has kept moving up since November 23rd. The US dollar weakening supports the yellow metal. It is most likely for the price to reach the 1800.00 level, a cross point of the 50- and 100-week moving averages.
🇺🇸US indices. US500 is moving in the ascending channel. If the US dollar weakens this week, the index might break above the 200-day moving average and move toward the 4095 - 4125 resistance level. However, if the price breaks through the channel's lower border, we expect a massive decline toward 3500 to begin.
What are you going to trade this week? Share in the comments!
Take advantage of the movements of these assets with FBS - https://bit.ly/3Xj6Tyj
👀All eyes will be on the US jobs report this week and on Fed Chair Jerome Powell and New York Fed President John Williams, who are among the central bank officials scheduled to speak.
🇺🇸USD. The US dollar index started the week with a massive decline. The price is heading toward the 104.50 - 105.00 support range. If the index loses these levels, it might drop to 103.40. In this case, pairs like EURUSD, GBPUSD, and gold will renew local highs.
🇪🇺🇺🇸EURUSD. The pair broke above the 200-day moving average at the end of the previous week. The pair started this week with a massive impulse toward the 1.0650 resistance level. The range of 1.0600 - 1.0750 is a solid resistance on the higher timeframes. Therefore, the volatility is expected to gain momentum this week.
🛢Oil. Brent slumped to the lowest level since December as the protests in China clouded the outlook for energy demand, adding stresses to an already-fragile global crude market. XBRUSD dropped below the 82.40 support level. If the price drops below 80.30, it might keep declining toward 76.80 and 72.40. In the reverse situation, a recovery to 90.00 is possible.
🥇XAUUSD. Gold has kept moving up since November 23rd. The US dollar weakening supports the yellow metal. It is most likely for the price to reach the 1800.00 level, a cross point of the 50- and 100-week moving averages.
🇺🇸US indices. US500 is moving in the ascending channel. If the US dollar weakens this week, the index might break above the 200-day moving average and move toward the 4095 - 4125 resistance level. However, if the price breaks through the channel's lower border, we expect a massive decline toward 3500 to begin.
What are you going to trade this week? Share in the comments!
Take advantage of the movements of these assets with FBS - https://bit.ly/3Xj6Tyj
👍32🔥4👌2👎1👏1
🇺🇸🇨🇦#USDCAD
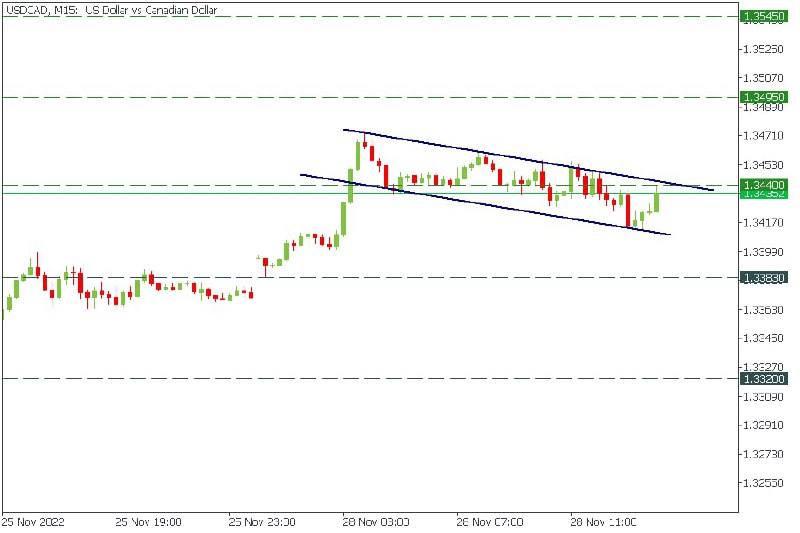
🔥USDCAD has formed a bullish flag!
Consider buying the pair when the price breaks through the upper flag's border.
TP: 1.3495, 1.3545
✅START TRADING ✅
🔥USDCAD has formed a bullish flag!
Consider buying the pair when the price breaks through the upper flag's border.
TP: 1.3495, 1.3545
✅START TRADING ✅
❤22🔥8👍7🤔2🍌2🏆2💔1
🇦🇺🇺🇸#AUDUSD
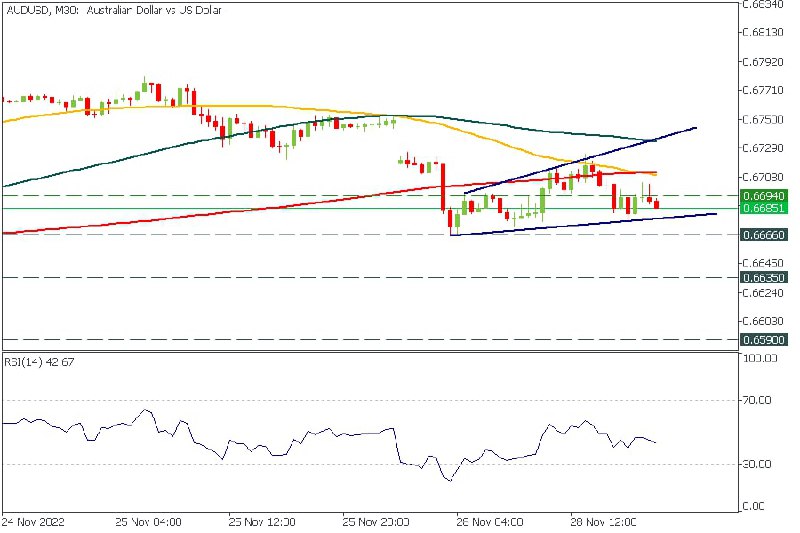
🔥AUDUSD has formed an inverted wedge!
Trade: SELL
Entry: after a breakout of 0.6666
Targets: 0.6635, 0.6590
✅START TRADING ✅
🔥AUDUSD has formed an inverted wedge!
Trade: SELL
Entry: after a breakout of 0.6666
Targets: 0.6635, 0.6590
✅START TRADING ✅
👍34🔥15❤6🕊2💩1
🇬🇧🇺🇸#GBPUSD
☀️Morning traders!
GBPUSD looks bearish!
Pattern: inverted wedge
❌Trade: SELL
Entry: 1.2050 or after a breakout of the pattern's lower border
🎯TP: 1.1941
✅START TRADING ✅
☀️Morning traders!
GBPUSD looks bearish!
Pattern: inverted wedge
❌Trade: SELL
Entry: 1.2050 or after a breakout of the pattern's lower border
🎯TP: 1.1941
✅START TRADING ✅

👍26🔥13⚡2💩1🐳1🌭1🍓1
#MarketNews
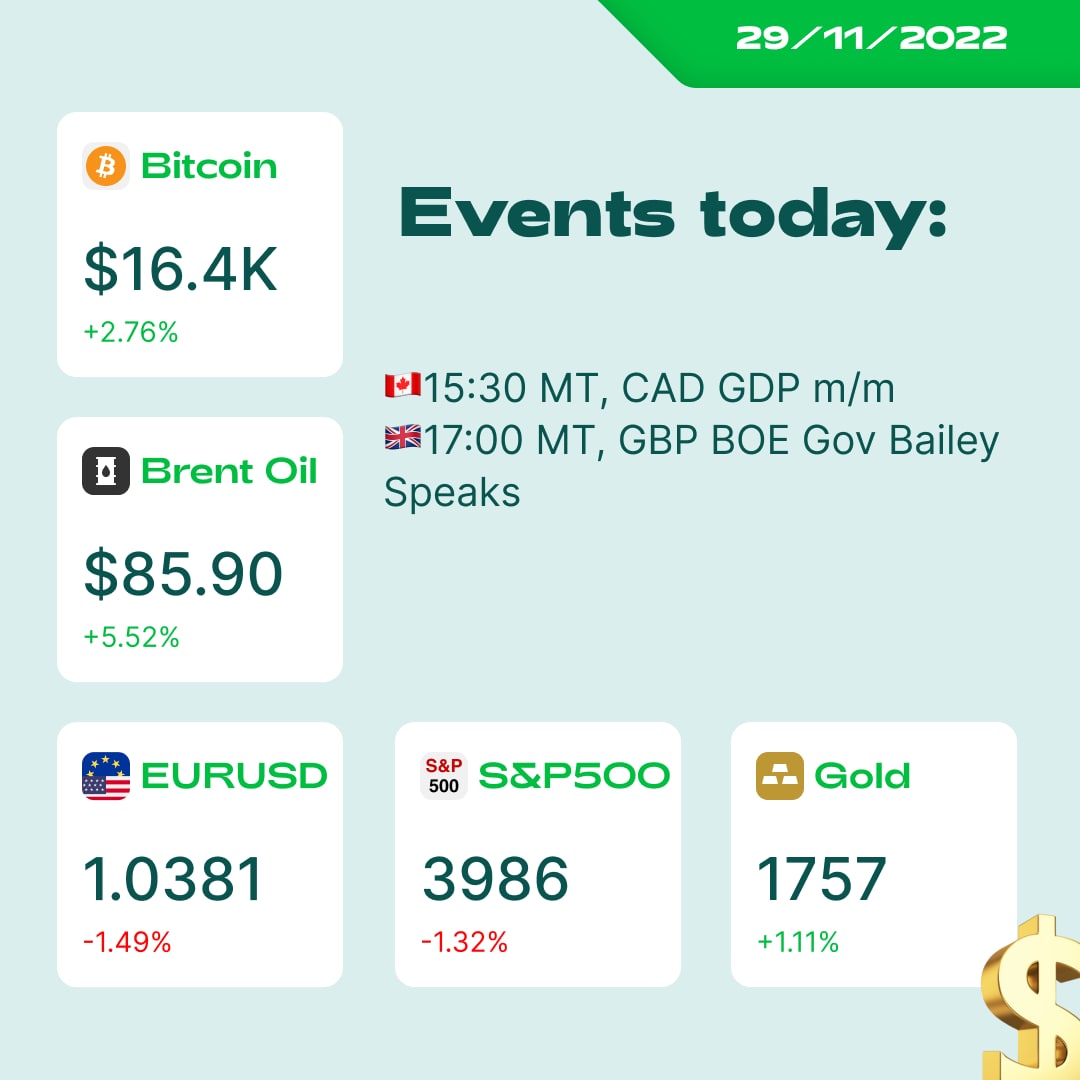
Good morning, dear traders! Hope you’re doing great! Let’s talk about the news that is worth following today!✨
📌Key market events:
15:30 MT, CAD GDP m/m
17:00 MT, GBP BOE Gov Bailey Speaks
☢️Mark Mobius stated that BTC could fall to $10,000, but that wouldn’t be the end of the crypto.
🇨🇳Today, the Chinese authorities will hold a briefing on the situation with Covid in the country and anti-covid restrictions.
🌫The gas price in Europe could break through the proposed ceiling of $3,000/ths. cube and reach higher levels.
🛢Oil continued to rebound from its lowest level in almost a year amid speculation that OPEC and its allies will deepen supply cuts to respond to weakening global demand.
🇺🇸Traders are looking forward to Fed Chairman Jerome Powell's speech on Wednesday. Many economists expect him to shore up bets that the Fed will slow its pace of rate hikes next month, while at the same time reminding Americans that the fight against inflation will last until 2023.
📈Microsoft will offer European regulators new ways to deal with the Activision Blizzard takeover deal in the coming weeks to avoid formal regulator objections to the merger.
Read the full report and oil analysis for the day: http://bit.ly/3XJ5y3W
Have a great day!
Good morning, dear traders! Hope you’re doing great! Let’s talk about the news that is worth following today!✨
📌Key market events:
15:30 MT, CAD GDP m/m
17:00 MT, GBP BOE Gov Bailey Speaks
☢️Mark Mobius stated that BTC could fall to $10,000, but that wouldn’t be the end of the crypto.
🇨🇳Today, the Chinese authorities will hold a briefing on the situation with Covid in the country and anti-covid restrictions.
🌫The gas price in Europe could break through the proposed ceiling of $3,000/ths. cube and reach higher levels.
🛢Oil continued to rebound from its lowest level in almost a year amid speculation that OPEC and its allies will deepen supply cuts to respond to weakening global demand.
🇺🇸Traders are looking forward to Fed Chairman Jerome Powell's speech on Wednesday. Many economists expect him to shore up bets that the Fed will slow its pace of rate hikes next month, while at the same time reminding Americans that the fight against inflation will last until 2023.
📈Microsoft will offer European regulators new ways to deal with the Activision Blizzard takeover deal in the coming weeks to avoid formal regulator objections to the merger.
Read the full report and oil analysis for the day: http://bit.ly/3XJ5y3W
Have a great day!
❤19👍9⚡4🔥2🍌2🌚1
🤔Have you ever heard about Central Bank Digital Currency?
We are sure CBDCs can change the world soon! That's why we've prepared an article, which will tell you about this instrument and its possible effect on gold 🥇 and silver 🥈.
Read the article: bit.ly/3EPMnN8
We are sure CBDCs can change the world soon! That's why we've prepared an article, which will tell you about this instrument and its possible effect on gold 🥇 and silver 🥈.
Read the article: bit.ly/3EPMnN8
FBS
CBDC: Technology of the Future or Dystopia?
CBDCs are centralized and regulated by central banks, thus offering less freedom and anonymity.
👍30🔥5👏4😍2⚡1❤1❤🔥1🥰1🐳1🏆1🍓1
🇺🇸🇯🇵#USDJPY
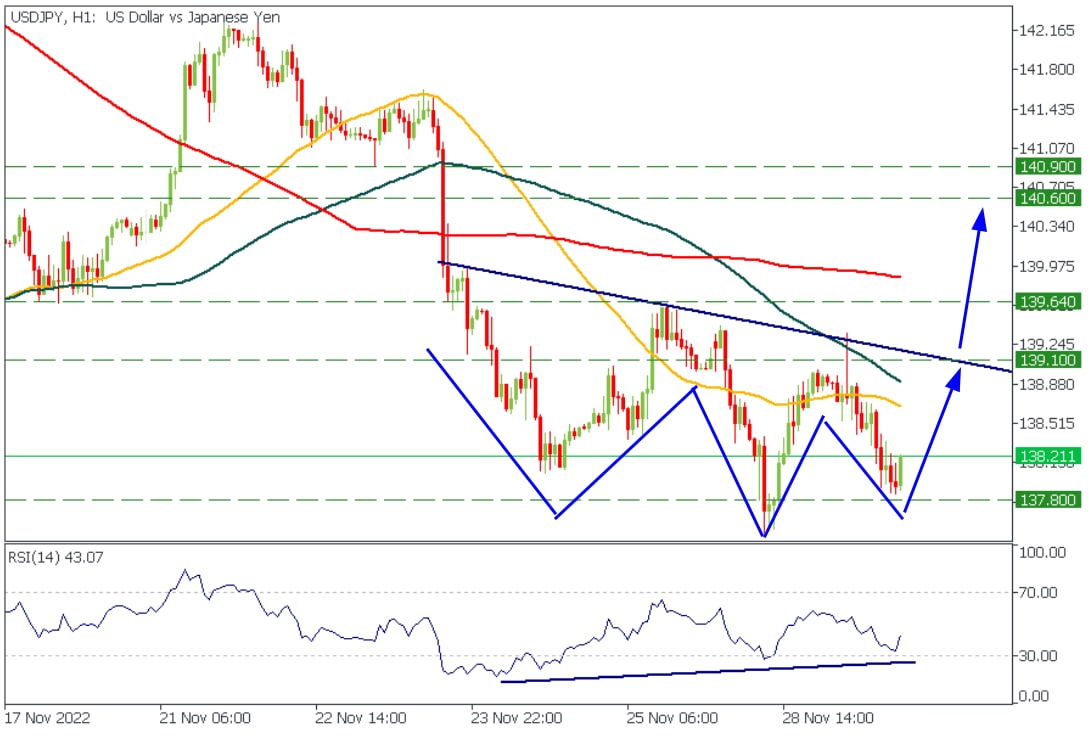
🔥USDJPY analysis!
The pair has all the potential to form an inverted head and shoulders pattern! Moreover, we can see that the pair has a bullish divergence with the H1 RSI, highlighting a possible reversal!
Thus, consider buying USDJPY, with the closest target at 139.10. If the price breaks through the neckline (blue line), it will go to 139.64, 140.60, and 140.90.
Pair: USDJPY
🟢Trade: Buy
Pattern: inverted head and shoulders
🎯Targets: 139.10, 139.64, 140.60, 140.90
❗️Do not forget about risk management!
✅START TRADING ✅
🔥USDJPY analysis!
The pair has all the potential to form an inverted head and shoulders pattern! Moreover, we can see that the pair has a bullish divergence with the H1 RSI, highlighting a possible reversal!
Thus, consider buying USDJPY, with the closest target at 139.10. If the price breaks through the neckline (blue line), it will go to 139.64, 140.60, and 140.90.
Pair: USDJPY
🟢Trade: Buy
Pattern: inverted head and shoulders
🎯Targets: 139.10, 139.64, 140.60, 140.90
❗️Do not forget about risk management!
✅START TRADING ✅
🍓22👍15🔥5⚡4❤3🏆3🐳1
🇺🇸#USdollarIndex
🔥USD middle-term outlook!
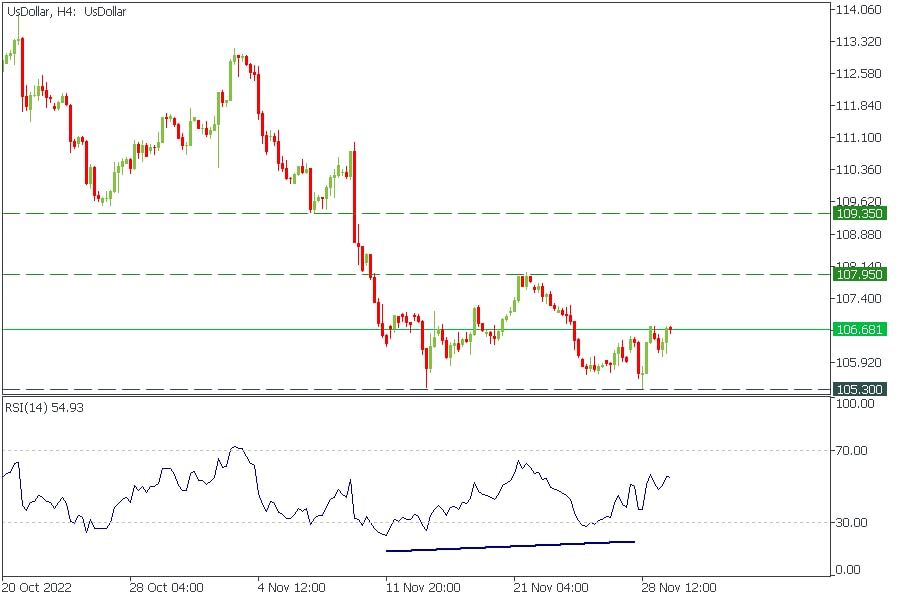
The US Dollar index is forming a double bottom pattern with the divergence on the H4 RSI. Thus, we recommend not selling the USD.
In FBS analysts' opinion, USD might gain around 2500 points against major currencies by the end of this week!
✅START TRADING ✅
🔥USD middle-term outlook!
The US Dollar index is forming a double bottom pattern with the divergence on the H4 RSI. Thus, we recommend not selling the USD.
In FBS analysts' opinion, USD might gain around 2500 points against major currencies by the end of this week!
✅START TRADING ✅
🔥26👍19
☀️Morning traders!
Yesterday, our GBPUSD trade idea went extremely well, providing you with 1000 points profit opportunity!
😳Smash ❤️if you held this trade to the target!
What are you going to trade today? Let's discuss it!
Yesterday, our GBPUSD trade idea went extremely well, providing you with 1000 points profit opportunity!
😳Smash ❤️if you held this trade to the target!
What are you going to trade today? Let's discuss it!
👍46❤31🔥9❤🔥6🌭1
🇬🇧🇯🇵#GBPJPY
GBPJPY might skyrocket soon!
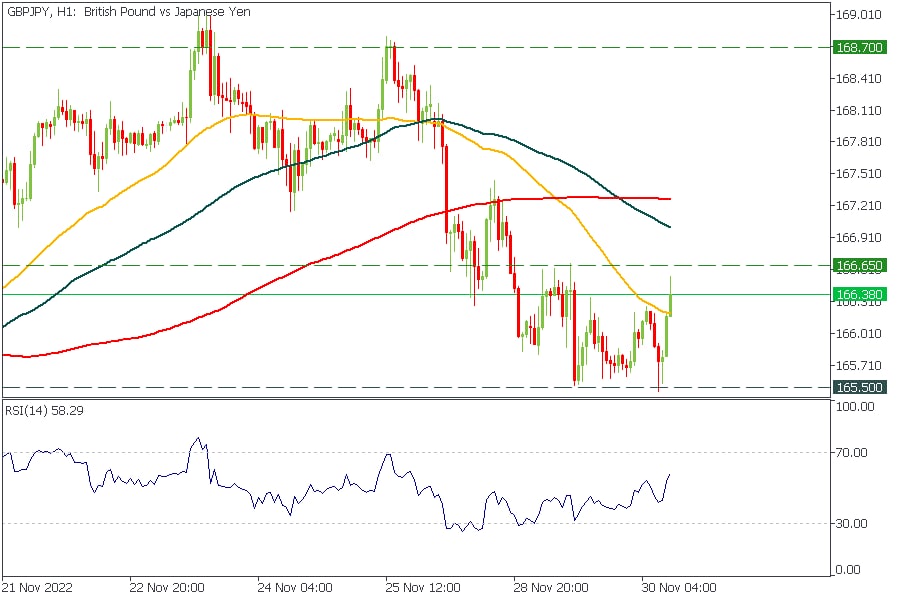
The price is consolidating inside the horizontal range. At the same time, the RSI is sliding to the top, meaning buyers are highly interested in this asset.
🟢Trade: BUY
Entry: Breakout above 166.65
🎯Target: 168.70
Potential profit: 2000 points
❗️Do not forget about risk management!
✅START TRADING ✅
GBPJPY might skyrocket soon!
The price is consolidating inside the horizontal range. At the same time, the RSI is sliding to the top, meaning buyers are highly interested in this asset.
🟢Trade: BUY
Entry: Breakout above 166.65
🎯Target: 168.70
Potential profit: 2000 points
❗️Do not forget about risk management!
✅START TRADING ✅
👍27❤6🐳2🍌2😱1
#MarketNews
🎅🏾 The winter is coming, and risky markets expect a rally to come with it. Will this December be bullish for stocks, crypto, and gold? A pack of news will surely help you out.
🏦 Bank of America: The US economy will enter a recession around the middle of next year, and this will push the Fed to cut rates at the end of 2023.
🇬🇧 The BoE governor Bailey: No discussion with the government about the timing and pace of BOE asset sales.
🇦🇺 Annual CPI in Australia is significantly lower than expected (6.9% actual vs. 7.6% forecast). However, the AUD neither soared nor plunged.
📈 The stock market’s Fear & Greed index is in the greed zone (61/100) as the US500 index declines for the third day in a row.
🚀 Bitcoin broke through the descending triangle and reached $17K today. The cryptocurrency market is rising ahead of Fed Chair Powell’s speech.
🇿🇦 South Africa’s unemployment rate declined for a third consecutive quarter. It’s now 32.9% vs. 33.9% the quarter before.
🇨🇳 Bloomberg forecasts that China will gradually relax Covid containment measures over the next seven months, resulting in a full reopening by mid-2023
🥇 Gold (XAUUSD) short-term analysis is ready and waiting for you:
➡️ http://bit.ly/3Vc0un7
🍀Take advantage of the market and good luck!
🎅🏾 The winter is coming, and risky markets expect a rally to come with it. Will this December be bullish for stocks, crypto, and gold? A pack of news will surely help you out.
🏦 Bank of America: The US economy will enter a recession around the middle of next year, and this will push the Fed to cut rates at the end of 2023.
🇬🇧 The BoE governor Bailey: No discussion with the government about the timing and pace of BOE asset sales.
🇦🇺 Annual CPI in Australia is significantly lower than expected (6.9% actual vs. 7.6% forecast). However, the AUD neither soared nor plunged.
📈 The stock market’s Fear & Greed index is in the greed zone (61/100) as the US500 index declines for the third day in a row.
🚀 Bitcoin broke through the descending triangle and reached $17K today. The cryptocurrency market is rising ahead of Fed Chair Powell’s speech.
🇿🇦 South Africa’s unemployment rate declined for a third consecutive quarter. It’s now 32.9% vs. 33.9% the quarter before.
🇨🇳 Bloomberg forecasts that China will gradually relax Covid containment measures over the next seven months, resulting in a full reopening by mid-2023
🥇 Gold (XAUUSD) short-term analysis is ready and waiting for you:
➡️ http://bit.ly/3Vc0un7
🍀Take advantage of the market and good luck!
👍30❤🔥7🐳5🏆4👌3🔥2🎉2🌭2🍓2⚡1😍1
FBS Analytics
🇺🇸🇯🇵#USDJPY 🔥USDJPY analysis! The pair has all the potential to form an inverted head and shoulders pattern! Moreover, we can see that the pair has a bullish divergence with the H1 RSI, highlighting a possible reversal! Thus, consider buying USDJPY, with…
🇺🇸🇯🇵#USDJPY
🔥USDJPY is chasing stars!
✅The price reached our first target.
Moreover, the price broke through the neckline of an inverted head and shoulders Pattern. Currently, the pair is heading toward our second target of 139.65, which is the 200-hour moving average.
If the price breaks through this MA, the way to the 140.60 - 140.90 range will be open.
📈 Pattern: inverted head and shoulders
🟢Trade: BUY
🎯Target: 140.60 - 140.90
✅START TRADING ✅
🔥USDJPY is chasing stars!
✅The price reached our first target.
Moreover, the price broke through the neckline of an inverted head and shoulders Pattern. Currently, the pair is heading toward our second target of 139.65, which is the 200-hour moving average.
If the price breaks through this MA, the way to the 140.60 - 140.90 range will be open.
📈 Pattern: inverted head and shoulders
🟢Trade: BUY
🎯Target: 140.60 - 140.90
✅START TRADING ✅
👍27❤18🔥6💩4❤🔥2😍2
#CADCHF
📍 Short-term analysis
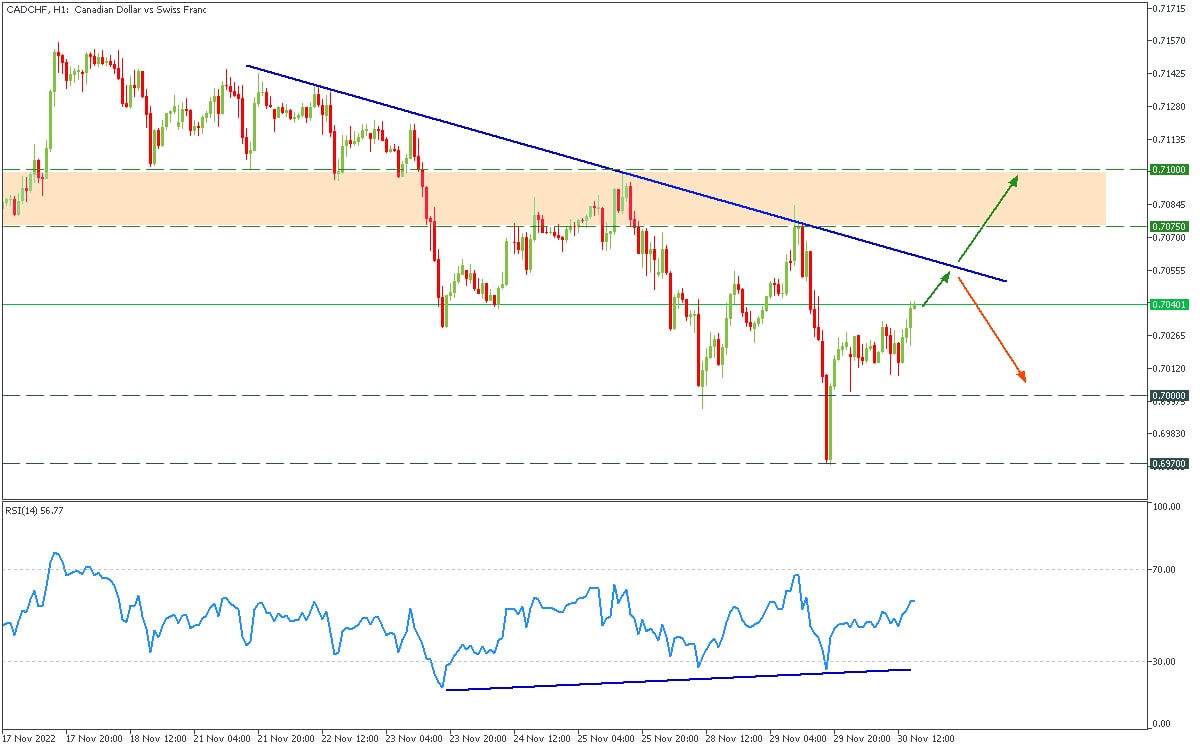
📈 The pair is about to move closer to the resistance trendline. It will be the fifth touch of the line, so we expect a breakout to happen. In this case, the price will move to the supply zone (yellow), and you can open a By trade with targets at 0.7075 and 0.7100.
⚠️ On the contrary, if the breakout doesn't happen, CADCHF will move lower to 0.7000, a round number.
💭 What do you think, Buy or Sell?
✅START TRADING ✅
📍 Short-term analysis
📈 The pair is about to move closer to the resistance trendline. It will be the fifth touch of the line, so we expect a breakout to happen. In this case, the price will move to the supply zone (yellow), and you can open a By trade with targets at 0.7075 and 0.7100.
⚠️ On the contrary, if the breakout doesn't happen, CADCHF will move lower to 0.7000, a round number.
💭 What do you think, Buy or Sell?
✅START TRADING ✅
👍22🔥7❤🔥3😍3🐳2
is RSI the best indicator?🤩
💫RSI is one of the most popular technical indicators among traders. It’s easy to use, understandable and functional! Let’s discuss it in detail.
🔸Relative Strength Index or RSI indicator is a momentum oscillator that measures the strength and momentum of price movements. It oscillates between 0 and 100 and by default, it’s considered overbought when it’s above 70 and oversold when it is below 30. 50 is the golden mean there, so if it’s higher than this level, the trend is bullish; otherwise, it’s bearish.
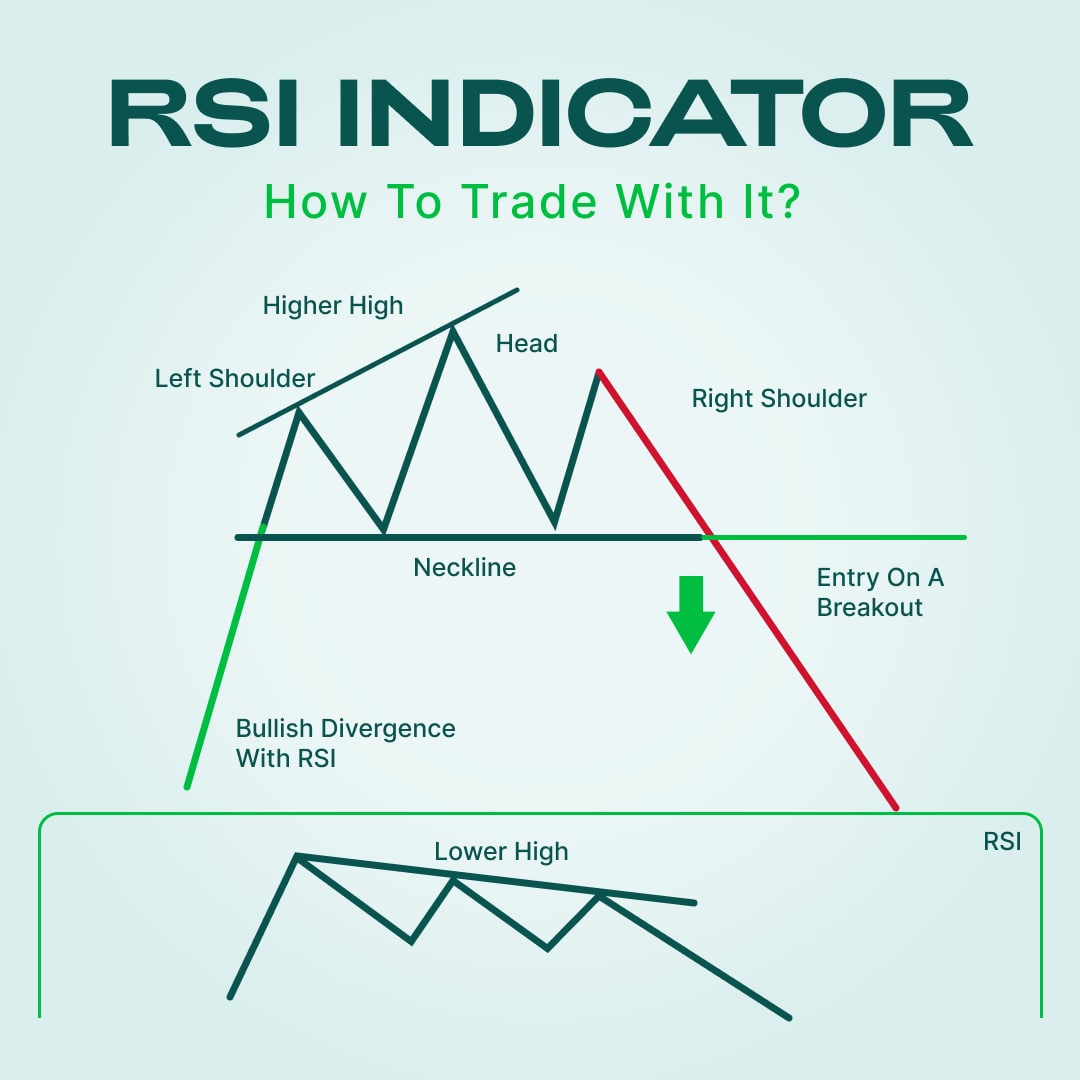
🔸So, how to trade using the RSI indicator? Let’s look at the bullish example. We notice that the price rises and there are several higher highs. However, RSI shows a decrease with more than two lower highs. This divergence proves that the chance of trend reversing is really high. It looks like a head and shoulders pattern. We recommend entering the trade at the moment of a neckline breakdown.
🔸RSI works best when there’s no clear trend because, in another case, it will be useless. However, if the trend is unstable, RSI can give some great signals!
Is everything clear? Try it out with FBS: https://bit.ly/2NH9X88
💫RSI is one of the most popular technical indicators among traders. It’s easy to use, understandable and functional! Let’s discuss it in detail.
🔸Relative Strength Index or RSI indicator is a momentum oscillator that measures the strength and momentum of price movements. It oscillates between 0 and 100 and by default, it’s considered overbought when it’s above 70 and oversold when it is below 30. 50 is the golden mean there, so if it’s higher than this level, the trend is bullish; otherwise, it’s bearish.
🔸So, how to trade using the RSI indicator? Let’s look at the bullish example. We notice that the price rises and there are several higher highs. However, RSI shows a decrease with more than two lower highs. This divergence proves that the chance of trend reversing is really high. It looks like a head and shoulders pattern. We recommend entering the trade at the moment of a neckline breakdown.
🔸RSI works best when there’s no clear trend because, in another case, it will be useless. However, if the trend is unstable, RSI can give some great signals!
Is everything clear? Try it out with FBS: https://bit.ly/2NH9X88
👍50❤18❤🔥6🔥4🐳4⚡2🍌1
🥇#XAUUSD
🔥XAUUSD looks bearish!
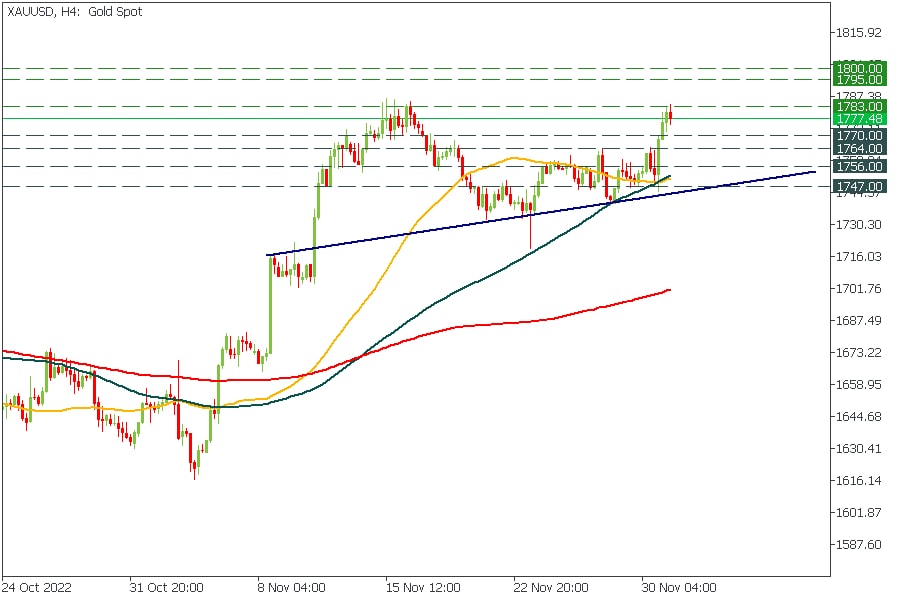
The price is consolidating below the 1783.00 resistance level, a recent high from November 16.
Until XAUUSD stays below this resistance, consider selling it with targets 1770, 1764, and 1764.
🔴Trade: SELL
🎯Targets: 1770, 1764, 1764
✅START TRADING ✅
Are you bullish or bearish on XAUUSD?
🔥XAUUSD looks bearish!
The price is consolidating below the 1783.00 resistance level, a recent high from November 16.
Until XAUUSD stays below this resistance, consider selling it with targets 1770, 1764, and 1764.
🔴Trade: SELL
🎯Targets: 1770, 1764, 1764
✅START TRADING ✅
Are you bullish or bearish on XAUUSD?
🔥26👍16👎7⚡2🎉2
🇺🇸#USdollarIndex
🔥The US dollar middle-term analysis!
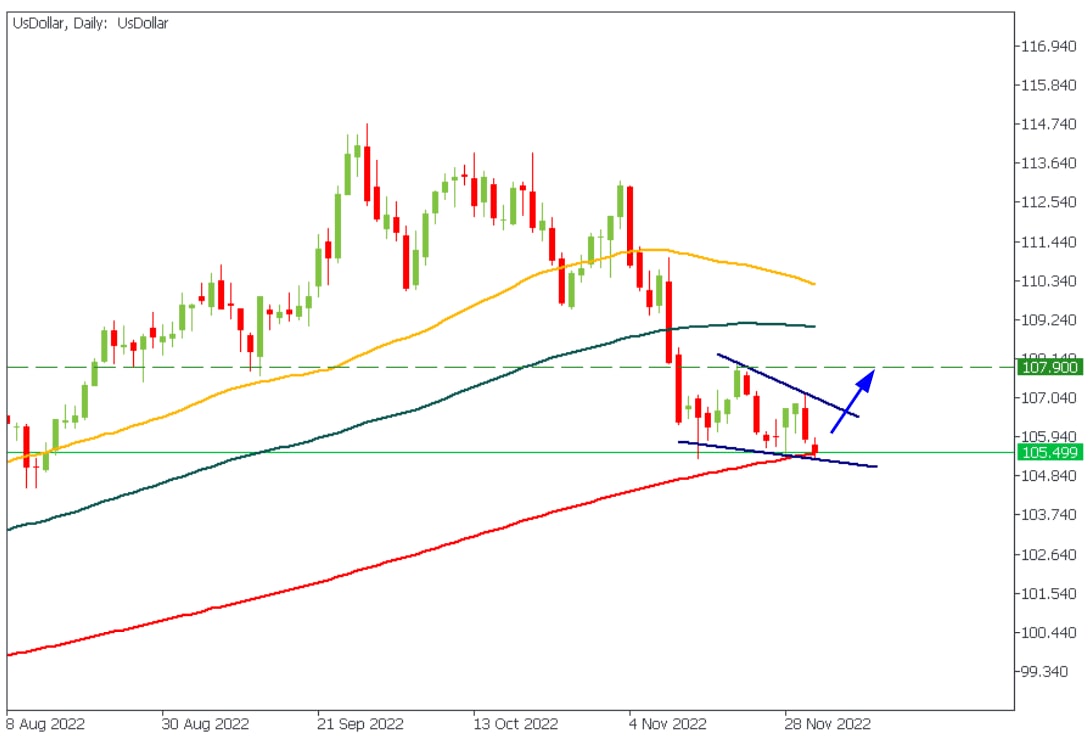
The US dollar index is consolidating above the 200-day moving average inside the bullish fallen wedge!
We highly doubt the US dollar index might break the 200-day MA on the first try. Thus, we expect a pullback to 107.90 (over 2300 points move).
❗️In this case, EURUSD, GBPUSD, and XAUUSD might stay under a heavy pressure ❗️
✅START TRADING ✅
Do you think the USD might reverse soon?
🔥The US dollar middle-term analysis!
The US dollar index is consolidating above the 200-day moving average inside the bullish fallen wedge!
We highly doubt the US dollar index might break the 200-day MA on the first try. Thus, we expect a pullback to 107.90 (over 2300 points move).
❗️In this case, EURUSD, GBPUSD, and XAUUSD might stay under a heavy pressure ❗️
✅START TRADING ✅
Do you think the USD might reverse soon?
👍18❤9❤🔥5👎4⚡1🔥1🍌1
#MarketNews
⚡️Good Thursday!
🇨🇳The comments from China's top official in charge of the fight against the coronavirus, Vice Premier Sun Chunlan, on the weakening omicron variant and more Chinese getting vaccinated boosted the risk sentiment yesterday. HK50 jumped 3.3% on Wednesday but was moving lower today.
🇺🇸The US Chair Jerome Powell confirmed a slower pace of the Fed rate hikes, with a peak of the Fed rate below 5% in May. Previously, the market was pricing at a peak above this level in June. The Fed Chair's remarks made the US Dollar index test the 200-day SMA (3-month low).
📊The oil prices have increased on the softer China's Covid Zero policy. The oil market awaits the OPEC+ meeting on December 4, where the alliance is expected to set the supply levels for 2023.
📈The price of Aluminum at the London Stock Exchange exceeded $2500 for the first time since August. This is an excellent opportunity to follow the stock of Alcoa after the market opens.
🇮🇩Indonesian Central Bank introduced its plan to launch CBDC.
👀According to Morgan Stanley, investors lost confidence in Tesla after Elon Musk bought Twitter. Nearly 75% of survey respondents believe the Twitter situation accounted for a significant portion of Tesla's recent share price underperformance.
Read the analysis of EURUSD for today on the website: https://bit.ly/3ufw6fL
Good luck in trading!
⚡️Good Thursday!
🇨🇳The comments from China's top official in charge of the fight against the coronavirus, Vice Premier Sun Chunlan, on the weakening omicron variant and more Chinese getting vaccinated boosted the risk sentiment yesterday. HK50 jumped 3.3% on Wednesday but was moving lower today.
🇺🇸The US Chair Jerome Powell confirmed a slower pace of the Fed rate hikes, with a peak of the Fed rate below 5% in May. Previously, the market was pricing at a peak above this level in June. The Fed Chair's remarks made the US Dollar index test the 200-day SMA (3-month low).
📊The oil prices have increased on the softer China's Covid Zero policy. The oil market awaits the OPEC+ meeting on December 4, where the alliance is expected to set the supply levels for 2023.
📈The price of Aluminum at the London Stock Exchange exceeded $2500 for the first time since August. This is an excellent opportunity to follow the stock of Alcoa after the market opens.
🇮🇩Indonesian Central Bank introduced its plan to launch CBDC.
👀According to Morgan Stanley, investors lost confidence in Tesla after Elon Musk bought Twitter. Nearly 75% of survey respondents believe the Twitter situation accounted for a significant portion of Tesla's recent share price underperformance.
Read the analysis of EURUSD for today on the website: https://bit.ly/3ufw6fL
Good luck in trading!
FBS
Powell turns dovish, China softens Covid
Read the analysis of EURUSD and other news in the FBS website
👍25❤🔥4🐳3⚡1🤩1😍1🍓1
#XBRUSD
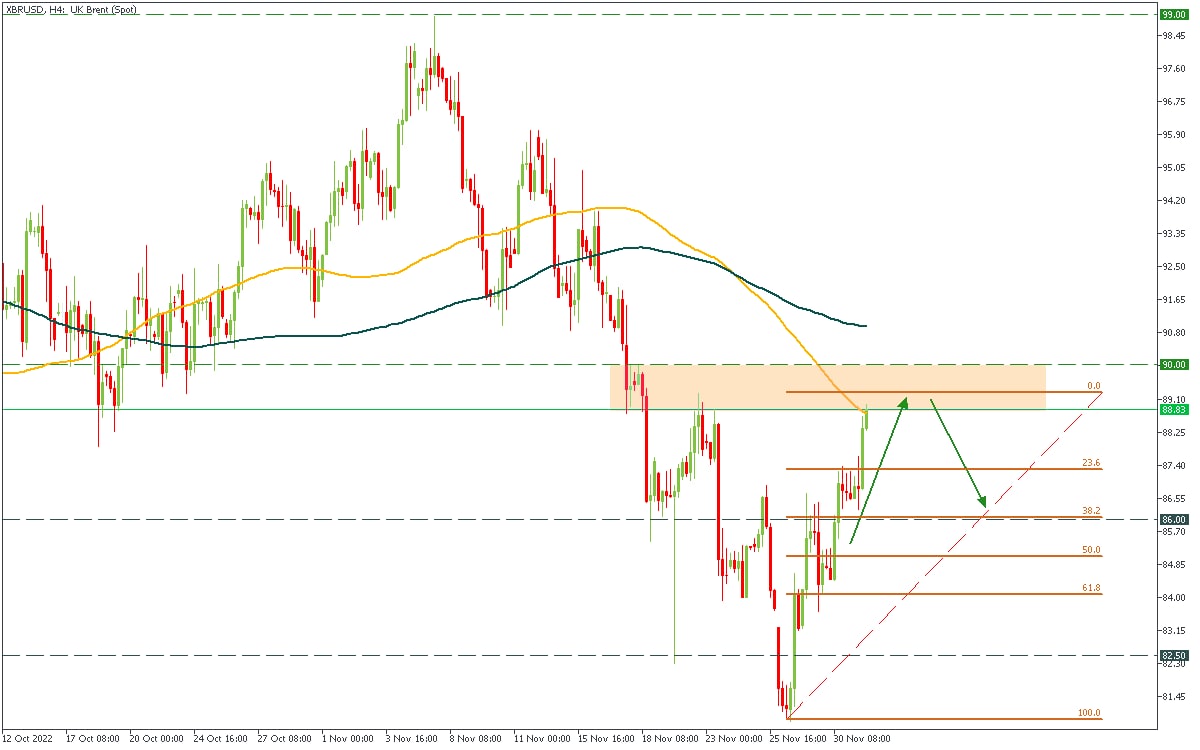
🛢Oil reached the target (yellow zone) after relief was gained by the Chinese government. Also, markets have a risk-on sentiment after yesterday's Powel speech.
📉 However, a correction should happen soon. We expect the price to go lower, near the level of $90.00. Therefore, you can Sell oil now or wait for it to go higher. SL must be above 200-period MA ($91.3).
🚀 Take Profit — $86.00
Do you expect oil to fall?
✅ START TRADING ✅
🛢Oil reached the target (yellow zone) after relief was gained by the Chinese government. Also, markets have a risk-on sentiment after yesterday's Powel speech.
Do you expect oil to fall?
Please open Telegram to view this post
VIEW IN TELEGRAM
🔥13👍5❤🔥2🐳2👎1
#US500
🇺🇸 Event to watch: US ISM Manufacturing PMI
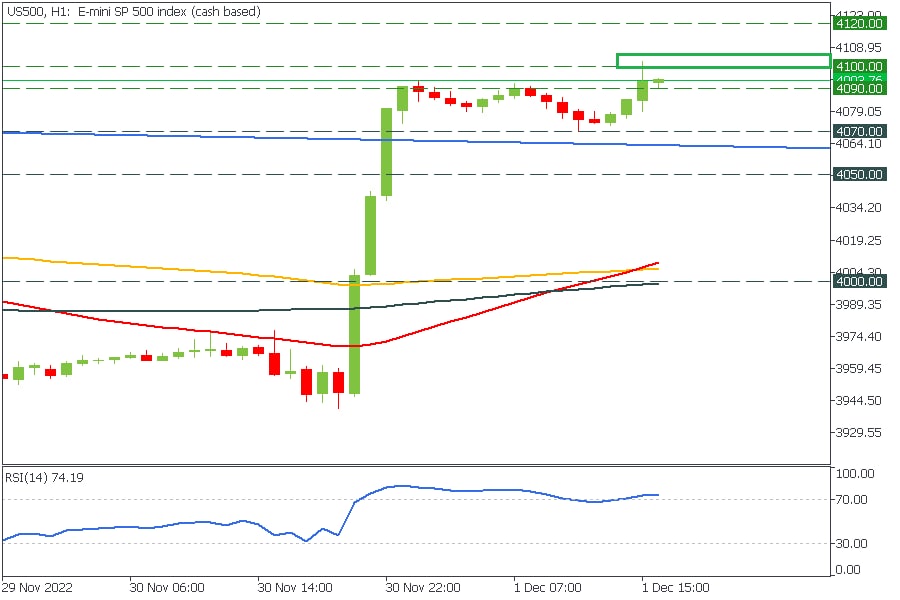
📈 The primary American index has enjoyed the risk-on sentiment after the Fed Powell comments on rate hikes and softer Covid-19 measures by the Chinese government. After striking above the 200-day SMA (September’s high), the index broke the long-term descending trendline and tested the 4100 level.
Now, we can expect a pullback toward the border of the descending trend line, where you can place a Buy Limit order at 4065. Don’t forget to set a Stop Loss below the trendline.
If the index breaks the 4100 level on a sudden volatility spike the next targets for buyers lie at 4120 and 4150.
The upcoming release of ISM Manufacturing PMI at 17:00 GMT+2 will add volatility to the index.
Will you buy S&P500?
🟩 START TRADING 🟩
Now, we can expect a pullback toward the border of the descending trend line, where you can place a Buy Limit order at 4065. Don’t forget to set a Stop Loss below the trendline.
If the index breaks the 4100 level on a sudden volatility spike the next targets for buyers lie at 4120 and 4150.
The upcoming release of ISM Manufacturing PMI at 17:00 GMT+2 will add volatility to the index.
Will you buy S&P500?
Please open Telegram to view this post
VIEW IN TELEGRAM
👍21🐳5❤🔥2⚡2🔥2🍓2