
#XBRUSD
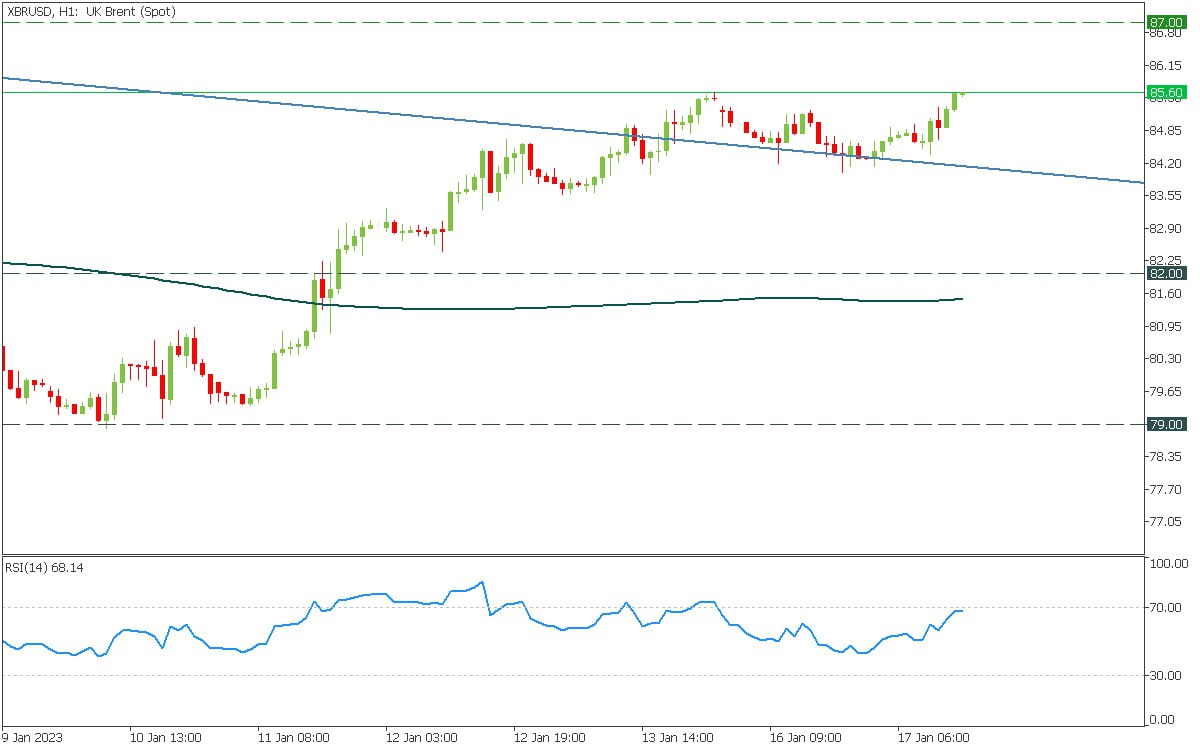
🛢 Oil is trying to break through the resistance of 85.60. If it succeeds, it will fly toward $87.00 per barrel.
📈 Buy traders may enter on the breakout after the retest.
Will it manage to break?
✅START TRADING ✅
🛢 Oil is trying to break through the resistance of 85.60. If it succeeds, it will fly toward $87.00 per barrel.
📈 Buy traders may enter on the breakout after the retest.
Will it manage to break?
✅START TRADING ✅
👍19🔥6🐳4🍓3❤🔥2❤1
#US500
Stock market is rising
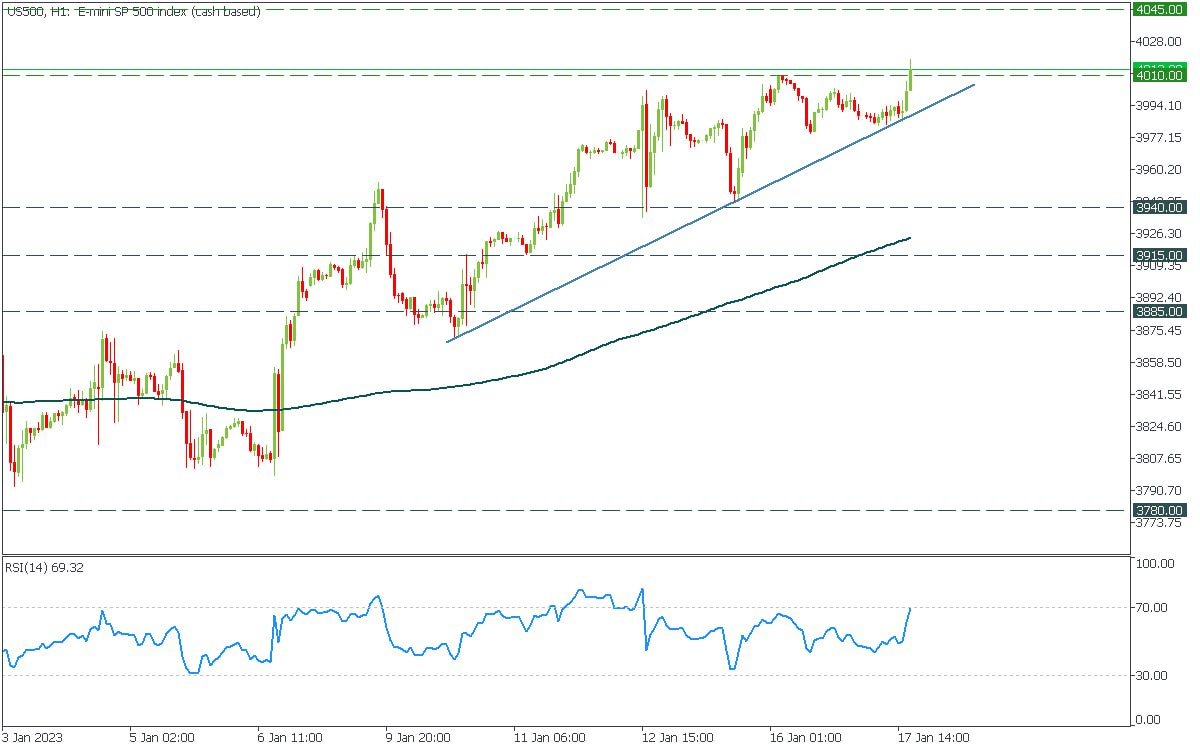
📈The US500 index is breaking through the resistance of 4010, another signal for buy traders to step into the game
🚀 If the H1 candle closes above the level, you may buy with a target of 4045 . However, be careful as the decline below 4010 would mean the movement was a fake
What are your thoughts?
✅START TRADING ✅
Stock market is rising
📈The US500 index is breaking through the resistance of 4010, another signal for buy traders to step into the game
🚀 If the H1 candle closes above the level, you may buy with a target of 4045 . However, be careful as the decline below 4010 would mean the movement was a fake
What are your thoughts?
✅START TRADING ✅
👍17❤🔥5🐳4🔥2😍2❤1👏1🍌1
#TradingEducation
Are you tired of trying to make sense of those chaotic charts and graphs? Well, fear not my friends, because today we're going to learn the ultimate secret of the Forex world: how to draw a trend line!
Now, before we begin, let me just say that drawing a trend line is like trying to tame a wild lion. It may seem intimidating at first, but with a little bit of practice and the right tools, you'll be the king of the chart jungle in no time!
1️⃣ Step 1: Identify the trend. This is where the real magic happens. Look for a series of higher highs and higher lows for an uptrend or lower lows and lower highs for a downtrend.
2️⃣ Step 2: Grab your trusty pen or pencil (or your digital equivalent) and start connecting the dots. A trend line is simply a straight line that connects two or more significant price points.
3️⃣ Step 3: Now, you may be tempted to just draw a straight line through the middle of all the price points, but that's where you'll go wrong. A true trend line should be touching at least two extreme points on the chart.
4️⃣Step 4: Once you have your trend line, it's time to put it to the test. As prices continue to move, use your trend line as a guide and see if the market is following it. If it holds, then congratulations, you've just tamed the lion!
And there you have it, folks! Now go forth and conquer the Forex world with your newfound trend line skills! To find out trend-trading strategies, visit the FBS website: https://bit.ly/3CVz3a9🏆
Are you tired of trying to make sense of those chaotic charts and graphs? Well, fear not my friends, because today we're going to learn the ultimate secret of the Forex world: how to draw a trend line!
Now, before we begin, let me just say that drawing a trend line is like trying to tame a wild lion. It may seem intimidating at first, but with a little bit of practice and the right tools, you'll be the king of the chart jungle in no time!
1️⃣ Step 1: Identify the trend. This is where the real magic happens. Look for a series of higher highs and higher lows for an uptrend or lower lows and lower highs for a downtrend.
2️⃣ Step 2: Grab your trusty pen or pencil (or your digital equivalent) and start connecting the dots. A trend line is simply a straight line that connects two or more significant price points.
3️⃣ Step 3: Now, you may be tempted to just draw a straight line through the middle of all the price points, but that's where you'll go wrong. A true trend line should be touching at least two extreme points on the chart.
4️⃣Step 4: Once you have your trend line, it's time to put it to the test. As prices continue to move, use your trend line as a guide and see if the market is following it. If it holds, then congratulations, you've just tamed the lion!
And there you have it, folks! Now go forth and conquer the Forex world with your newfound trend line skills! To find out trend-trading strategies, visit the FBS website: https://bit.ly/3CVz3a9🏆
👍44❤16🔥15❤🔥7😍4😈3🐳2👎1🍓1🍾1
#MarketNews
🌤 Good morning, traders! Here’s what we found for you:
🇨🇦 Canadian CPI releases surpassed expectations a little. Median and Trimmed CPI were above expectations by 0.1%. USDCAD is 650 points down.
🇺🇸 The US Empire State Manufacturing Index turned out to be lower than expected (-32.9 vs. -8.7 forecasted). The US dollar index fell 0.20%.
🇯🇵 The BOJ held a Press Conference on monetary policy. It decided to continue the QE (quantitative easing) and Monetary Easing policy, keeping the long-term interest rate at -0.1%. The bond’s yield is set to be in the range of around plus and minus 0.5%. USDJPY skyrocketed 3400 points.
🇪🇺 ECB member Villeroy said the EU should avoid recession this year. However, participants at the World Economic Forum disagree with him, putting a 63% chance of a recession in 2023.
💸 Bitcoin funding is mostly negative, meaning that there’re more short sellers on the market. Another bullish factor for the price.
🇬🇧 UK inflation dipped for a second month in December. Still, the annual CPI is 10.5%, and the crisis continues.
🇨🇳 All South Asian countries could benefit as Chinese travelers are spreading around the closest countries after the lockdowns ended.
🏆 Gold touched the support level of $1900 and is bouncing back up. Today the sentiment may drive the metal higher. What do you think about gold?
💚 Have a great day!
🌤 Good morning, traders! Here’s what we found for you:
🇨🇦 Canadian CPI releases surpassed expectations a little. Median and Trimmed CPI were above expectations by 0.1%. USDCAD is 650 points down.
🇺🇸 The US Empire State Manufacturing Index turned out to be lower than expected (-32.9 vs. -8.7 forecasted). The US dollar index fell 0.20%.
🇯🇵 The BOJ held a Press Conference on monetary policy. It decided to continue the QE (quantitative easing) and Monetary Easing policy, keeping the long-term interest rate at -0.1%. The bond’s yield is set to be in the range of around plus and minus 0.5%. USDJPY skyrocketed 3400 points.
🇪🇺 ECB member Villeroy said the EU should avoid recession this year. However, participants at the World Economic Forum disagree with him, putting a 63% chance of a recession in 2023.
💸 Bitcoin funding is mostly negative, meaning that there’re more short sellers on the market. Another bullish factor for the price.
🇬🇧 UK inflation dipped for a second month in December. Still, the annual CPI is 10.5%, and the crisis continues.
🇨🇳 All South Asian countries could benefit as Chinese travelers are spreading around the closest countries after the lockdowns ended.
🏆 Gold touched the support level of $1900 and is bouncing back up. Today the sentiment may drive the metal higher. What do you think about gold?
💚 Have a great day!
👍31❤🔥4🔥3🐳3❤2😍1🍓1
🇺🇸What are your expectations on USD after the US PPI release?
Anonymous Poll
48%
👆USD up
37%
👇USD down
15%
🤭I want to check the answers
🍾20👍8🐳4🔥3🤪3😢2
#Best_Investments
Part 4
Part three here
1️⃣9️⃣9️⃣0️⃣, the time before the bubble
🌐 The Internet came out of nowhere, creating hype and extolling Internet companies that people used to call dot-com companies.
🚀 Investors started to overvalue all companies that worked with the Internet, and the world started to think Internet companies would continue to grow incredibly fast and won’t stop. The bubble formed by the late 1990s.
During this time, the market was driven by several other factors, including a robust economy and low interest rates.
🤯 Surprisingly enough, people started to get the idea the Internet doesn't create any real-life things, and some Internet companies were just a junk.
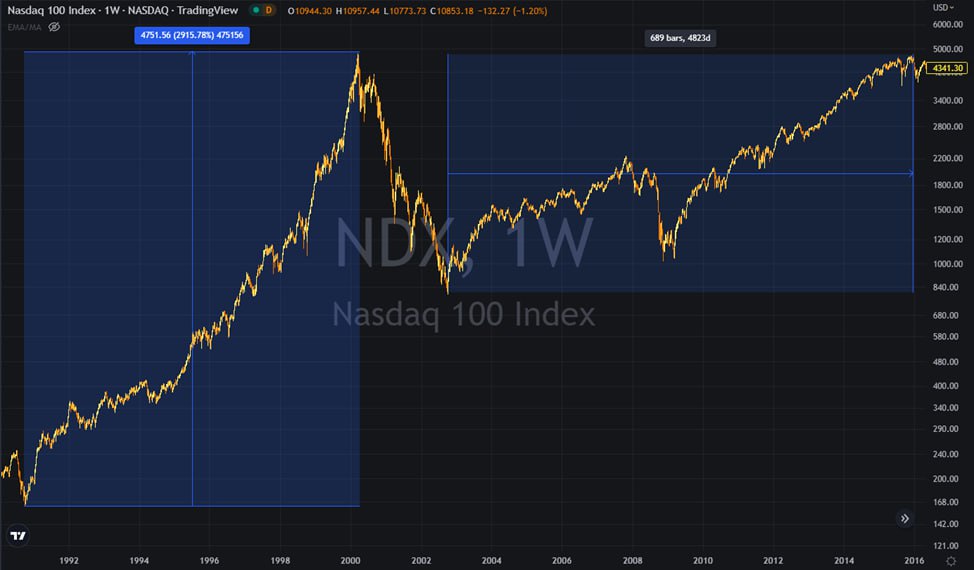
⚠️ Some companies, like AT&T, never fully recovered. Others, like Amazon, needed almost ten years to reach their previous all-time high. On average, the US100 index (NASDAQ) lost 83% of its market value. However, it gained almost 3000% over the decade.
💭 What do you think, where will the US100 be in five years?
Don't forget to give us a ❤️
Part 4
Part three here
1️⃣9️⃣9️⃣0️⃣, the time before the bubble
🌐 The Internet came out of nowhere, creating hype and extolling Internet companies that people used to call dot-com companies.
🚀 Investors started to overvalue all companies that worked with the Internet, and the world started to think Internet companies would continue to grow incredibly fast and won’t stop. The bubble formed by the late 1990s.
During this time, the market was driven by several other factors, including a robust economy and low interest rates.
🤯 Surprisingly enough, people started to get the idea the Internet doesn't create any real-life things, and some Internet companies were just a junk.
⚠️ Some companies, like AT&T, never fully recovered. Others, like Amazon, needed almost ten years to reach their previous all-time high. On average, the US100 index (NASDAQ) lost 83% of its market value. However, it gained almost 3000% over the decade.
💭 What do you think, where will the US100 be in five years?
Don't forget to give us a ❤️
❤38👍13❤🔥4🐳2🍌2👏1🍓1🍾1
🇺🇸🇯🇵#USDJPY
🔥USDJPY might bounce soon!
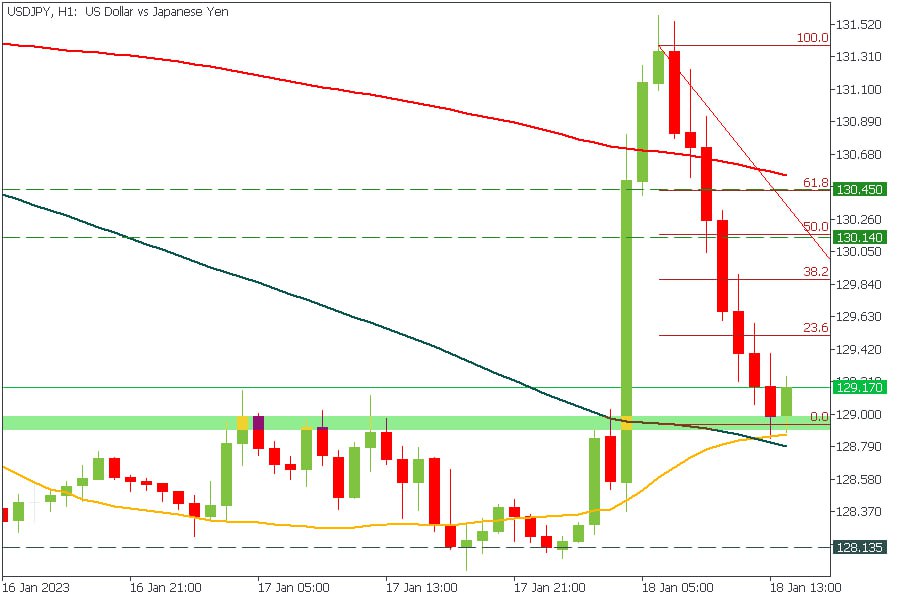
The price is consolidating above the support level in the H1 timeframe. According to the Fibonacci Retracement, we might see a bounce toward the 130.14 and 130.45, 50.0, and 61.8 Fibonacci levels, respectively.
❌SL: Below the support area
Be accurate! The US PPI will be announced in less than an hour!
✅START TRADING ✅
🔥USDJPY might bounce soon!
The price is consolidating above the support level in the H1 timeframe. According to the Fibonacci Retracement, we might see a bounce toward the 130.14 and 130.45, 50.0, and 61.8 Fibonacci levels, respectively.
❌SL: Below the support area
Be accurate! The US PPI will be announced in less than an hour!
✅START TRADING ✅
👍25🔥6❤3🤪3❤🔥2💔2🍾1
🔥US PPI Numbers!
🔥 PPI:
Actual: -0.5%
Forecast: -0.1%
Previous: 0.3%
🔥Core PPI:
Actual: 0.1%
Forecast: 0.1%
Previous: 0.4%
🔥Retail Sales:
Actual: -1.1%
Forecast: -0.8%
Previous: -0.6%
🔥Core Retail Sales:
Actual: -1.1%
Forecast: -0.5%
Previous: -0.2%
🔥 PPI:
Actual: -0.5%
Forecast: -0.1%
Previous: 0.3%
🔥Core PPI:
Actual: 0.1%
Forecast: 0.1%
Previous: 0.4%
🔥Retail Sales:
Actual: -1.1%
Forecast: -0.8%
Previous: -0.6%
🔥Core Retail Sales:
Actual: -1.1%
Forecast: -0.5%
Previous: -0.2%
👍21🐳6🔥4❤3❤🔥2
🇦🇺🇺🇸#AUDUSD
🔥AUDUSD looks bearish!
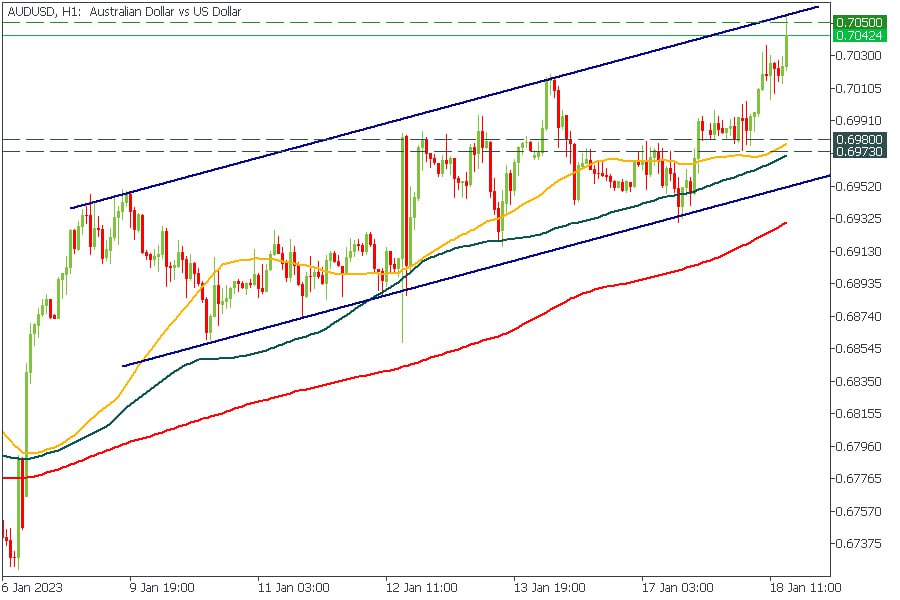
AUDUSD bounces off the upper border of the ascending channel. Thus, we expect the pair to reverse toward the 0.6973 - 0.6980 support range.
👍The resistance level of 0.7050 looks like a great point to sell.
❌SL: Above the resistance trend line
Do you think the US dollar might reverse now?
✅START TRADING ✅
🔥AUDUSD looks bearish!
AUDUSD bounces off the upper border of the ascending channel. Thus, we expect the pair to reverse toward the 0.6973 - 0.6980 support range.
👍The resistance level of 0.7050 looks like a great point to sell.
❌SL: Above the resistance trend line
Do you think the US dollar might reverse now?
✅START TRADING ✅
👍12🔥2🐳2🥱1
#Education
🏆Trading gold in 2023🏆
🥇Why do traders prefer gold?
There are many reasons for this. In this article, we will discuss the reasons to choose gold as a trading asset, what moves gold prices, and how to trade gold via CFD.
📈What moves gold prices?
Before learning how to trade gold, it is important to understand what affects the price of yellow metal. This information can help you make logical trading decisions and reduce the risk of loss.
➡️Read the article: http://bit.ly/3XAq4D6
🏆Trading gold in 2023🏆
🥇Why do traders prefer gold?
There are many reasons for this. In this article, we will discuss the reasons to choose gold as a trading asset, what moves gold prices, and how to trade gold via CFD.
📈What moves gold prices?
Before learning how to trade gold, it is important to understand what affects the price of yellow metal. This information can help you make logical trading decisions and reduce the risk of loss.
➡️Read the article: http://bit.ly/3XAq4D6

👍20🔥10❤6🐳3😍2❤🔥1😢1
🇺🇸🇨🇦#USDCAD
🔥USDCAD looks bullish!
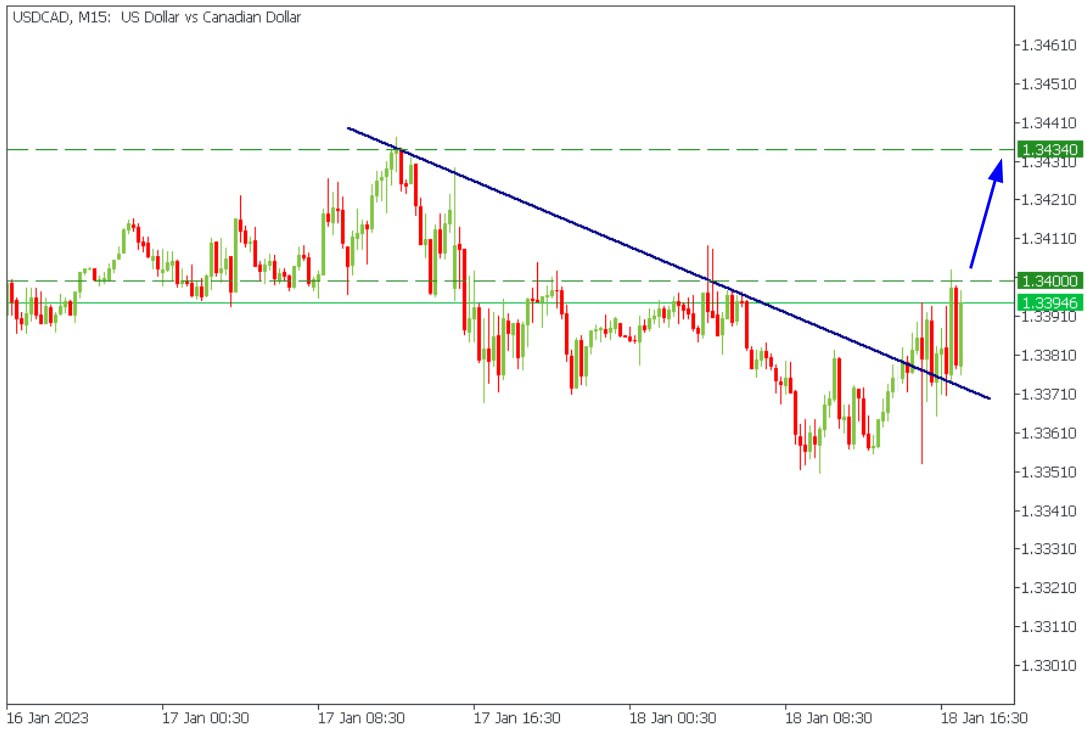
The price broke through the descending trendline and retested if from the above. Thus, consider buying the pair when the price breaks through the 1.3400.
🎯Target: 1.3400
Are you still trading today?
✅TRY TRADING WITH FBS ✅
🔥USDCAD looks bullish!
The price broke through the descending trendline and retested if from the above. Thus, consider buying the pair when the price breaks through the 1.3400.
🎯Target: 1.3400
Are you still trading today?
✅TRY TRADING WITH FBS ✅
👍24🔥14❤9🐳4🍌3
🇪🇺🇺🇸#EURUSD
🔥💥Congratulations to everyone who traded AUDUSD and USDCAD yesterday! One thousand points are booked from two trades! Let's keep going!
😱EURUSD looks bullish!
The price is consolidating above the support range and the 50-period moving average. Thus, we expect the pair to return to 1.0870!
❗️However, be careful! If the price breaks below the 50-period MA and the 1.0775 support level, it will drop to 1.0710.
Are you bullish or bearish on EURUSD today?
✅TRY TRADING WITH FBS ✅
🔥💥Congratulations to everyone who traded AUDUSD and USDCAD yesterday! One thousand points are booked from two trades! Let's keep going!
😱EURUSD looks bullish!
The price is consolidating above the support range and the 50-period moving average. Thus, we expect the pair to return to 1.0870!
❗️However, be careful! If the price breaks below the 50-period MA and the 1.0775 support level, it will drop to 1.0710.
Are you bullish or bearish on EURUSD today?
✅TRY TRADING WITH FBS ✅

🔥24👍12❤4👏2🥰1😱1🥱1🍌1🍾1
#MarketNews
💚 Hello traders! Another great day full of trading opportunities. Let’s dive in together!
🇳🇿 New Zealand’s prime minister suddenly resigned despite expectations of her being elected for the third time. NZDUSD is down 2%.
🥈Alcoa corporation released better-than-expected results yesterday. However, the stock was down 6%.
🇦🇺 The unemployment rate in Australia rose to 3.6% from 3.5% in the previous month. AUDUSD is down 640 points since the release.
🇺🇸 Bad Retail Sales data in the US caused EURUSD to fall 800 points. PPI is also way lower than expected (-0.5% actual vs. -0.1% forecast).
💸 US Ministry of Justice declared it would fight money laundering in the crypto industry, starting from the unpopular Russian exchange “Bitzlato,” which is responsible for $700 million of fraudulent activity. The crypto market lost 2%.
🏆 Gold is again rejected from the support line of $1900. The breakout would send the metal to $1885.
💭 How is your day?
💚 Hello traders! Another great day full of trading opportunities. Let’s dive in together!
🇳🇿 New Zealand’s prime minister suddenly resigned despite expectations of her being elected for the third time. NZDUSD is down 2%.
🥈Alcoa corporation released better-than-expected results yesterday. However, the stock was down 6%.
🇦🇺 The unemployment rate in Australia rose to 3.6% from 3.5% in the previous month. AUDUSD is down 640 points since the release.
🇺🇸 Bad Retail Sales data in the US caused EURUSD to fall 800 points. PPI is also way lower than expected (-0.5% actual vs. -0.1% forecast).
💸 US Ministry of Justice declared it would fight money laundering in the crypto industry, starting from the unpopular Russian exchange “Bitzlato,” which is responsible for $700 million of fraudulent activity. The crypto market lost 2%.
🏆 Gold is again rejected from the support line of $1900. The breakout would send the metal to $1885.
💭 How is your day?
👍23🔥6❤🔥4🐳4😍3❤1😈1🙈1
🇦🇺🇺🇸#AUDUSD
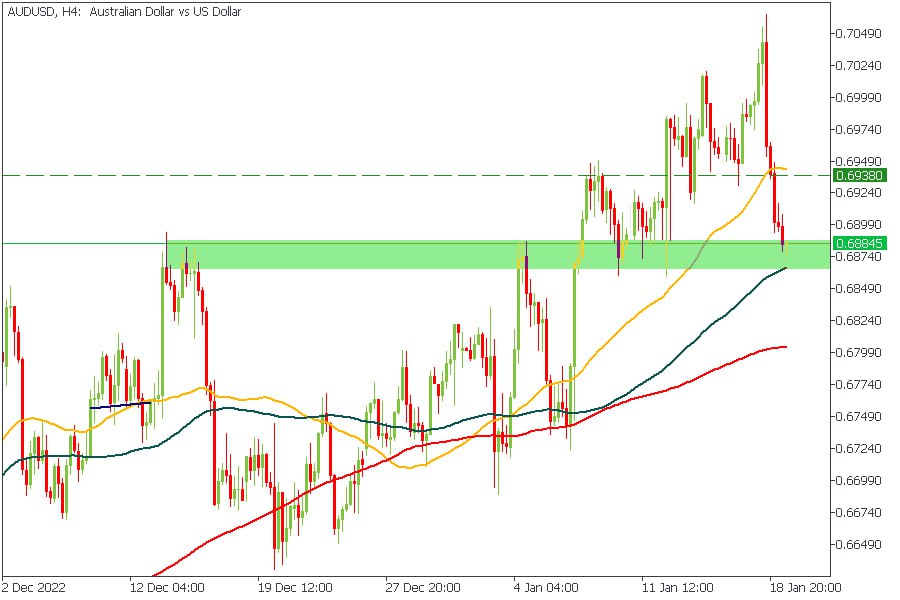
🔥AUDUSD - correction might happen!
After a massive dump the price reached the support range and the 100-period moving average. Thus, we expect a tiny correction to happen here. Our target is the 50-period moving average.
🟢Trade: BUY
🎯Target: 0.6938
How often do you trade AUDUSD?
✅START TRADING ✅
🔥AUDUSD - correction might happen!
After a massive dump the price reached the support range and the 100-period moving average. Thus, we expect a tiny correction to happen here. Our target is the 50-period moving average.
🟢Trade: BUY
🎯Target: 0.6938
How often do you trade AUDUSD?
✅START TRADING ✅
👍28🔥4🐳4❤3❤🔥1
🇬🇧🇺🇸#GBPUSD
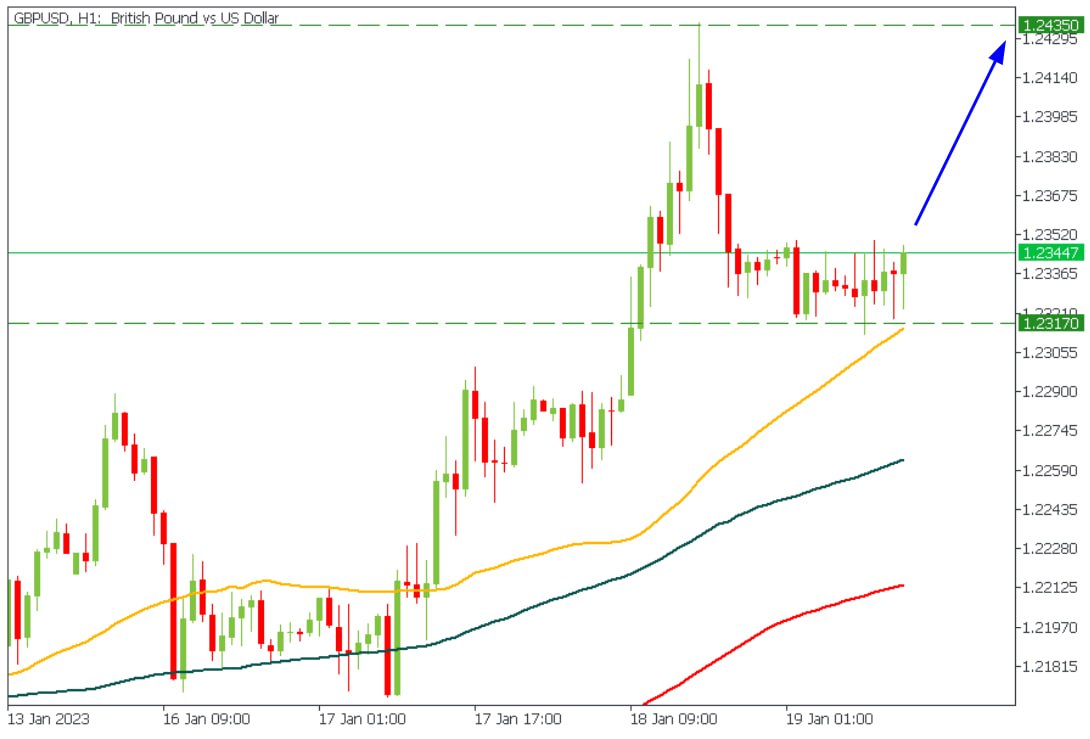
🔥GBPUSD looks bullish!
The price is rounding above the 50-hour moving average. Thus, we suggest the pair will make another attempt to break above the 1.2435.
🟢Trade: BUY
🎯Target: 1.2435
Do you agree?
✅START TRADING ✅
🔥GBPUSD looks bullish!
The price is rounding above the 50-hour moving average. Thus, we suggest the pair will make another attempt to break above the 1.2435.
🟢Trade: BUY
🎯Target: 1.2435
Do you agree?
✅START TRADING ✅
👍16❤5🔥5🍾2🙈1
#education
Smart money concept that works
⏸ Supply and demand trading is about placing your orders according to zones where the price tends to reverse due to various factors. It’s almost like support and resistance lines but wider and usually backed up by fundamental factors.
⚡️ Usually, the price reacts sharply to supply and demand zones, meaning there is a lot of selling or buying interest.
✅ But how do you know when to enter? That’s what the picture is about. Look for a rally-base-drop movement or other variations of it. The price tends to retest the base before moving toward the rally.
📍 These areas allow traders to implement a favorable risk-to-reward approach in trades. You can set a buy limit order before the price reaches the base, and the chart will do it for you. Notice that stop loss should usually be near the demand zone and below the supply zone.
💭 What else do you want to know about trading?
Smart money concept that works
⏸ Supply and demand trading is about placing your orders according to zones where the price tends to reverse due to various factors. It’s almost like support and resistance lines but wider and usually backed up by fundamental factors.
⚡️ Usually, the price reacts sharply to supply and demand zones, meaning there is a lot of selling or buying interest.
✅ But how do you know when to enter? That’s what the picture is about. Look for a rally-base-drop movement or other variations of it. The price tends to retest the base before moving toward the rally.
📍 These areas allow traders to implement a favorable risk-to-reward approach in trades. You can set a buy limit order before the price reaches the base, and the chart will do it for you. Notice that stop loss should usually be near the demand zone and below the supply zone.
💭 What else do you want to know about trading?

👍49🔥17❤🔥6👌4🐳4🍾3✍2🍌2
💰What’s your average target for one trade?
Anonymous Poll
32%
0-50 points
32%
50-100 points
14%
100-200 points
9%
200-500 points
6%
500-1000 points
8%
>1000 points
👍44❤23🤪15❤🔥5🙈4🔥3⚡2🥰2😍2🐳1
🇺🇸🇨🇦#USDCAD
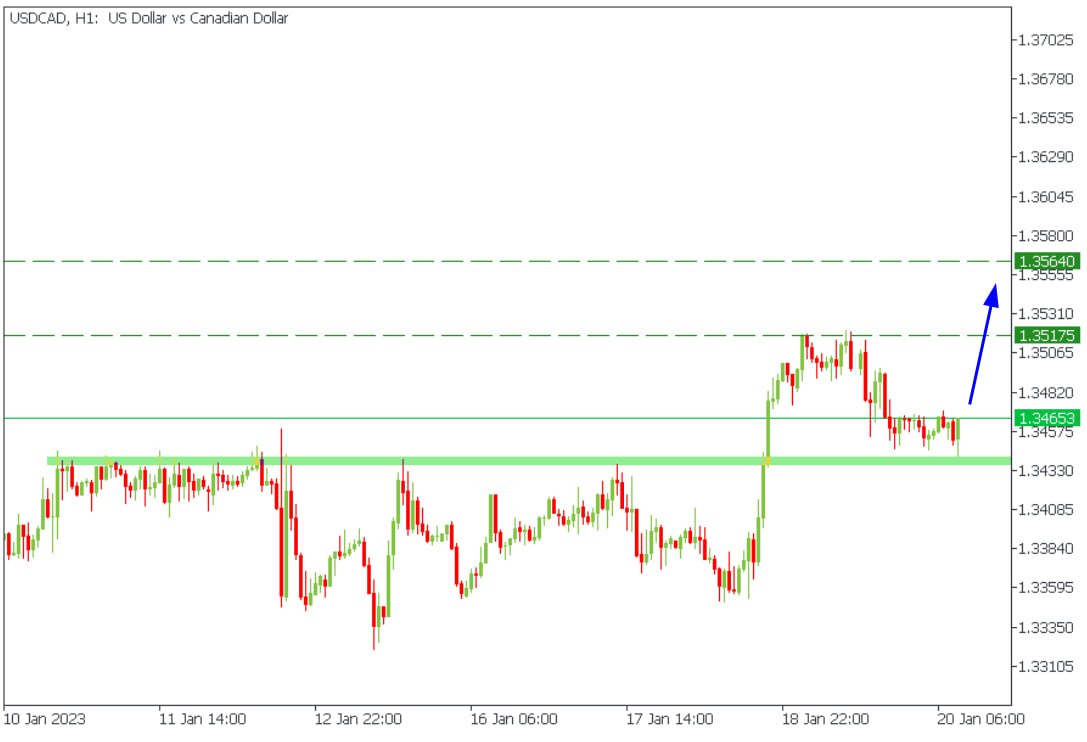
USDCAD looks bullish!
The price retested the breakout and bounced back. Thus, we believe the rally in USDCAD might continue.
🟢Trade: BUY
🎯Targets: 1.35175, 1.3565
Do you agree? Hit 🔥 if yes!
✅TRY TRADING WITH FBS ✅
USDCAD looks bullish!
The price retested the breakout and bounced back. Thus, we believe the rally in USDCAD might continue.
🟢Trade: BUY
🎯Targets: 1.35175, 1.3565
Do you agree? Hit 🔥 if yes!
✅TRY TRADING WITH FBS ✅
🔥41👍12❤7😱4
#MarketNews
💚 Happy Friday, traders! Let's start the day!
🇬🇧JPMorgan improves UK GDP forecast to -0.1% from -0.3% in 2023. The bank raised the forecast for the peak rate of the Central Bank of England to 4.5% from 4.25%.
🇺🇸The US national debt has reached its ceiling. The Biden administration refused to discuss the conditions for raising the national debt ceiling with the US Congress and called for an immediate decision to increase its level. The US national debt reached its ceiling. The Biden administration refused to discuss the conditions for raising the national debt ceiling with the US Congress and called for an immediate increase.
🇯🇵Core inflation in Japan hit a 41-year high of 4%.
📺Netflix stock gained 7% after the earnings release as the number of subscribers overperformed expectations.
🏦JPMorgan believes investors should sell shares and take profits. The risks of a recession and excessive tightening of the Fed's policy remain high, so the US stock market is expected to fall.
Would you like to know what pattern EURUSD is trading in?
Smash ❤️!
💚 Happy Friday, traders! Let's start the day!
🇬🇧JPMorgan improves UK GDP forecast to -0.1% from -0.3% in 2023. The bank raised the forecast for the peak rate of the Central Bank of England to 4.5% from 4.25%.
🇺🇸The US national debt has reached its ceiling. The Biden administration refused to discuss the conditions for raising the national debt ceiling with the US Congress and called for an immediate decision to increase its level. The US national debt reached its ceiling. The Biden administration refused to discuss the conditions for raising the national debt ceiling with the US Congress and called for an immediate increase.
🇯🇵Core inflation in Japan hit a 41-year high of 4%.
📺Netflix stock gained 7% after the earnings release as the number of subscribers overperformed expectations.
🏦JPMorgan believes investors should sell shares and take profits. The risks of a recession and excessive tightening of the Fed's policy remain high, so the US stock market is expected to fall.
Would you like to know what pattern EURUSD is trading in?
Smash ❤️!
❤35👍18🔥4🍾2
😱😱If your heartbeat is increasing with every sec and your palms are getting sweaty when you are about to click Buy or Sell buttons, you have to watch our new vid.
💚 We’ve gathered 3 trading psychology tips to help you avoid emotional roller coasters while trading.
➡️ http://bit.ly/3XHTFL1
💚 We’ve gathered 3 trading psychology tips to help you avoid emotional roller coasters while trading.
Please open Telegram to view this post
VIEW IN TELEGRAM
YouTube
How to Control Hope, Fear, Greed. Emotional Trading
Emotional trading is something that is familiar to every trader. It truly is challenging to deal with hope, fear, and greed in trading because trading is challenging. Wrong and hasty choices may bring losses. The best thing you can do is to stay calm and…
👍15❤5👏5🐳4❤🔥3🤓3🔥2👌1😍1🍾1