
The price has formed a double top pattern on the 30M timeframe. A breakout below 1857.40 will open the way to 1850.00.
🎯Target: 1850.00
Do you agree?
Please open Telegram to view this post
VIEW IN TELEGRAM
👍61👎9❤🔥8❤8🔥3👌3😍3😁1
#LiveStream
🔥Today, at 15:30 GMT+2, the US CPI will be released!
This event will make a high impact on financial markets. Thus, our expert RJ Austria would like to share trade Ideas & market insights with you!
Last time, RJ went Live on the NFP release and succeeded in trading gold, taking over 1000 points profit in XAUUSD.
😎 Join our live YouTube stream at 15:15 GMT+2 and trade with the master!
➡️ Link: https://www.youtube.com/watch?v=4VK7V51kOdc
🔥Today, at 15:30 GMT+2, the US CPI will be released!
This event will make a high impact on financial markets. Thus, our expert RJ Austria would like to share trade Ideas & market insights with you!
Last time, RJ went Live on the NFP release and succeeded in trading gold, taking over 1000 points profit in XAUUSD.
Please open Telegram to view this post
VIEW IN TELEGRAM
YouTube
[ENGLISH] LIVE FOREX CPI RELEASE TRADING - February 14
Start trading now: https://bit.ly/3yf6Ibz
Today, the US Bureau of Labor Statistics will release the monthly CPI changes. FBS financial expert RJ Austria will make a LIVE forex trading session on the CPI release. He will be trading live and sharing his ideas…
Today, the US Bureau of Labor Statistics will release the monthly CPI changes. FBS financial expert RJ Austria will make a LIVE forex trading session on the CPI release. He will be trading live and sharing his ideas…
❤24👍11❤🔥6🔥2😍2👌1
🔥Our stream has started!
RJ wonders about your expectations on the USD today?
RJ wonders about your expectations on the USD today?
Anonymous Poll
64%
🐂I‘m bullish on USD
36%
🧸I‘m bearish on USD
👍20❤🔥5🔥3❤1👎1
Actual: 6.4%
Forecast: 6.2%
Previous: 6.5%
🔥CPI m/m
Actual: 0.5%
Forecast: 0.5%
Previous: -0.1%
🔥Core CPI m/m
Actual: 0.4%
Forecast: 0.4%
Previous: 0.3%
Please open Telegram to view this post
VIEW IN TELEGRAM
👍43🔥9👎1
USDJPY broke above the resistance level of 132.85. Buyers are dominating the market.
🎯TP: 134.40
Please open Telegram to view this post
VIEW IN TELEGRAM
❤34👍18🔥11
#MarketNews
☀️ Hi, traders! How was your CPI trading? The market was confused by the reading but managed to choose a direction later. Here’s what you should know:
🇺🇸 The monthly CPI came as expected at 0.5%. Annual inflation is above expectations (6.4% vs. 6.2% forecast). The market had a mixed reaction.
🏆 As we said here and here, gold broke through every support line and almost reached $1830. Congratulations to all sellers! From the current level, the metal may bounce to $1843.
📈 US500 reached the sell zone of 4160 and plunged to 4100. Stocks didn’t take inflation figures as a bearish signal. Therefore, US30, Bitcoin, and other risk assets may start a local uptrend.
🇬🇧 Annual inflation in the UK came out lower than expected (10.1% vs. 10.3% forecast). GBPUSD is down 1200 points.
🛢 The oil market squeezed down on hints that the US will build more crude extractors.
🐶 Elon Musk said his dog is a better Twitter CEO than himself. Dogecoin soared by 4%.
💚 Have a beautiful day!
☀️ Hi, traders! How was your CPI trading? The market was confused by the reading but managed to choose a direction later. Here’s what you should know:
🇺🇸 The monthly CPI came as expected at 0.5%. Annual inflation is above expectations (6.4% vs. 6.2% forecast). The market had a mixed reaction.
🏆 As we said here and here, gold broke through every support line and almost reached $1830. Congratulations to all sellers! From the current level, the metal may bounce to $1843.
📈 US500 reached the sell zone of 4160 and plunged to 4100. Stocks didn’t take inflation figures as a bearish signal. Therefore, US30, Bitcoin, and other risk assets may start a local uptrend.
🇬🇧 Annual inflation in the UK came out lower than expected (10.1% vs. 10.3% forecast). GBPUSD is down 1200 points.
🛢 The oil market squeezed down on hints that the US will build more crude extractors.
🐶 Elon Musk said his dog is a better Twitter CEO than himself. Dogecoin soared by 4%.
💚 Have a beautiful day!
👍20❤🔥5🐳4🔥3😍2💯1
USDCHF might decline!
The price is bouncing off the resistance trendline. Thus, we expect the pair to decline.
🔴Trade: SELL USDCHF
🎯TP: 0.9160
Smash 👍 if you agree!
Please open Telegram to view this post
VIEW IN TELEGRAM
👍43❤8❤🔥5⚡3😭3🔥2😐2
⛽️ #XNGUSD
Gas is ready for a pump!
📍XNGUSD fell by 65% since the last high. We suppose, the price is ready for a downtrend correction.
📈 Thus, you may open a Buy trade, aiming for 23.6 and 38.2 Fibonacci resistance levels.
🎯TP: 3.100, 3.400, 4.000
❌ SL: below 2.350
Give us a❤️ if you like mid-term signals
✅ TRADE WITH FBS ✅
Gas is ready for a pump!
📍XNGUSD fell by 65% since the last high. We suppose, the price is ready for a downtrend correction.
🎯TP: 3.100, 3.400, 4.000
Give us a
Please open Telegram to view this post
VIEW IN TELEGRAM
❤43❤🔥8👍8😍5🔥3
🇬🇧🇺🇸#GBPUSD
🔥 GBPUSD looks bearish!
The price broke through the lower border of the rising channel. Currently, the price is consolidating above the support level 1.2035. Consider selling GBPUSD as soon as the price breaks below the support level. The target is 1.1965.
❗️ However, be careful, before a breakout the price might pull back and retest the lower channel's border.
Are you bullish or bearish on GBPUSD ahead of the Retail Sales?
✅ TRADE WITH FBS ✅
The price broke through the lower border of the rising channel. Currently, the price is consolidating above the support level 1.2035. Consider selling GBPUSD as soon as the price breaks below the support level. The target is 1.1965.
Are you bullish or bearish on GBPUSD ahead of the Retail Sales?
Please open Telegram to view this post
VIEW IN TELEGRAM
🔥23👍13❤5👀4❤🔥1✍1
Actual: 3.0%
Forecast: 1.9%
Previous: -1.1%
🔥Core Retail Sales m/m
Actual: 2.3%
Forecast: 0.9%
Previous: -1.1%
Please open Telegram to view this post
VIEW IN TELEGRAM
👍26🔥8👎4❤3
Yesterday's USDJPY idea worked perfectly as the pair reached the 134.40 resistance level.
Now you might look for sell trades inside the 134.40 - 134.70 range with the target at 100-hour moving average. The price needs to pull back before the trend continues.
Trade: Sell
Entry: 134.40 - 134.70 range
TP: 100-hour moving average
Please open Telegram to view this post
VIEW IN TELEGRAM
👍39❤11🔥4🥱4🐳1
#MarketNews
🤑 Did you see Bitcoin yesterday? It was amazing!
🚀 A total of $211 million was liquidated in one day, and the biggest crypto skyrocketed 10%. In a nutshell, the growth may continue till $28 000. If you are in crypto, seek Buy trades in all coins until this level is reached.
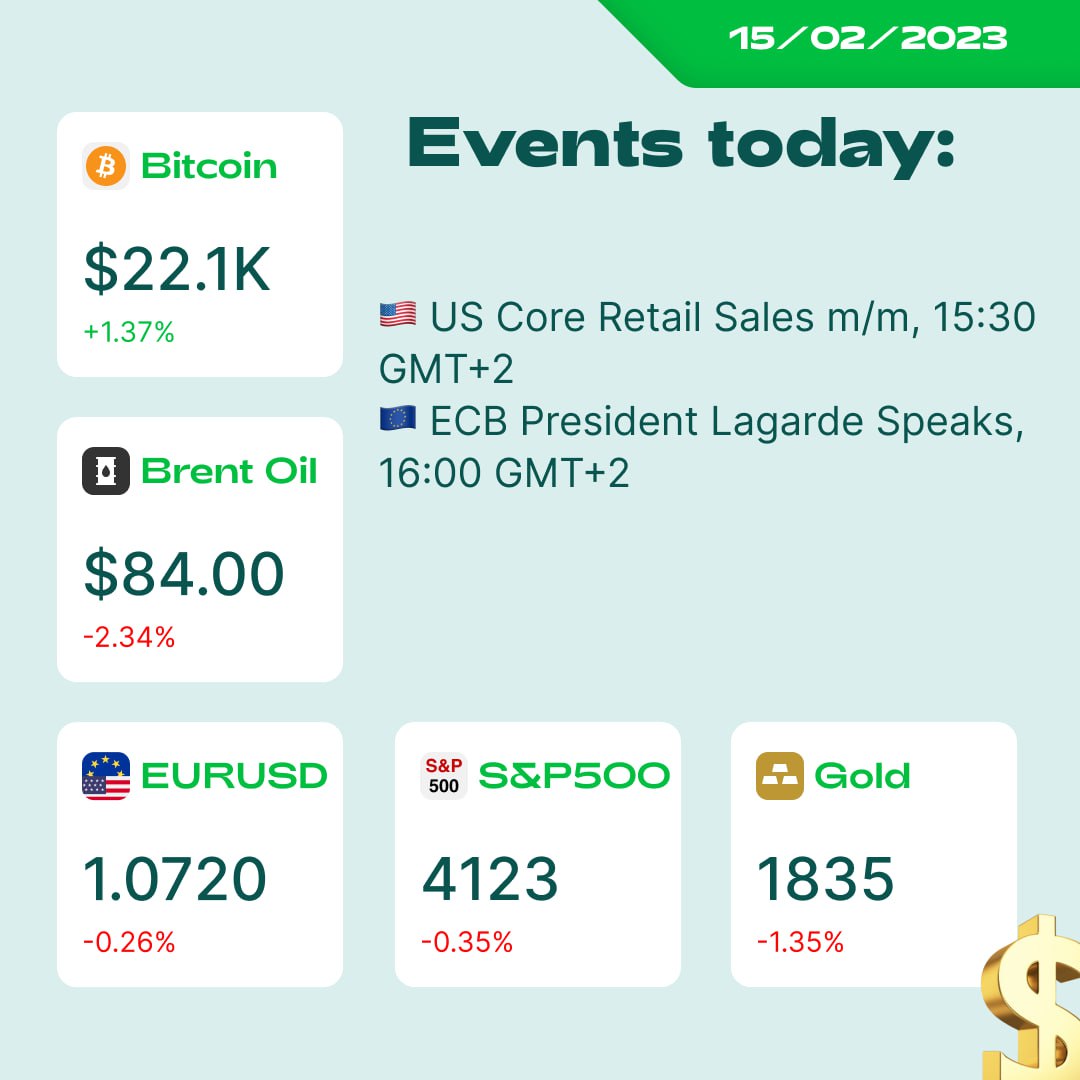
🇪🇺 ECB’s President Lagarde: I intend to raise rates by 50 basis points in March. EURUSD is up 500 points.
📊 Monthly US Retail Sales and Core Retail Sales surpassed expectations a lot. It means the economy is speeding up, which is bad for inflation, and for the Federal Reserve, which aims to slow the process. However, risky markets seem to not care about it. US500 grew 0.95%.
🇦🇺 Australia’s unemployment rate turned out to be higher than expected (3.7% vs. 3.5% forecast).
🇨🇳 China is willing to share ultra-large-scale markets, complete industrial systems, and advanced technologies with central Asian countries. Bullish on HK50 in the long term.
🪶 Robinhood reported that cryptocurrency trading volume jumped 95% in January. The stock is up 7% this week.
🏆 Gold consolidates after touching the $1830 critical support line. Short-term traders may try to catch a pullback to $1849.
💚 Have a profitable day!
🇪🇺 ECB’s President Lagarde: I intend to raise rates by 50 basis points in March. EURUSD is up 500 points.
🇦🇺 Australia’s unemployment rate turned out to be higher than expected (3.7% vs. 3.5% forecast).
🪶 Robinhood reported that cryptocurrency trading volume jumped 95% in January. The stock is up 7% this week.
Please open Telegram to view this post
VIEW IN TELEGRAM
👍29❤6🔥6❤🔥2🐳2👎1👏1😍1
🇪🇺🇺🇸 👉 🇪🇺 🇻🇦 🌠 👈 #EURUSD
EURUSD is declining!
EURUSD is moving inside the descending channel.
The price failed to break above the 1.0710 and reversed toward the lower channel’s border.
After a breakout below 1.0690, the way to 1.0660 and 1.0630 will be opened.
🔽 Trade: Sell
🟢 Entry: breakout below 1.0690
🎯TP: 1.0660, 1.0630
😈 Are you in?
✅ TRADE WITH FBS ✅
EURUSD is declining!
EURUSD is moving inside the descending channel.
The price failed to break above the 1.0710 and reversed toward the lower channel’s border.
After a breakout below 1.0690, the way to 1.0660 and 1.0630 will be opened.
🎯TP: 1.0660, 1.0630
Please open Telegram to view this post
VIEW IN TELEGRAM
👍33🔥8✍3❤🔥3🐳3❤2👎1🥱1
Currently, the price is retesting the support trendline from below, with 1843.00 as the primary resistance.
We expect a downtrend to continue after the price touches 1843.00 (or the resistance trendline or 100-hour moving average).
🎯TP: 1830.00, 1820.00
Are you bearish on XAUUSD today?
Please open Telegram to view this post
VIEW IN TELEGRAM
👍56❤🔥7🔥7❤4👌4😍2🏆1
🇺🇸🇨🇦#USDCAD
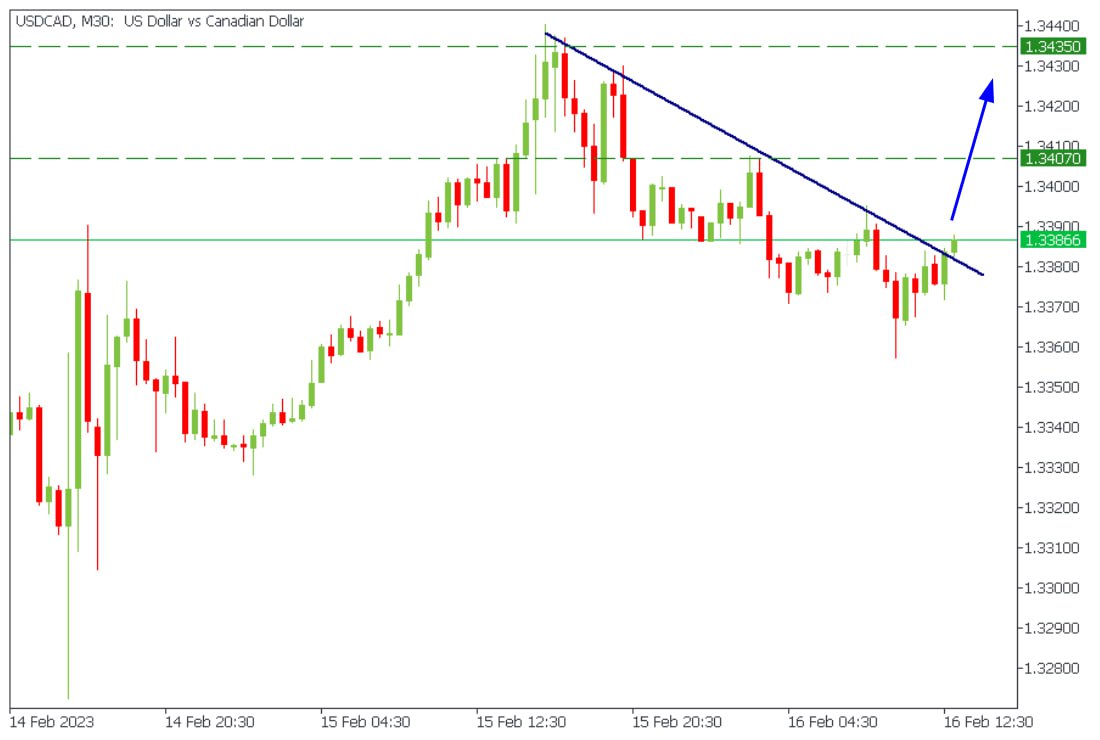
🔥USDCAD broke through the resistance trendline!
Consider buying USDCAD with targets 1.3407 and 1.3435!
Do you agree?
✅TRADE WITH FBS ✅
🔥USDCAD broke through the resistance trendline!
Consider buying USDCAD with targets 1.3407 and 1.3435!
Do you agree?
✅TRADE WITH FBS ✅
✍16👍14❤6🔥4🏆1
💥Voice chat with FBS analyst!💥
👋Hi, dear traders!
20 minutes left till the US PPI release! And only 5 minutes left for our weekly voice chat!
Join us discuss the markets ahead of the ECB and BOE Monetary Policy Statements!
Link: https://t.me/fbsanalytics?livestream
👋Hi, dear traders!
20 minutes left till the US PPI release! And only 5 minutes left for our weekly voice chat!
Join us discuss the markets ahead of the ECB and BOE Monetary Policy Statements!
Link: https://t.me/fbsanalytics?livestream

👍30❤10🔥5🙏3🍾2
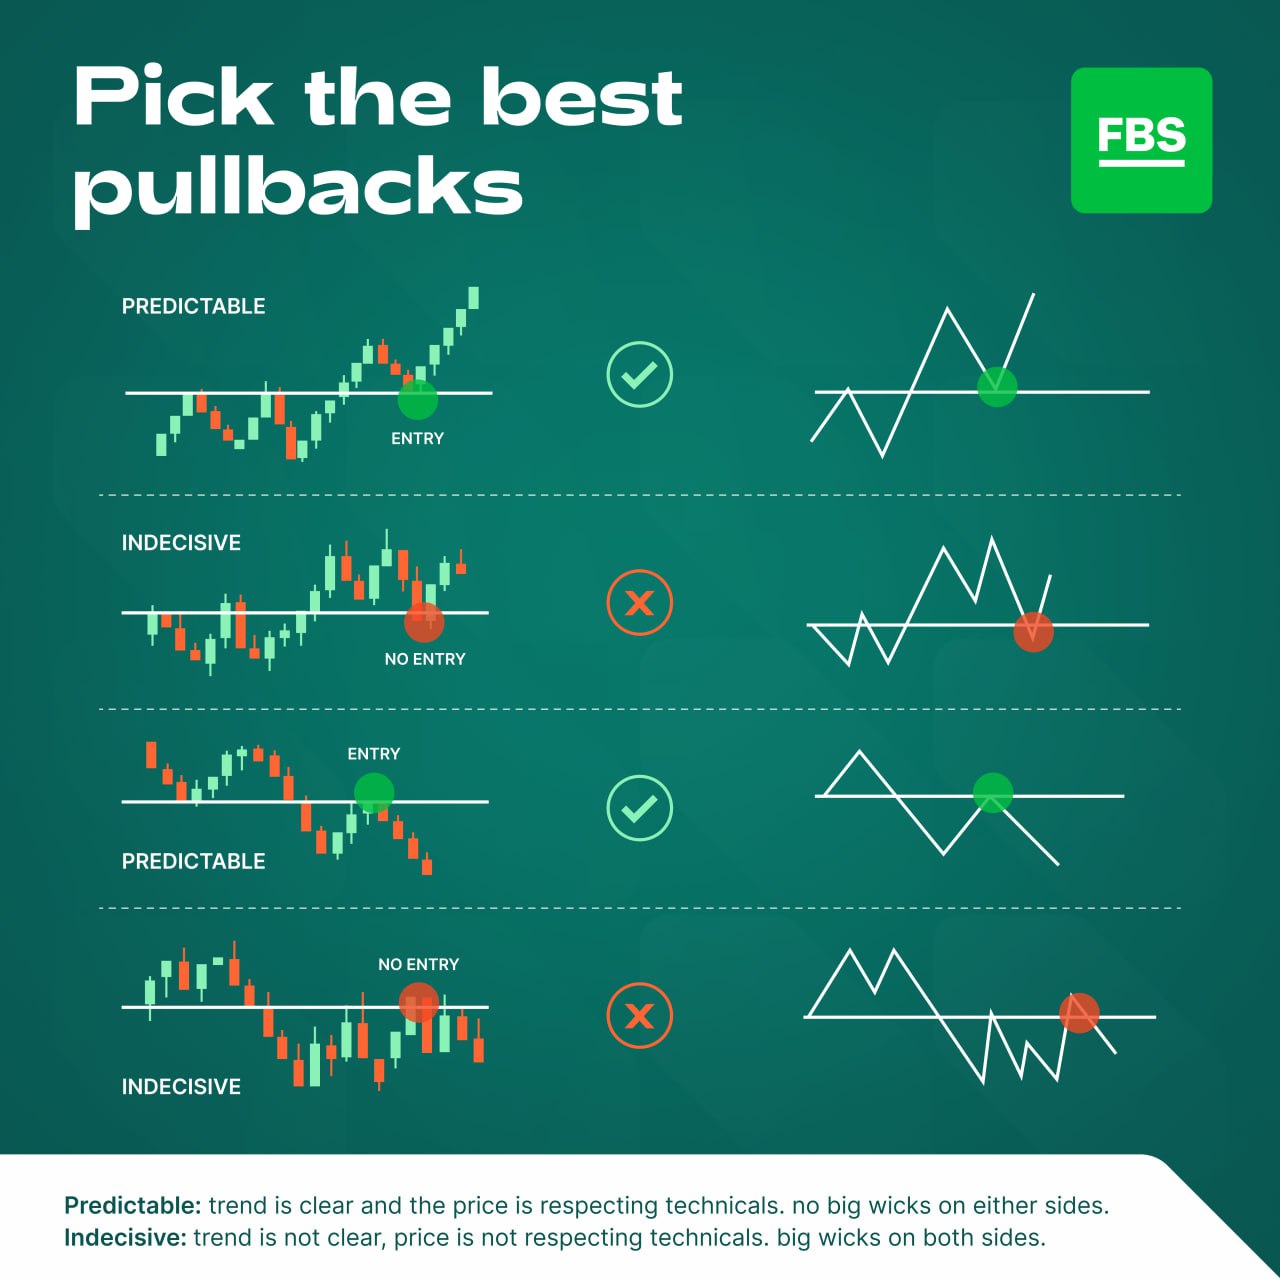
📈Pullback trading is a popular trading strategy used by traders to take advantage of temporary price reversals in a trend. Here are five steps to help you trade pullbacks like a pro:
Step 1: Identify the Trend
Use technical analysis tools like moving averages, trend lines, and chart patterns to determine whether the market is in an uptrend or a downtrend.
Step 2: Identify the Pullback
Once you've identified the trend, look for a pullback in the price. A pullback is a temporary retracement in the price of an asset, often caused by profit-taking or a change in market sentiment.
Step 3: Look for Support and Resistance Levels
After identifying the pullback, look for key support and resistance levels. These levels can be identified using technical analysis tools such as Fibonacci retracements, horizontal lines or trend lines.
Step 4: Enter the Trade
Once you've identified the pullback and support and resistance levels, it's time to enter the trade. The best time to enter a pullback trade is when the price retraces to a key support or resistance level and then bounces off that level. Look for a bullish or bearish candlestick pattern to confirm the entry point.
Step 5: Manage the Trade
Managing the trade is crucial in pullback trading. Set a stop loss order to limit your losses if the price moves against you, and take profit when the price reaches a key resistance or support level. If the price continues to move in your favor, consider trailing your stop loss order to lock in profits.
🙌By following these 5 steps, you can increase your chances of making profitable pullback trades. Remember to always manage your risk and trade with discipline.
Step 1: Identify the Trend
Use technical analysis tools like moving averages, trend lines, and chart patterns to determine whether the market is in an uptrend or a downtrend.
Step 2: Identify the Pullback
Once you've identified the trend, look for a pullback in the price. A pullback is a temporary retracement in the price of an asset, often caused by profit-taking or a change in market sentiment.
Step 3: Look for Support and Resistance Levels
After identifying the pullback, look for key support and resistance levels. These levels can be identified using technical analysis tools such as Fibonacci retracements, horizontal lines or trend lines.
Step 4: Enter the Trade
Once you've identified the pullback and support and resistance levels, it's time to enter the trade. The best time to enter a pullback trade is when the price retraces to a key support or resistance level and then bounces off that level. Look for a bullish or bearish candlestick pattern to confirm the entry point.
Step 5: Manage the Trade
Managing the trade is crucial in pullback trading. Set a stop loss order to limit your losses if the price moves against you, and take profit when the price reaches a key resistance or support level. If the price continues to move in your favor, consider trailing your stop loss order to lock in profits.
🙌By following these 5 steps, you can increase your chances of making profitable pullback trades. Remember to always manage your risk and trade with discipline.
👍92✍17❤10❤🔥10🔥10👌10🏆5😍4👏2🎉2💅2
We'll walk you through the dynamics of XAUUSD, and give tips on how to trade gold during crisis times.
Please open Telegram to view this post
VIEW IN TELEGRAM
YouTube
How to trade gold, part 2. A crash-course on trading gold during crises. XAUUSD trading strategy
Download the FBS Personal Area app:
Worldwide https://bit.ly/36qlgeC
Indonesia https://bit.ly/3qxOQFQ
Visit our website for more information: https://bit.ly/3vIzmR1
Follow us on social media:
Facebook https://bit.ly/3ELXjLm
Instagram https://bit.ly/3gO8lYW…
Worldwide https://bit.ly/36qlgeC
Indonesia https://bit.ly/3qxOQFQ
Visit our website for more information: https://bit.ly/3vIzmR1
Follow us on social media:
Facebook https://bit.ly/3ELXjLm
Instagram https://bit.ly/3gO8lYW…
❤🔥23👍11❤10👎3👏3🏆2💯1