
🇦🇺🇺🇸#AUDUSD
🔥 Key moment for AUDUSD!
The price broke above the 100-period MA on the H4 timeframe and the 0.6690 level. Currently, the pair is retesting this level.
🔼 If buyers hold the price above this level, AUDUSD will move to 0.6762.
🔽 On the contrary, the price loses 0.6690, it will move toward the 0.6640.
Are you bullish or bearish on USD in the short term?
✅TRADE WITH FBS✅
The price broke above the 100-period MA on the H4 timeframe and the 0.6690 level. Currently, the pair is retesting this level.
Are you bullish or bearish on USD in the short term?
✅TRADE WITH FBS✅
Please open Telegram to view this post
VIEW IN TELEGRAM
🔥30👍29❤9👎4
🎉Weekends are coming, guys. Time to choose the film to watch🎬. Here is one story that we’d like to tell you
🔥Nick Leeson's story is one of the most popular in today's financial world. In 1995, 🏦Barings Bank, which had existed since 1762, was driven into bankruptcy by the actions of just one man😱
💲Nick Leeson, a Singapore trader for the bank, was trading futures on the Japanese Nikkei Index🇯🇵. The operations were a mixed success, but the losses multiplied over time. For a long time, Leeson concealed this from his superiors and, even more so, allegedly showed enormous profits📈.
To hide the losses, Leeson created a fictitious error account, 88888, which reflected the negative result📉.
🚀By the end of 1992, Leeson's losses exceeded 2 million pounds; by 1994, they increased 100 times, reaching 208 million pounds🙀.
🔻Leeson used the Martingale strategy, doubling for every negative result. Funny, but the same Martingale strategy was used by Jérôme Kerviel, who led the bank Société Générale to losses of 50 billion euros in 2007🔻.
📈In the meantime, Leeson even recovered at some point, but his vanity and desire to be a "genius trader" led him back to the path of financial fraud💣.
When the whole thing came to light in 1995, it was found out that the bank could not cover double the cost of its capital, and the only option was to bankrupt it. The bank was bought by a financial group from the Netherlands for one pound sterling.
Leeson fled, was arrested in Germany👮, and extradited to Singapore, where he spent four years in prison. In 1996 he published the book📕Rogue Trader, from which the Ewan McGregor movie 🎬of the same name was released in 1999.
This is a great movie to watch this weekend. 🔥Don't miss it🔥
🔥Nick Leeson's story is one of the most popular in today's financial world. In 1995, 🏦Barings Bank, which had existed since 1762, was driven into bankruptcy by the actions of just one man😱
💲Nick Leeson, a Singapore trader for the bank, was trading futures on the Japanese Nikkei Index🇯🇵. The operations were a mixed success, but the losses multiplied over time. For a long time, Leeson concealed this from his superiors and, even more so, allegedly showed enormous profits📈.
To hide the losses, Leeson created a fictitious error account, 88888, which reflected the negative result📉.
🚀By the end of 1992, Leeson's losses exceeded 2 million pounds; by 1994, they increased 100 times, reaching 208 million pounds🙀.
🔻Leeson used the Martingale strategy, doubling for every negative result. Funny, but the same Martingale strategy was used by Jérôme Kerviel, who led the bank Société Générale to losses of 50 billion euros in 2007🔻.
📈In the meantime, Leeson even recovered at some point, but his vanity and desire to be a "genius trader" led him back to the path of financial fraud💣.
When the whole thing came to light in 1995, it was found out that the bank could not cover double the cost of its capital, and the only option was to bankrupt it. The bank was bought by a financial group from the Netherlands for one pound sterling.
Leeson fled, was arrested in Germany👮, and extradited to Singapore, where he spent four years in prison. In 1996 he published the book📕Rogue Trader, from which the Ewan McGregor movie 🎬of the same name was released in 1999.
This is a great movie to watch this weekend. 🔥Don't miss it🔥

👍70❤24🏆8❤🔥6🔥5✍4🐳3💔3
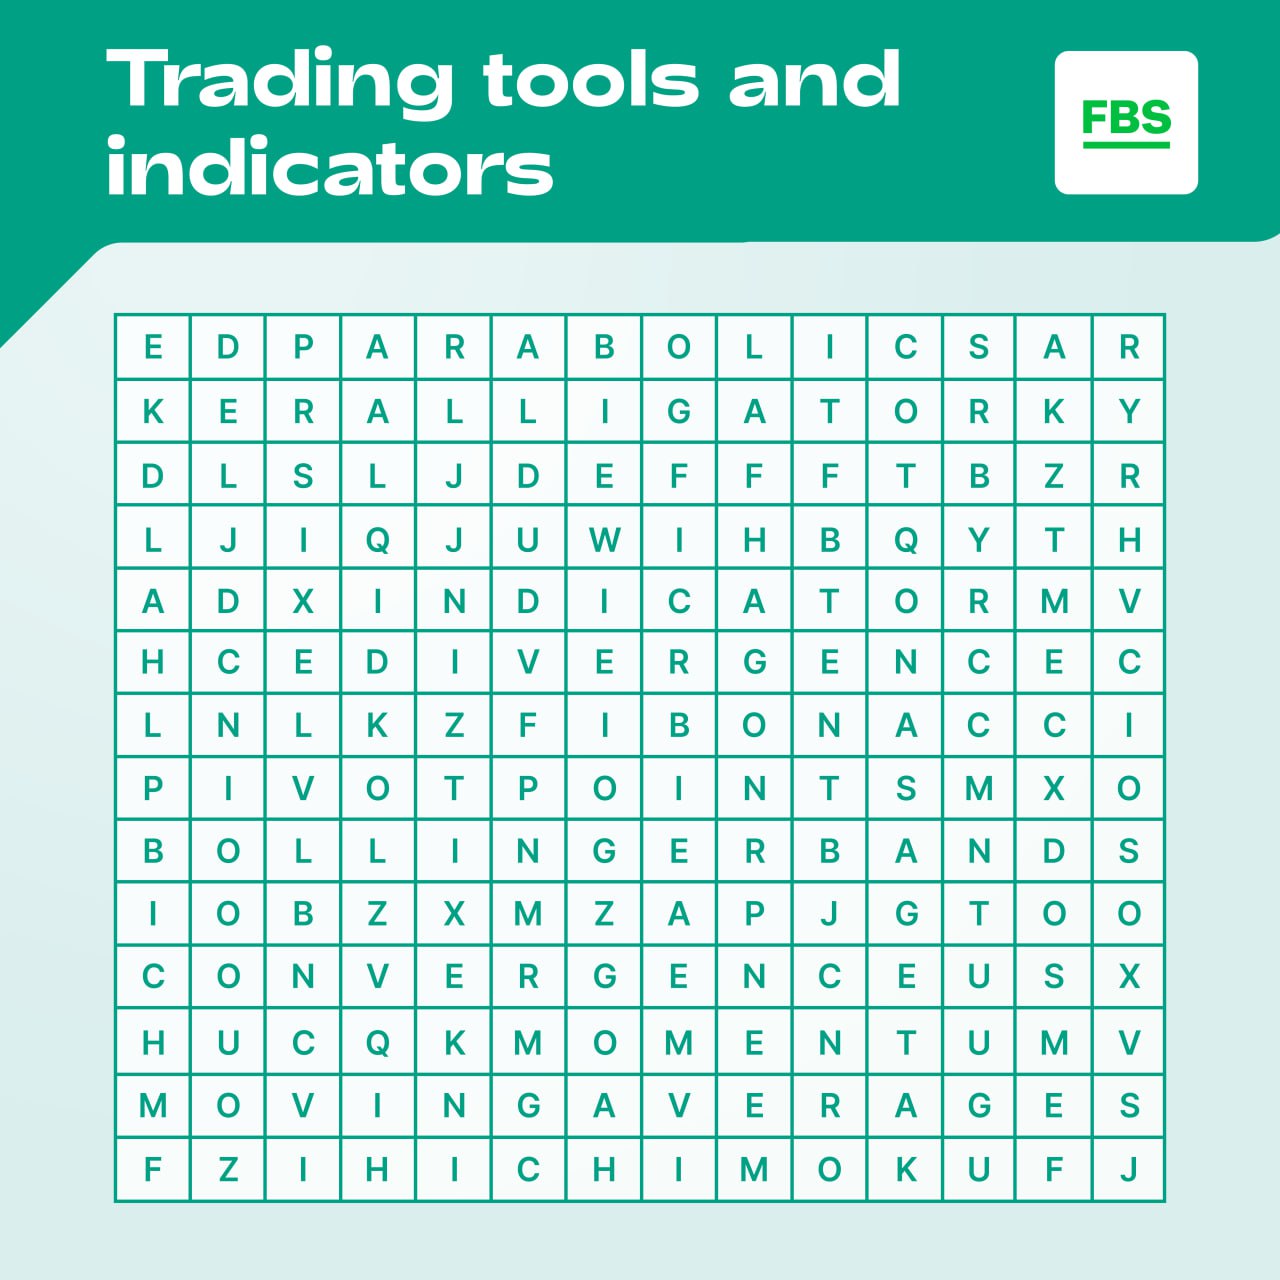
☀️Saturday is a great time to take a rest after a trading week! Let’s play a little game!✨
We hid 10 "Trading tools and indicators" words in this word search. Can you find them all?👀
Share your results in the comments! ⬇️
We hid 10 "Trading tools and indicators" words in this word search. Can you find them all?👀
Share your results in the comments! ⬇️
👍50✍18❤8❤🔥6👎1
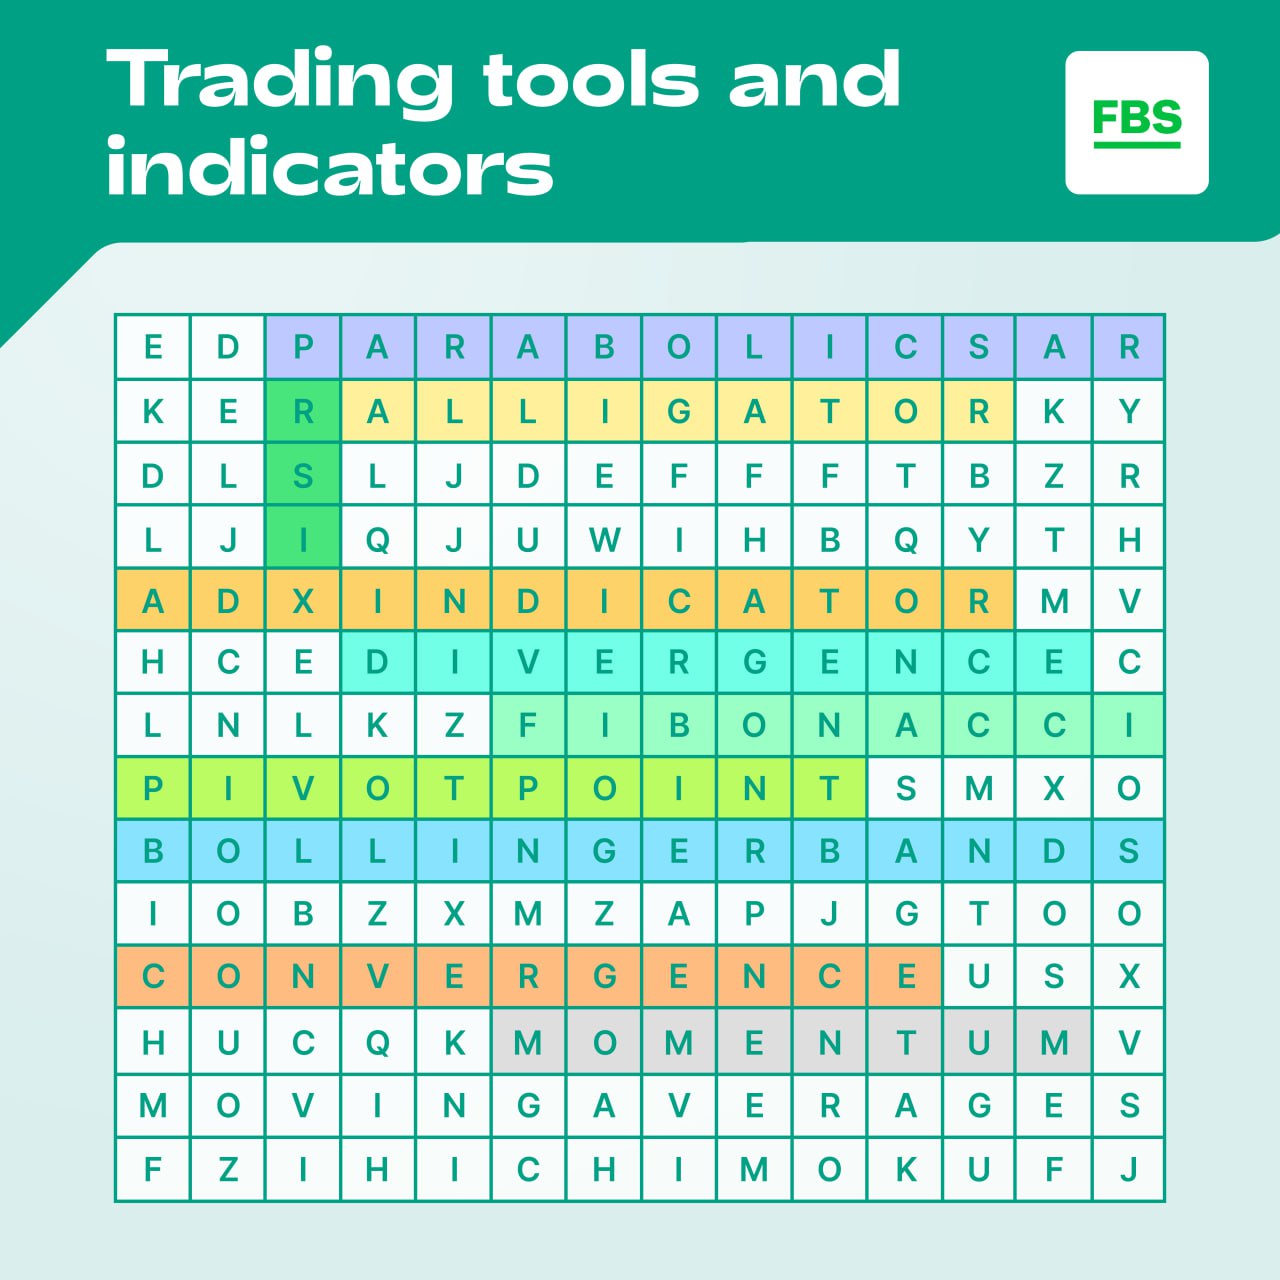
☀️Great job, FBS community! We hope you could find them all! Thanks for participation!
Here are the answers 👇
Here are the answers 👇
👍20❤2🔥2👎1
#education
Japanese Candles vs. Heiken Ashi
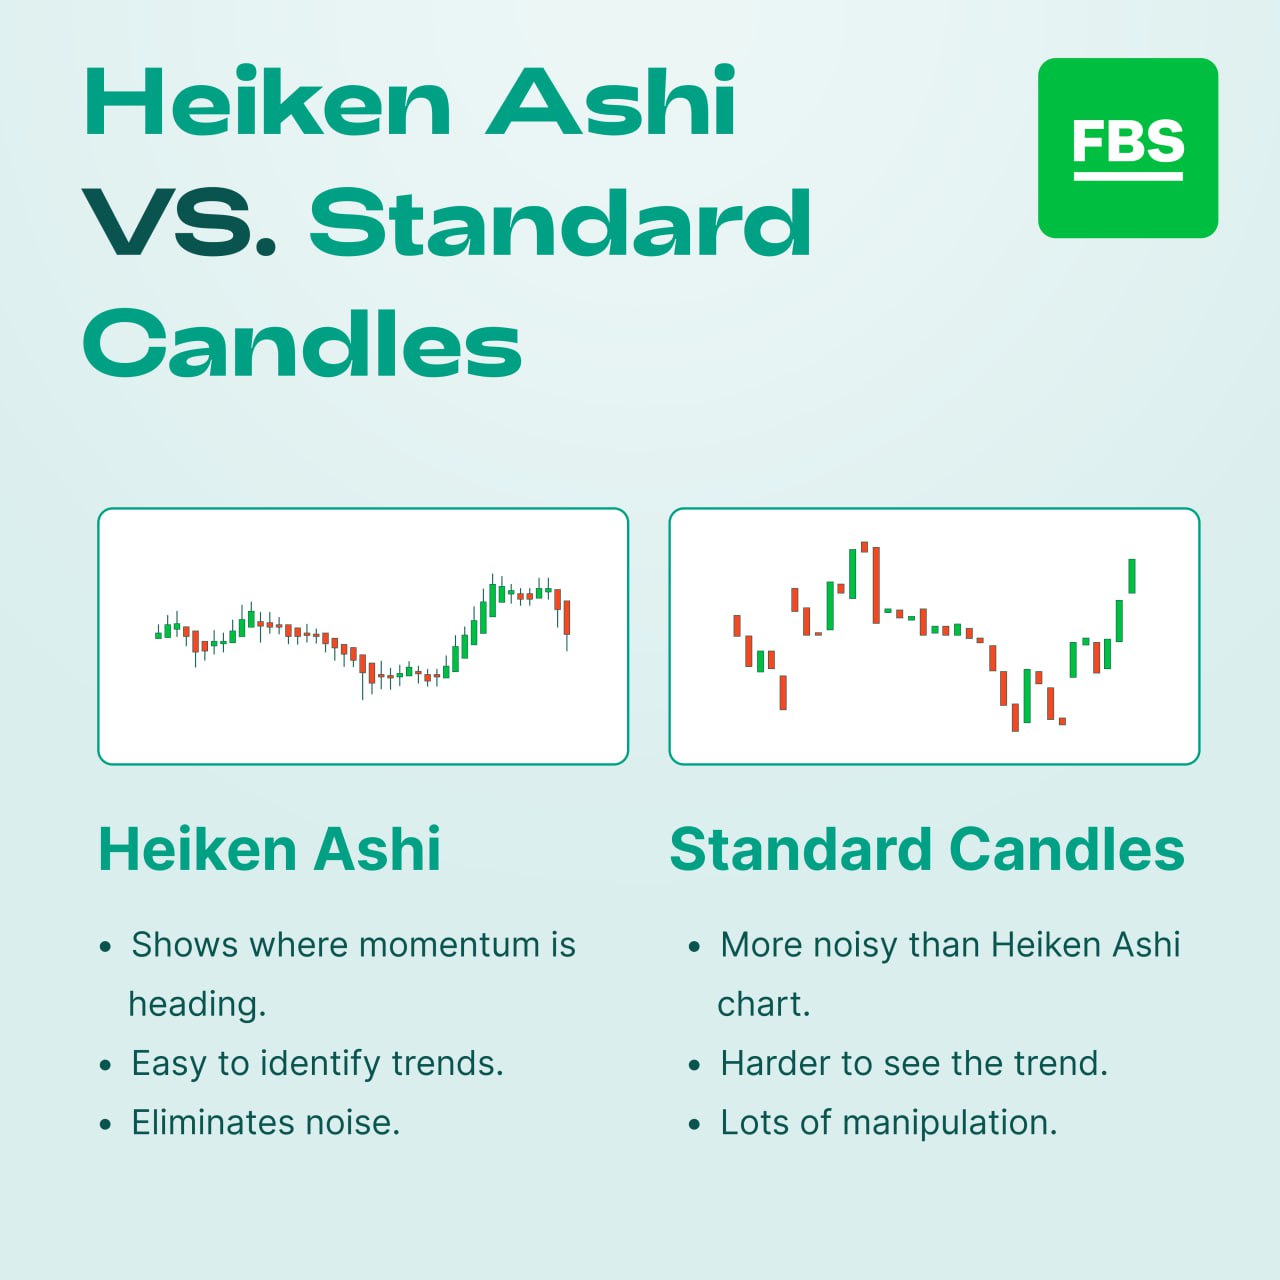
📈 Japanese Candlesticks are the most commonly used charting method. They show the open, high, low, and close of a trading session. This type of chart is great for determining patterns and identifying potential trends.
📉 Heiken Ashi charts are similar, but they use a modified formula to calculate price. This means that they filter out some of the market noise and can make it easier to identify trends.
📍 Both types of charts have their pros and cons, and it's up to you to decide which method works the best. Ultimately, the goal is to find a charting style that helps you in trading without relying solely on one type of analysis.
💚Find our comparison in the figure and share it with your friends!
💭Do you use Heiken Ashi?
Japanese Candles vs. Heiken Ashi
📈 Japanese Candlesticks are the most commonly used charting method. They show the open, high, low, and close of a trading session. This type of chart is great for determining patterns and identifying potential trends.
📉 Heiken Ashi charts are similar, but they use a modified formula to calculate price. This means that they filter out some of the market noise and can make it easier to identify trends.
📍 Both types of charts have their pros and cons, and it's up to you to decide which method works the best. Ultimately, the goal is to find a charting style that helps you in trading without relying solely on one type of analysis.
💚Find our comparison in the figure and share it with your friends!
💭Do you use Heiken Ashi?
👍58❤19❤🔥11✍7👏4🐳2
#MarketNews
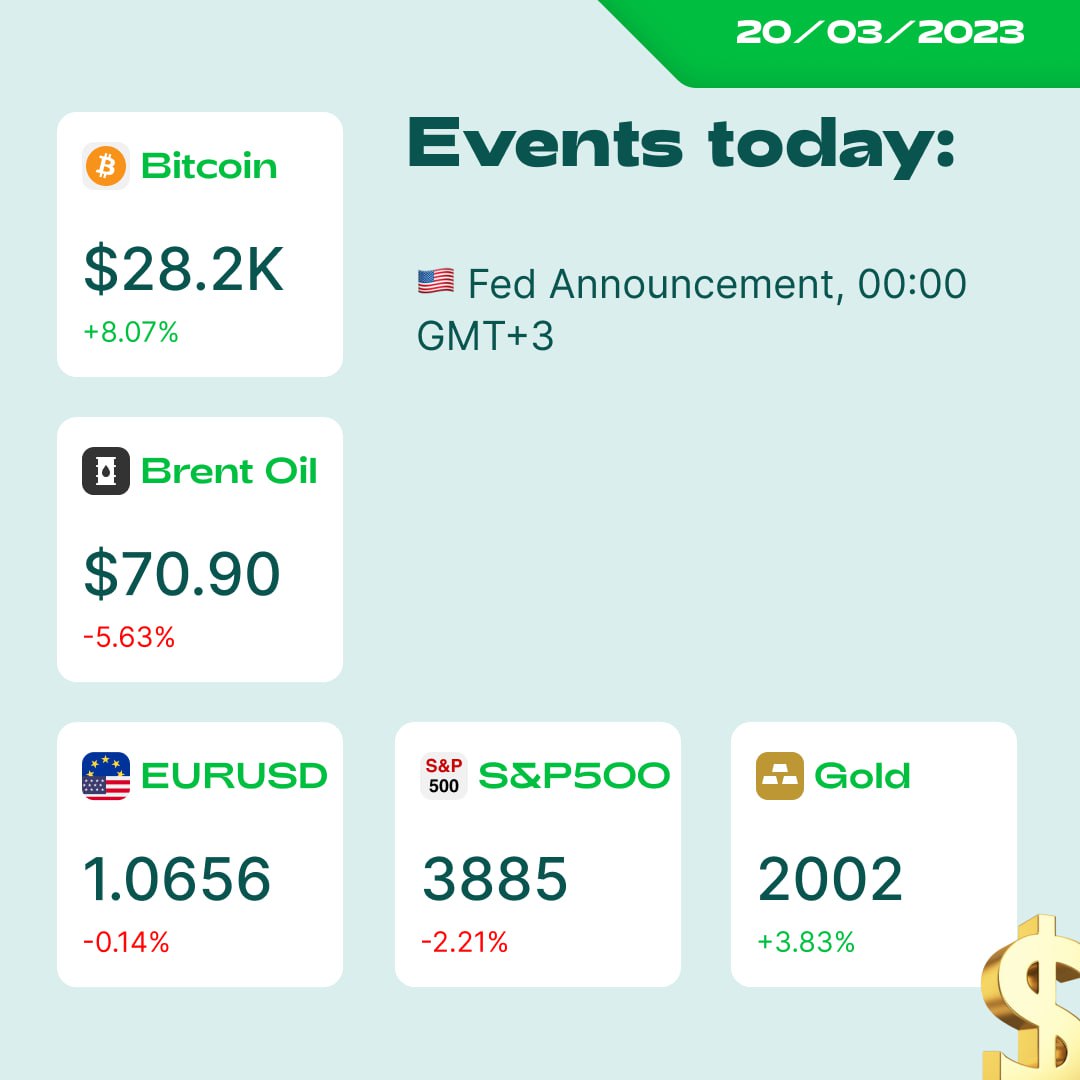
☀️ Happy Monday, traders! We hope you had some rest and are ready to rock the markets! Here’s what will wait for you this week and especially today:
⚠️ Note: the US switched their clocks; now, all times are given in GMT+3. You can look at what time zone you are in here.
1️⃣ Monday:
Fed Announcement, more about it in the news section
2️⃣ Tuesday:
03:30, Australia Monetary Policy Meeting Minutes
15:30, Canadian CPI
15:30, ECB President Lagarde Speaks
17:00, US Existing Home Sales
3️⃣ Wednesday:
10:00, UK CPI
11:45, ECB President Lagarde Speaks
21:00, US Federal Funds Rate
21:30, FOMC Press Conference
4️⃣ Thursday:
11:30, SNB Monetary Policy Assessment and Policy Rate
15:00, UK Monetary Policy Summary and Bank Rate
15:30, US Unemployment Claims
5️⃣ Friday:
02:30, Japan National Core CPI
11:30, German Flash Manufacturing and Services PMI
12:30, UK Flash Manufacturing and Services PMI
16:45, US Flash Manufacturing and Services PMI
📰 Daily news to keep you informed!
🏦 The biggest banks agreed to use USD liquidity swap line arrangements. In simple terms: the Fed and other banks got so scared of the current bank crisis they allowed faster money printing and delivery.
💸 Since March 11, Bitcoin has risen by 43.5%, reaching the highest point in nine months. The $28-32K resistance will be tough to overcome.
🇪🇺 The ECB said it would increase the rate as much as needed to fight inflation.
💹 UBS bank agrees to buy Credit Suisse (CS) for more than $3 billion. UBS also gets a cheap loan and extra coverage from the SNB. The bank crisis in Swiss is delayed.
😳 In a new study, economists said they found 186 banks prone to risks similar to the SVB, CS, and First Republic Bank (FRB).
🇩🇪 German industrial PPI increased by 15.8% compared to February 2022. In January 2023, the increase had been +17.6%.
🏆 Gold is skyrocketing, making the last week the greenest in two years! If the metal overcomes the resistance of $2000 and closes the day above it, it may go to the ATH. Are you in gold today?
💚Happy trading!
☀️ Happy Monday, traders! We hope you had some rest and are ready to rock the markets! Here’s what will wait for you this week and especially today:
⚠️ Note: the US switched their clocks; now, all times are given in GMT+3. You can look at what time zone you are in here.
1️⃣ Monday:
Fed Announcement, more about it in the news section
2️⃣ Tuesday:
03:30, Australia Monetary Policy Meeting Minutes
15:30, Canadian CPI
15:30, ECB President Lagarde Speaks
17:00, US Existing Home Sales
3️⃣ Wednesday:
10:00, UK CPI
11:45, ECB President Lagarde Speaks
21:00, US Federal Funds Rate
21:30, FOMC Press Conference
4️⃣ Thursday:
11:30, SNB Monetary Policy Assessment and Policy Rate
15:00, UK Monetary Policy Summary and Bank Rate
15:30, US Unemployment Claims
5️⃣ Friday:
02:30, Japan National Core CPI
11:30, German Flash Manufacturing and Services PMI
12:30, UK Flash Manufacturing and Services PMI
16:45, US Flash Manufacturing and Services PMI
📰 Daily news to keep you informed!
🏦 The biggest banks agreed to use USD liquidity swap line arrangements. In simple terms: the Fed and other banks got so scared of the current bank crisis they allowed faster money printing and delivery.
💸 Since March 11, Bitcoin has risen by 43.5%, reaching the highest point in nine months. The $28-32K resistance will be tough to overcome.
🇪🇺 The ECB said it would increase the rate as much as needed to fight inflation.
💹 UBS bank agrees to buy Credit Suisse (CS) for more than $3 billion. UBS also gets a cheap loan and extra coverage from the SNB. The bank crisis in Swiss is delayed.
😳 In a new study, economists said they found 186 banks prone to risks similar to the SVB, CS, and First Republic Bank (FRB).
🇩🇪 German industrial PPI increased by 15.8% compared to February 2022. In January 2023, the increase had been +17.6%.
🏆 Gold is skyrocketing, making the last week the greenest in two years! If the metal overcomes the resistance of $2000 and closes the day above it, it may go to the ATH. Are you in gold today?
💚Happy trading!
👍45❤11❤🔥5🔥5😍4🥱1
🛢#XBRUSD
🔥Oil price is too low!
The price approached the level of 69.30. If we look at the higher Weekly Time frame price, XBRUSD is on MA200 (strong support line).
📈The price may start bouncing back!
In case of the reversal, XBRUSD may try to reach a 23.6% Fibo level ($74.00).
🔼Trade: Buy XBRUSD
🎯TP: 72.30; 74
❌SL: Below the recent low
✅TRADE WITH FBS✅
🔥Oil price is too low!
The price approached the level of 69.30. If we look at the higher Weekly Time frame price, XBRUSD is on MA200 (strong support line).
📈The price may start bouncing back!
In case of the reversal, XBRUSD may try to reach a 23.6% Fibo level ($74.00).
🔼Trade: Buy XBRUSD
🎯TP: 72.30; 74
❌SL: Below the recent low
✅TRADE WITH FBS✅
👍25❤6🔥6👏3🥱2🏆1
🇦🇺🇺🇸 #AUDUSD
🔥 AUDUSD is looking bullish!
The pair is bouncing off the 100-hour moving average. Moreover, the US dollar index is looking quite bearish. Thus, we expect AUDUSD to move higher toward the resistance zone.
🔼 Trade: Buy AUDUSD
🎯TP: 0.6707, 0.6715
Do you agree?
✅TRADE WITH FBS✅
The pair is bouncing off the 100-hour moving average. Moreover, the US dollar index is looking quite bearish. Thus, we expect AUDUSD to move higher toward the resistance zone.
🎯TP: 0.6707, 0.6715
Do you agree?
✅TRADE WITH FBS✅
Please open Telegram to view this post
VIEW IN TELEGRAM
👍35❤12🔥11🏆4
🇬🇧🇺🇸#GBPUSD
🔥 GBPUSD might reverse in short term!
The price reached the resistance level of 1.2260 with the RSI close to overbought area. Thus, we might expect a reversal from this level.
🔽 Trade: Sell GBPUSD
🎯TP: 1.2210, 1.2136
❌SL: above the recent high
What do you think?
✅TRADE WITH FBS✅
The price reached the resistance level of 1.2260 with the RSI close to overbought area. Thus, we might expect a reversal from this level.
🎯TP: 1.2210, 1.2136
❌SL: above the recent high
What do you think?
✅TRADE WITH FBS✅
Please open Telegram to view this post
VIEW IN TELEGRAM
👍72🥴13❤11❤🔥8🔥8🐳7😐2
🎉Hey-hey, are you okay? Tuesday is here, and essential news is here as well.
🇪🇺European Trade Balance dropped to -30.6B in January – September, and October 2022 levels. Meanwhile, EURUSD bounced back from 200MA and rose. The focus is moved to Wednesday’s Fed meeting, and the market is trying to adjust the price, guessing what the Fed will say.
🇪🇺ECB’s Lagarde: ‘The ECB is ready to act to support the banking and financial sector’ then ‘The ECB toolkit allows us to provide liquidity, if necessary’ and ‘the banking system is strong.’
🛢Goldman Sachs downgraded the Brent oil price from $100 to $94 during the following twelve months. Meanwhile, XBRUSD started a correction and almost reached a 23.6% Fibo correction level ($74). Do you trade XBPUSD, guys? Up or Down?
🇦🇺Australian RBA Meeting minutes: ‘Further rate hikes are needed, inflation is still high’ and ‘Australia's rates are lower than in some other countries, which may affect the AUD.’ AUDUSD started moving to 200MA on the daily Time frame. The target is 0.67600.
🇩🇪ZEW Economic Sentiment in Germany is expected at 13:00 GMT+3. The higher – the better for EURUSD. Economists forecast that sentiment will be 17.1 points in March, lower than a month ago.
🇨🇦Canadian inflation (CPI) is published at 15:30 GMT+3. We strongly recommend paying attention to Core CPI. The higher the inflation level – the stronger will be the Canadian dollar.
🏘Existing home sales are published in the US at 17:00 GMT+3. Usually, if new home sales rise, existing home sale increase as well, but there is a 1-2 month lag. The situation with the new home sales was good in January (+670K), so we may expect good numbers.
🔥BTCUSD moves in flat. The support level is $26500, while the resistance line is $ 28400. What are your trading ideas here, guys?
🥇XAUUSD seems to form some spinning top candlestick pattern on the daily time frame. It means that correction may occur. The support level is $1960. Do you agree with this analysis?
❤️if you like, share your trading experience and your trading ideas🤔. See you soon
🇪🇺European Trade Balance dropped to -30.6B in January – September, and October 2022 levels. Meanwhile, EURUSD bounced back from 200MA and rose. The focus is moved to Wednesday’s Fed meeting, and the market is trying to adjust the price, guessing what the Fed will say.
🇪🇺ECB’s Lagarde: ‘The ECB is ready to act to support the banking and financial sector’ then ‘The ECB toolkit allows us to provide liquidity, if necessary’ and ‘the banking system is strong.’
🛢Goldman Sachs downgraded the Brent oil price from $100 to $94 during the following twelve months. Meanwhile, XBRUSD started a correction and almost reached a 23.6% Fibo correction level ($74). Do you trade XBPUSD, guys? Up or Down?
🇦🇺Australian RBA Meeting minutes: ‘Further rate hikes are needed, inflation is still high’ and ‘Australia's rates are lower than in some other countries, which may affect the AUD.’ AUDUSD started moving to 200MA on the daily Time frame. The target is 0.67600.
🇩🇪ZEW Economic Sentiment in Germany is expected at 13:00 GMT+3. The higher – the better for EURUSD. Economists forecast that sentiment will be 17.1 points in March, lower than a month ago.
🇨🇦Canadian inflation (CPI) is published at 15:30 GMT+3. We strongly recommend paying attention to Core CPI. The higher the inflation level – the stronger will be the Canadian dollar.
🏘Existing home sales are published in the US at 17:00 GMT+3. Usually, if new home sales rise, existing home sale increase as well, but there is a 1-2 month lag. The situation with the new home sales was good in January (+670K), so we may expect good numbers.
🔥BTCUSD moves in flat. The support level is $26500, while the resistance line is $ 28400. What are your trading ideas here, guys?
🥇XAUUSD seems to form some spinning top candlestick pattern on the daily time frame. It means that correction may occur. The support level is $1960. Do you agree with this analysis?
❤️if you like, share your trading experience and your trading ideas🤔. See you soon

👍28❤🔥7❤5🐳2🔥1
The US dollar index broke below the recent low of 103.50. Moreover, the price is still moving under the resistance trend line.
👆Thus, we suggest you look for sell opportunities in USD*** pairs, and for buy opportunities ***USD pairs. The US dollar index might lose around 0.6% in the following days.
What are you trading today?
✅TRADE WITH FBS✅
Please open Telegram to view this post
VIEW IN TELEGRAM
❤23👍10🔥5🐳5❤🔥1😍1🏆1
#Allianz SE
🔥Allianz stocks are returning back
✨The chart formed the morning star pattern and closed the gap from March 20.
📈 The movement up may continue.
The nearest resistance level is 208.10, and then 211.90
🔼Trade: Buy ALV
🎯TP: 208.10; 211.90
❌SL: Below the recent low
Do you trade stocks, guys?🧐
✅TRADE WITH FBS✅
🔥Allianz stocks are returning back
✨The chart formed the morning star pattern and closed the gap from March 20.
📈 The movement up may continue.
The nearest resistance level is 208.10, and then 211.90
🔼Trade: Buy ALV
🎯TP: 208.10; 211.90
❌SL: Below the recent low
Do you trade stocks, guys?🧐
✅TRADE WITH FBS✅
❤21👍14✍3🔥3😁3👎2
🇺🇸🇯🇵#USDJPY
🔥 USDJPY might break out soon!
The price is consolidating under the resistance trendline. If the price rises above 132.55, you might consider opening a buy trade.
🔼 Trade: Buy USDJPY on 132.55 breakout
🎯TP: 133.60
Do you agree?
✅TRADE WITH FBS✅
The price is consolidating under the resistance trendline. If the price rises above 132.55, you might consider opening a buy trade.
🎯TP: 133.60
Do you agree?
✅TRADE WITH FBS✅
Please open Telegram to view this post
VIEW IN TELEGRAM
👍59❤13👎9🔥5💘5🤣3
😎 Emotions influence our lives. In trading, emotions and the ability to deal with them can be crucial as trading involves money. No one wants to lose money.
Sometimes even experienced and skillful traders fail to control their emotions and pay for it. What are typical emotions that might leave us without anything? How to deal with these emotions. Swipe the cards to find out ☝️
Sometimes even experienced and skillful traders fail to control their emotions and pay for it. What are typical emotions that might leave us without anything? How to deal with these emotions. Swipe the cards to find out ☝️
❤96👍51👎7🔥7✍6❤🔥6💯6🐳4😁3😍3👌2