
#education
🔥Hello, dears!
Today we’ll speak about the Fan Principle in trading.
The concept is quite simple to learn🎉
How do you know that the trend changed? 🧐
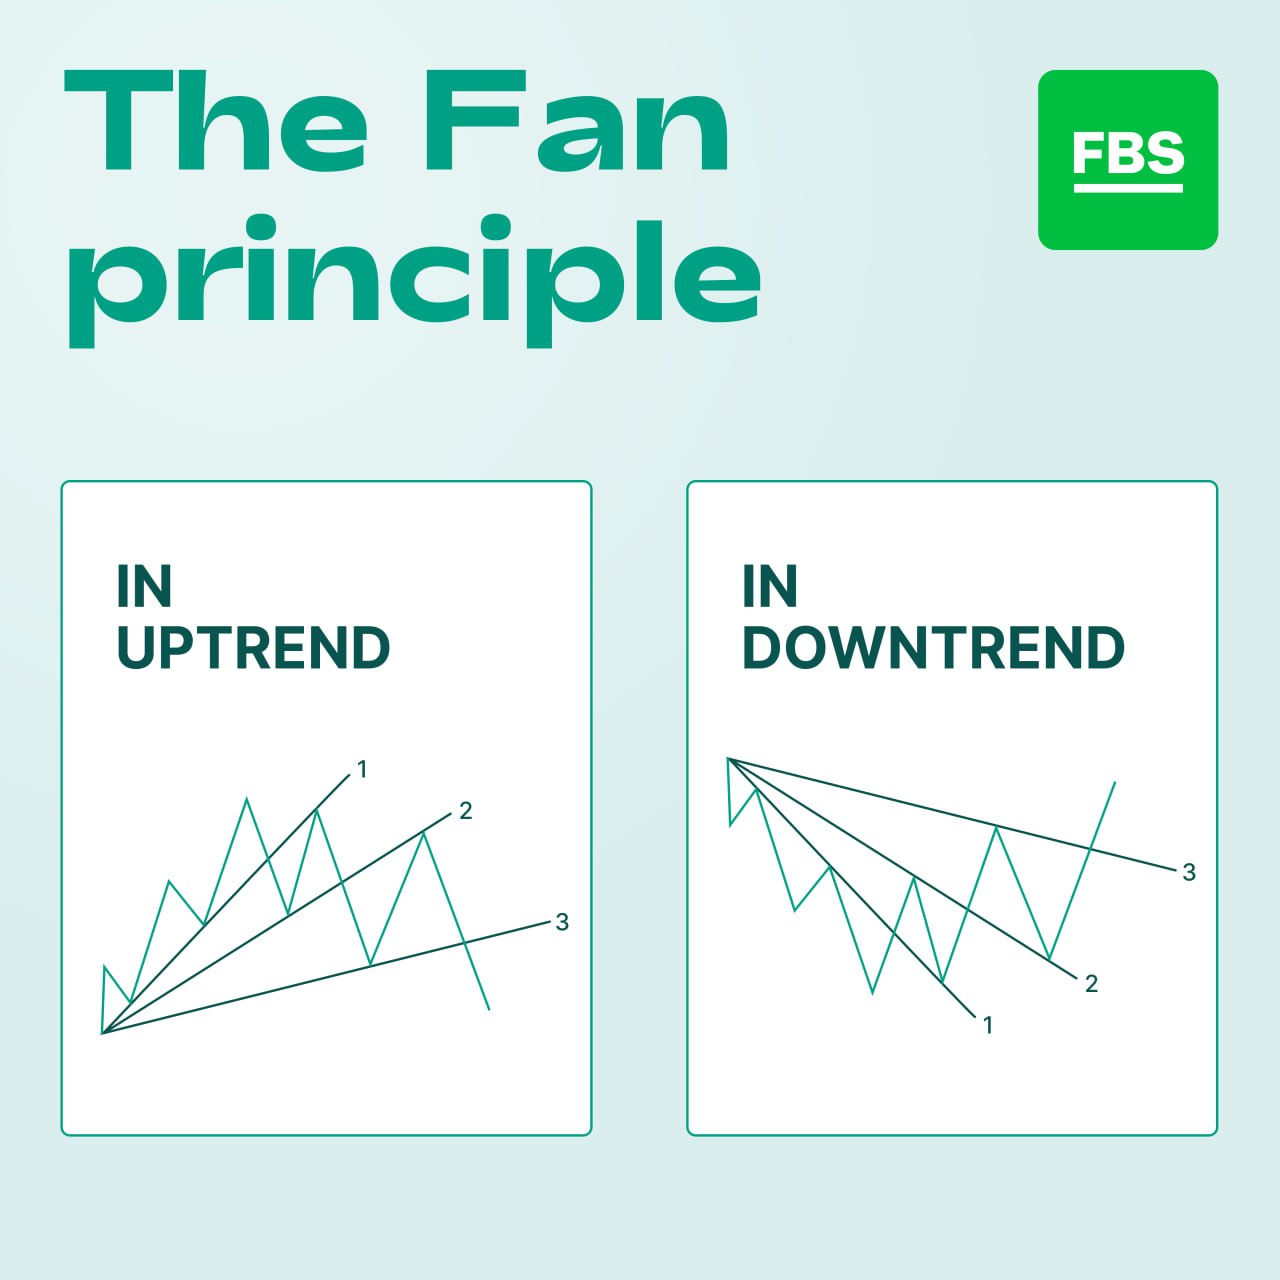
According to John Murphy, the trend changes if the price breaks three trend lines
The price should break three ascending trend lines if the trend is bullish and changes into bearish.📉
If the trend is bearish and changes into bullish, it should break three descending trend lines.📈
Check the picture, guys, and good luck on the market!🚀
✅TRADE WITH FBS ✅
🔥Hello, dears!
Today we’ll speak about the Fan Principle in trading.
The concept is quite simple to learn🎉
How do you know that the trend changed? 🧐
According to John Murphy, the trend changes if the price breaks three trend lines
The price should break three ascending trend lines if the trend is bullish and changes into bearish.📉
If the trend is bearish and changes into bullish, it should break three descending trend lines.📈
Check the picture, guys, and good luck on the market!🚀
✅TRADE WITH FBS ✅
👍76❤21❤🔥7✍6⚡4
The price broke below the support trendline and retested it from the downside. Now, the primary target for the decline is 1973.00.
If the price breaks below 1973.00, it will slide to 1951.00 (red scenario).
However, before that, another retest of the trendline might happen at 2005.00 (blue scenario).
🎯Targets: 1973.00, 1951.00
Share your analysis in the comments!
@fbsanalytics
Please open Telegram to view this post
VIEW IN TELEGRAM
❤49👍32🔥13❤🔥12💯5😁3😍3🐳3✍2
#MarketNews
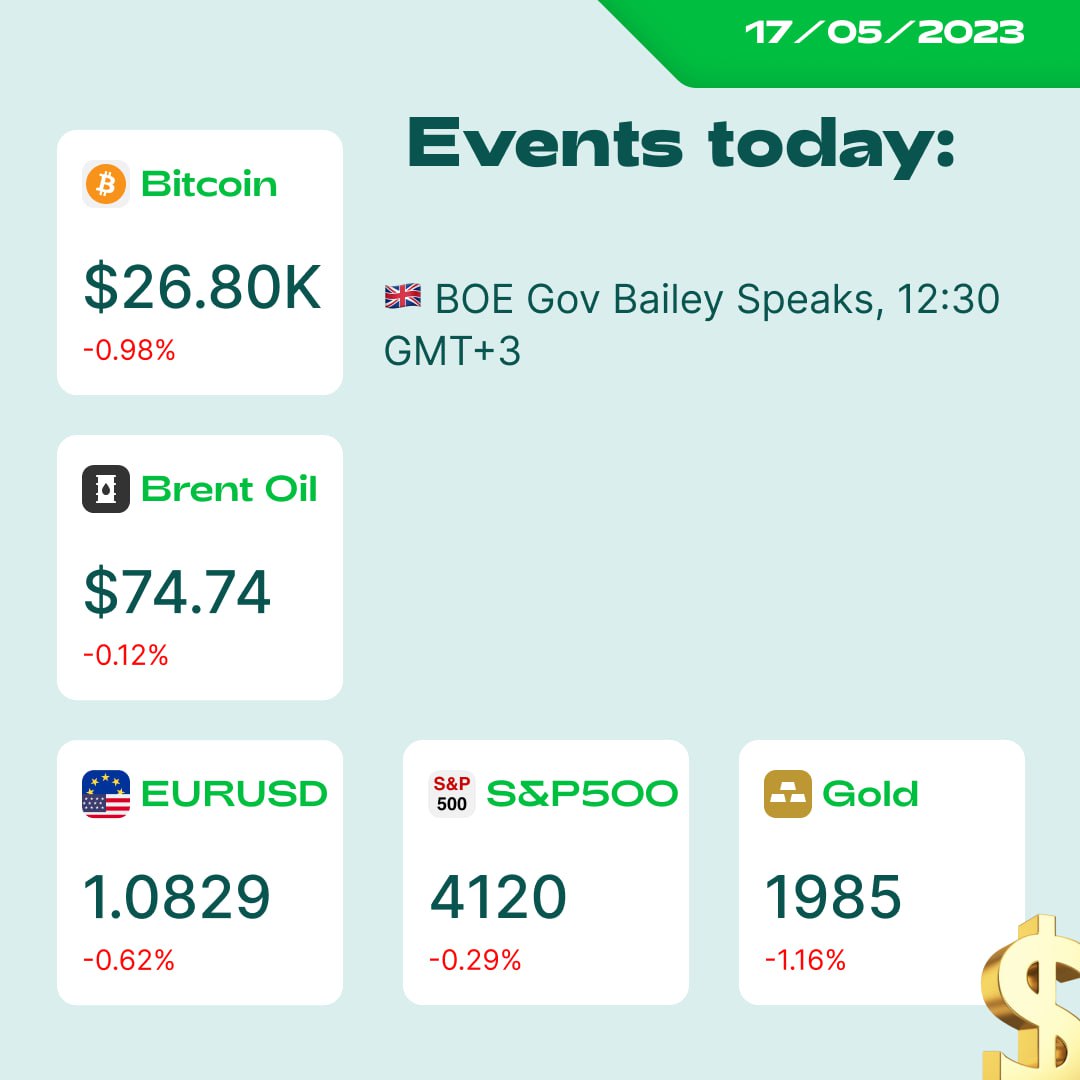
🐸 It’s Wednesday, the froggy day for the whole internet. Here’s news that moves the market:
🇦🇷 Argentina’s Central Bank raises interest rates to 97% in an attempt to control soaring inflation.
🇺🇸 In the US, Texas introduces a bill to ban central bank digital currency (CBDCs) in the state. Also, Florida State Governor officially bans CBDCs.
🏦 Elon Musk says Twitter plans to create a more efficient financial system than traditional banking.
🚗 Tesla said to have “Two new products” to unveil. Also, the company will “try a little advertising and see how it goes.”
🌐 Bill Ackman, one of the most famous investors, has accumulated Google stocks throughout the previous quarter. Overall he now has $1.2 billion worth of stock. Keep an eye on the tech industry.
🇦🇺 The Australian Wage Price Index is below expectations (0.8% vs. 0.9%).
🇨🇦 Canada monthly CPI exceeded expectations (0.7% vs. 0.5%). AUDCAD fell 480 points.
💎 Our daily trade idea is waiting for you:
➡️ https://bit.ly/41LDFsK
💚Happy trading!
🐸 It’s Wednesday, the froggy day for the whole internet. Here’s news that moves the market:
🇦🇷 Argentina’s Central Bank raises interest rates to 97% in an attempt to control soaring inflation.
🇺🇸 In the US, Texas introduces a bill to ban central bank digital currency (CBDCs) in the state. Also, Florida State Governor officially bans CBDCs.
🏦 Elon Musk says Twitter plans to create a more efficient financial system than traditional banking.
🚗 Tesla said to have “Two new products” to unveil. Also, the company will “try a little advertising and see how it goes.”
🌐 Bill Ackman, one of the most famous investors, has accumulated Google stocks throughout the previous quarter. Overall he now has $1.2 billion worth of stock. Keep an eye on the tech industry.
🇦🇺 The Australian Wage Price Index is below expectations (0.8% vs. 0.9%).
🇨🇦 Canada monthly CPI exceeded expectations (0.7% vs. 0.5%). AUDCAD fell 480 points.
💎 Our daily trade idea is waiting for you:
➡️ https://bit.ly/41LDFsK
💚Happy trading!
❤23👍16❤🔥8🔥8🐳3✍1😍1🌚1
🔥AUDUSD is forming a piercing pattern!
The price started rising again. Williams %R left its oversold zone.
By the way there was a divergence between the indicator and the price.
The nearest resistance is 0.6674📈
🔼 Trade: Buy AUDUSD.
🎯Targets: 0.66740, 0.67010
Share your analysis in the comments!
➡️ TRADE WITH FBS
@fbsanalytics
The price started rising again. Williams %R left its oversold zone.
By the way there was a divergence between the indicator and the price.
The nearest resistance is 0.6674📈
🎯Targets: 0.66740, 0.67010
Share your analysis in the comments!
@fbsanalytics
Please open Telegram to view this post
VIEW IN TELEGRAM
👍33❤🔥9🔥7👎5❤4
What do you think about this?
@fbsanalytics
Please open Telegram to view this post
VIEW IN TELEGRAM
👍99💯19🔥16👎14🤔8🌚4🆒3✍2🕊2👀1👾1
#MarketNews
☀️ Happy Thursday, dear traders! Let's check what news is moving the markets today!
🇺🇸 The US federal government had a cash reserve of $143 billion. These funds should be enough due June 5.
😱 Jim Cramer (Mad Money host) said that the US would never face default. Because of his awful win rate in predictions, markets now expect the US default as something possible.
🐶 The number of daily transactions in the DOGE blockchain reached an all-time high. Usually, increased activity is followed by a price rise.
📈 The US stock market is on the rise. US500 is testing the 4170 resistance again. In case of a breakout, the price will move to 4300.
🇺🇸 🇯🇵 USDJPY broke above the 200-day moving average. If the price closes above 137.70, an uptrend may continue.
📉 CEO Goldman Sachs: “The US stock market will face a disaster if the US government doesn’t agree on the debt limit.”
💥 Considering current Treasury yield spreads, the chance of a recession is now nearly 99.3% - 100%.
➡️ Get XAUUSD analysis: https://bit.ly/3MCewMZ
Please open Telegram to view this post
VIEW IN TELEGRAM
👍37❤16🔥6🐳6✍1🆒1
We posted a Gold chart just a couple of minutes ago, so at least take a look.
Please open Telegram to view this post
VIEW IN TELEGRAM
Telegram
FBS Analytics
Do you know about FBS Twitter
Yes, I'm subscribed / Yes but I'm not subscribed / No and I don't want to subscribe / No but I want to subscribe / I don't have Twitter account
Yes, I'm subscribed / Yes but I'm not subscribed / No and I don't want to subscribe / No but I want to subscribe / I don't have Twitter account
👍29🔥8❤7👌2😍1
💥Voice chat with FBS analysts!💥
Join Adetola Freeman to discuss the markets right now!
Link: https://t.me/fbsanalytics?livestream
Join Adetola Freeman to discuss the markets right now!
Link: https://t.me/fbsanalytics?livestream
👍28❤7🔥4
Waiting for the possible short entry
@fbsanalytics
Please open Telegram to view this post
VIEW IN TELEGRAM
🔥36👍17❤🔥9❤4👎4🐳3😍1🆒1
Here is the demand zone on XAUUSD. Watching for a rejection from that zone with an initial target around 1987.
@fbsanalytics
Please open Telegram to view this post
VIEW IN TELEGRAM
👍58❤🔥55👎12❤9🔥9✍8👀3🏆2
#MarketNews
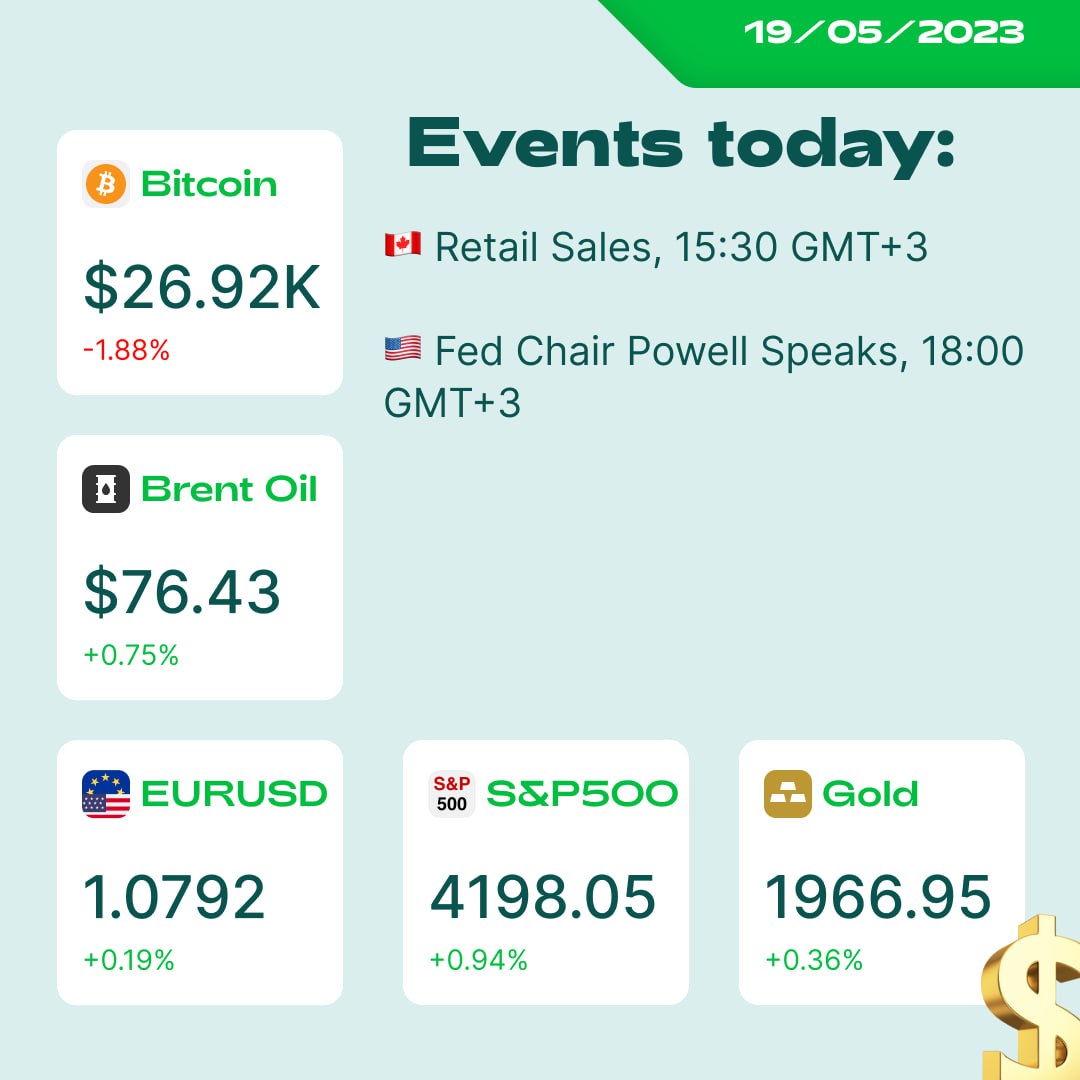
🎉The home straight of the week, guys! Happy Friday! Let’s check the latest news:
🇺🇸Initial Jobless Claims in the US released worse than the forecast, +242K vs. 254K. Continuing Jobless claims decreased too. The better the economic situation – the bigger the chance that the Fed won’t start reducing the rate soon. But we should estimate the situation in dynamics.
🇺🇸Existing Home Sales were released at 4.28M. There was a spike in February (sales jumped to +4.55M), but it started falling again.
🇳🇿New Zealand’s trade balance deficit was worse than in March (-16 800M vs. -16760M earlier) but overcame the forecast. On the daily time frame, NZDUSD is in the bearish trend, but the middle-term trend is bullish. Do you trade NZDUSD, dears? What are your ideas about this? Leave your comments below.👇
🇯🇵Inflation in Japan remained stable in April (+3.5%). Core CPI was released at +3.4%. This is relatively high for Japan, but BoJ still keeps following the soft monetary policy.
🇩🇪German PPI dropped to a 4.1% level compared with 6.7% in March. The fact was higher than the forecast, but the inflation is stabilizing.
🇺🇸S&P500 renewed the maximums on the news of the debt ceiling📈. US President Joe Biden said they will reach a deal soon to raise the federal government’s 31.4 trillion debt ceiling and avoid an economically catastrophic default.’ The index closed at 4198.06 points. EURUSD fell by 0.64%📉
🏆BTCUSD is in flat on the 4H time frame. The price is flirting with 100MA ($26300).
🥇XAUUSD fell by 1.2%. The price has almost touched the strong support level of $1950. Right now it’s bouncing back.
💚Happy trading day, dears!
🔥TRADE WITH FBS🔥
🎉The home straight of the week, guys! Happy Friday! Let’s check the latest news:
🇺🇸Initial Jobless Claims in the US released worse than the forecast, +242K vs. 254K. Continuing Jobless claims decreased too. The better the economic situation – the bigger the chance that the Fed won’t start reducing the rate soon. But we should estimate the situation in dynamics.
🇺🇸Existing Home Sales were released at 4.28M. There was a spike in February (sales jumped to +4.55M), but it started falling again.
🇳🇿New Zealand’s trade balance deficit was worse than in March (-16 800M vs. -16760M earlier) but overcame the forecast. On the daily time frame, NZDUSD is in the bearish trend, but the middle-term trend is bullish. Do you trade NZDUSD, dears? What are your ideas about this? Leave your comments below.👇
🇯🇵Inflation in Japan remained stable in April (+3.5%). Core CPI was released at +3.4%. This is relatively high for Japan, but BoJ still keeps following the soft monetary policy.
🇩🇪German PPI dropped to a 4.1% level compared with 6.7% in March. The fact was higher than the forecast, but the inflation is stabilizing.
🇺🇸S&P500 renewed the maximums on the news of the debt ceiling📈. US President Joe Biden said they will reach a deal soon to raise the federal government’s 31.4 trillion debt ceiling and avoid an economically catastrophic default.’ The index closed at 4198.06 points. EURUSD fell by 0.64%📉
🏆BTCUSD is in flat on the 4H time frame. The price is flirting with 100MA ($26300).
🥇XAUUSD fell by 1.2%. The price has almost touched the strong support level of $1950. Right now it’s bouncing back.
💚Happy trading day, dears!
🔥TRADE WITH FBS🔥
👍36🔥4❤3🐳3✍1
XAUUSD reached the upper border of the support range and bounced back. Now, all attention should be paid at 1975.00.
Share your analysis on XAUUSD in the comments!
@fbsanalytics
Please open Telegram to view this post
VIEW IN TELEGRAM
👍63❤10🔥9✍5👏3👎2⚡1🌚1
The price reached the descending trendline and the resistance level at 1.2450. Thus, traders should consider selling the pair with targets at 1.2400 and 1.2350.
🎯TP: 1.2400, 1.2350
Do you agree with the analysis?
@fbsanalytics
Please open Telegram to view this post
VIEW IN TELEGRAM
👍62❤14🔥5✍3👎1
🧨Valid Trendline!
📉In forex trading, a valid trendline refers to a trendline that accurately reflects the direction of price movement in a currency pair. In contrast, an invalid trendline fails to provide reliable information about the trend. Here are some key differences between a valid and not valid trendline in the context of forex trading:
Confirmation by price action: A valid trendline should be confirmed by price action, meaning that the price movements should consistently respect the trendline. In an uptrend, for example, the price should generally make higher highs and higher lows, maintaining an upward trajectory relative to the trendline. An invalid trendline may show price movements disregarding or violating the trendline, suggesting that it does not accurately represent the market trend.
Multiple touches: A valid trendline is typically formed by connecting multiple significant support or resistance points on the price chart. The more times the price touches and reacts to the trendline, the stronger its validity.
Volume and other indicators: Valid trendlines are often supported by other technical indicators, such as volume, oscillators, or moving averages. When volume confirms the trendline, it adds further validity to the analysis. Additionally, other indicators that align with the trendline can strengthen its reliability.
❗️It's important to note that trendlines, like any technical analysis tool, are not infallible and should be used with other indicators and analysis techniques.
📉In forex trading, a valid trendline refers to a trendline that accurately reflects the direction of price movement in a currency pair. In contrast, an invalid trendline fails to provide reliable information about the trend. Here are some key differences between a valid and not valid trendline in the context of forex trading:
Confirmation by price action: A valid trendline should be confirmed by price action, meaning that the price movements should consistently respect the trendline. In an uptrend, for example, the price should generally make higher highs and higher lows, maintaining an upward trajectory relative to the trendline. An invalid trendline may show price movements disregarding or violating the trendline, suggesting that it does not accurately represent the market trend.
Multiple touches: A valid trendline is typically formed by connecting multiple significant support or resistance points on the price chart. The more times the price touches and reacts to the trendline, the stronger its validity.
Volume and other indicators: Valid trendlines are often supported by other technical indicators, such as volume, oscillators, or moving averages. When volume confirms the trendline, it adds further validity to the analysis. Additionally, other indicators that align with the trendline can strengthen its reliability.
❗️It's important to note that trendlines, like any technical analysis tool, are not infallible and should be used with other indicators and analysis techniques.

👍58❤28🔥6🐳6✍5🆒3👏2❤🔥1
giphy (16).gif
13.4 MB
🛢Oil is the engine of almost all economic procedures.
But what do you know about oil and oil prices?🤔
Let’s check it here👇
t.me/QuizBot?start=OmZRI7QQ
But what do you know about oil and oil prices?🤔
Let’s check it here👇
t.me/QuizBot?start=OmZRI7QQ
❤35👍31✍7👀7🌭1🆒1
#education
Swing trading – is a thing for those who are patient.
At the same time, Swing trading is highly profitable.🚀
1️⃣The first step is to open a trade, e.g., we open the trade DOWN🔻
If you are right and the trend is bearish, wait for the price to reach the first consolidation zone.
2️⃣The second step is to set a trailing Stop Loss and open more trades down.
If you are right again, your profit will be maximized.🚀
When the price reaches the second consolidation zone, but the trend is still bearish, and there are no reversal signals – it’s time to open more trades down again.📉
3️⃣The third step is to find the exit point. Of course, all your trades may be closed by the Stop Loss you’ve set before, but if you see good reversal signals and close your trades following your strategy – that’s even better!
🔥Use Swing Trading and achieve great results.🔥
TRADE WITH FBS🎉
Swing trading – is a thing for those who are patient.
At the same time, Swing trading is highly profitable.🚀
1️⃣The first step is to open a trade, e.g., we open the trade DOWN🔻
If you are right and the trend is bearish, wait for the price to reach the first consolidation zone.
2️⃣The second step is to set a trailing Stop Loss and open more trades down.
If you are right again, your profit will be maximized.🚀
When the price reaches the second consolidation zone, but the trend is still bearish, and there are no reversal signals – it’s time to open more trades down again.📉
3️⃣The third step is to find the exit point. Of course, all your trades may be closed by the Stop Loss you’ve set before, but if you see good reversal signals and close your trades following your strategy – that’s even better!
🔥Use Swing Trading and achieve great results.🔥
TRADE WITH FBS🎉

❤134👍66🔥10✍9🍾8🐳6🌚3🌭1