
After the significant bounce off the support range, XAUUSD has broken above the descending trendline.
Thus setup looks bullish. Thus, we expect the yellow metal to soon move toward 1920 - 1930.
🎯TP: 1920, 1930
Share your analysis in the comments!
@fbsanalytics
Please open Telegram to view this post
VIEW IN TELEGRAM
👍171🔥56❤41❤🔥9🤔8⚡3🆒1
EURUSD bounced off the resistance trendline. We can use this rejection for short term trade toward the support range.
🎯TP: 1.0837
Do you agree?
@fbsanalytics
Please open Telegram to view this post
VIEW IN TELEGRAM
👍113🔥24❤16🐳9⚡5👌5👎4😍3🆒3✍2🌚2
#education
🧐Cable, loonie, kiwi...What are these random words? These are the names of the most famous currency pairs! Do you know more of them? Check out the fresh article in the FBS blog ➡️
https://bit.ly/3r8NC73
🧐Cable, loonie, kiwi...What are these random words? These are the names of the most famous currency pairs! Do you know more of them? Check out the fresh article in the FBS blog ➡️
https://bit.ly/3r8NC73

👍55🔥14❤10❤🔥7👏5🆒5⚡1🌚1
#MarketNews
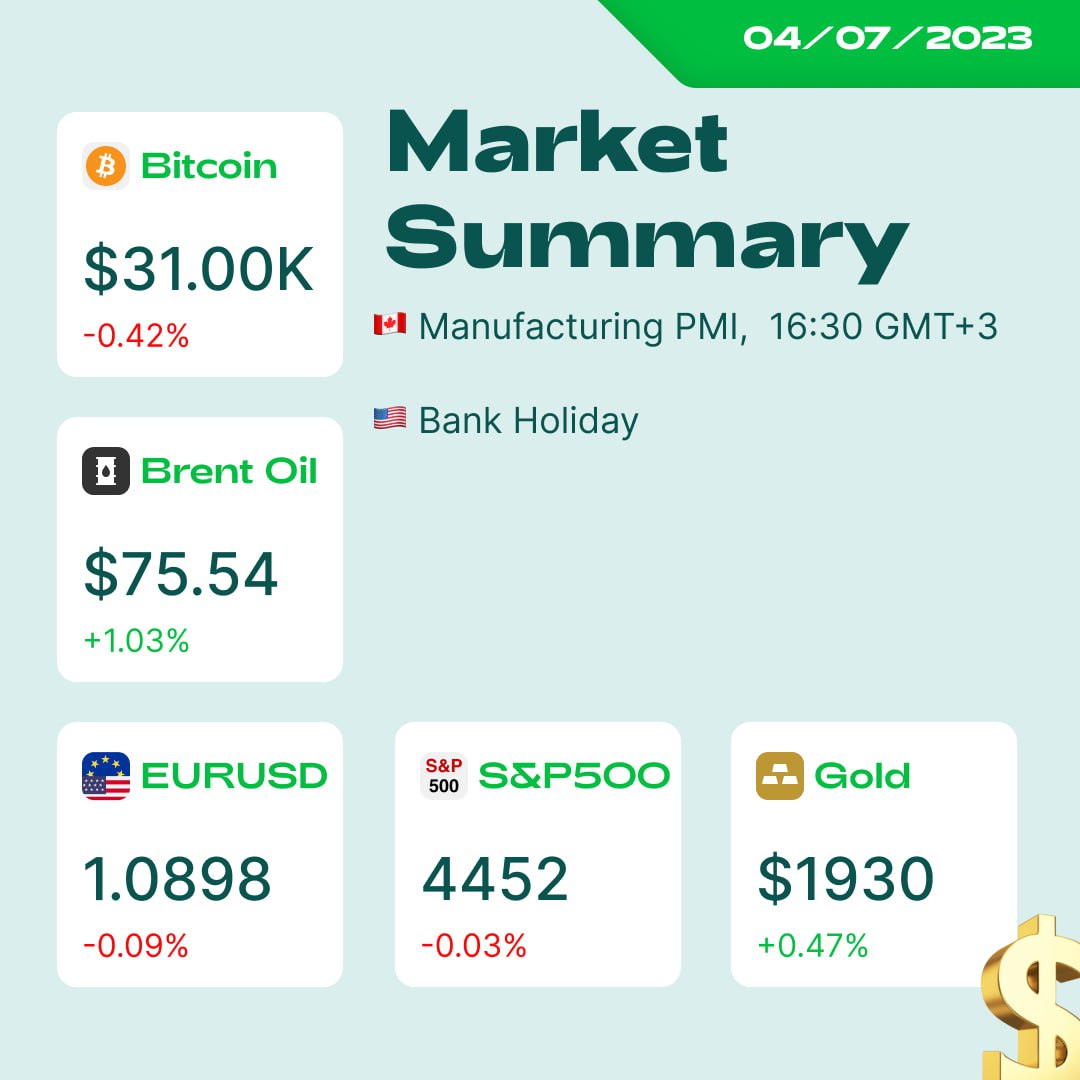
☀️Happy Tuesday, dear traders! Today's volatility is low due to Independence Day in the United States. However, instruments are still available to trade, so let's check the freshest news, moving the markets right now!
🇺🇸US 2-10-year bond yield curve inversion resumed growth and is close to record. Historically, recessions have occurred after the curve has begun to flatten completely (get out of inversion), not when the inversion continues to rise.
🎉US banks are closed today due to Independence Day in the USA. JP225, US30, US100, US500, UK100, XNGUSD, XTIUSD, XBRUSD, XAUUSD, and XAGUSD will stop trading at 21:30 GMT+3.
🇹🇷Yesterday, the Turkish central bank said to stop supporting the lira exchange rate. However, today the bank resumed supporting actions. USDTRY is up 216% over the last 18 months.
🇦🇺RBA held its rate meeting and decided to remain the rate at the same 4.1% level it was at a month before. AUDUSD lost 460 points.
💱Coinbase (COIN) shares gained 11% on the news that the exchange will help monitor BTC-ETF funds.
🇺🇸US ISM Manufacturing PMI and Manufacturing prices were below expectations. The release caused a slight decline in EURUSD.
➡️Get XAUUSD update: https://bit.ly/3K5Zei3
☀️Happy Tuesday, dear traders! Today's volatility is low due to Independence Day in the United States. However, instruments are still available to trade, so let's check the freshest news, moving the markets right now!
🇺🇸US 2-10-year bond yield curve inversion resumed growth and is close to record. Historically, recessions have occurred after the curve has begun to flatten completely (get out of inversion), not when the inversion continues to rise.
🎉US banks are closed today due to Independence Day in the USA. JP225, US30, US100, US500, UK100, XNGUSD, XTIUSD, XBRUSD, XAUUSD, and XAGUSD will stop trading at 21:30 GMT+3.
🇹🇷Yesterday, the Turkish central bank said to stop supporting the lira exchange rate. However, today the bank resumed supporting actions. USDTRY is up 216% over the last 18 months.
🇦🇺RBA held its rate meeting and decided to remain the rate at the same 4.1% level it was at a month before. AUDUSD lost 460 points.
💱Coinbase (COIN) shares gained 11% on the news that the exchange will help monitor BTC-ETF funds.
🇺🇸US ISM Manufacturing PMI and Manufacturing prices were below expectations. The release caused a slight decline in EURUSD.
➡️Get XAUUSD update: https://bit.ly/3K5Zei3
❤37👍26🔥6👌5🌚4🌭2✍1
The pair reached the support block around 1.3220. Currently, the price is bouncing off this level, confirming its strength. Thus, you can consider buying inside the green box.
🎯TP: 1.3283
Do you trade USDCAD?
@fbsanalytics
Please open Telegram to view this post
VIEW IN TELEGRAM
❤104👍41🔥15❤🔥11⚡6💩5💔5🙏4😍4💯4😁3
Today, OPEC+ will host a meeting to decide the oil market conditions. As we can notice, XBRUSD reached the trendline and bounced off. Thus, we may expect another decline in the support area at 71.70.
🎯TP: 71.70
Do you trade oil?
@fbsanalytics
Please open Telegram to view this post
VIEW IN TELEGRAM
❤51👍26🔥9👎6😍3💔3❤🔥2🍌2⚡1🌚1
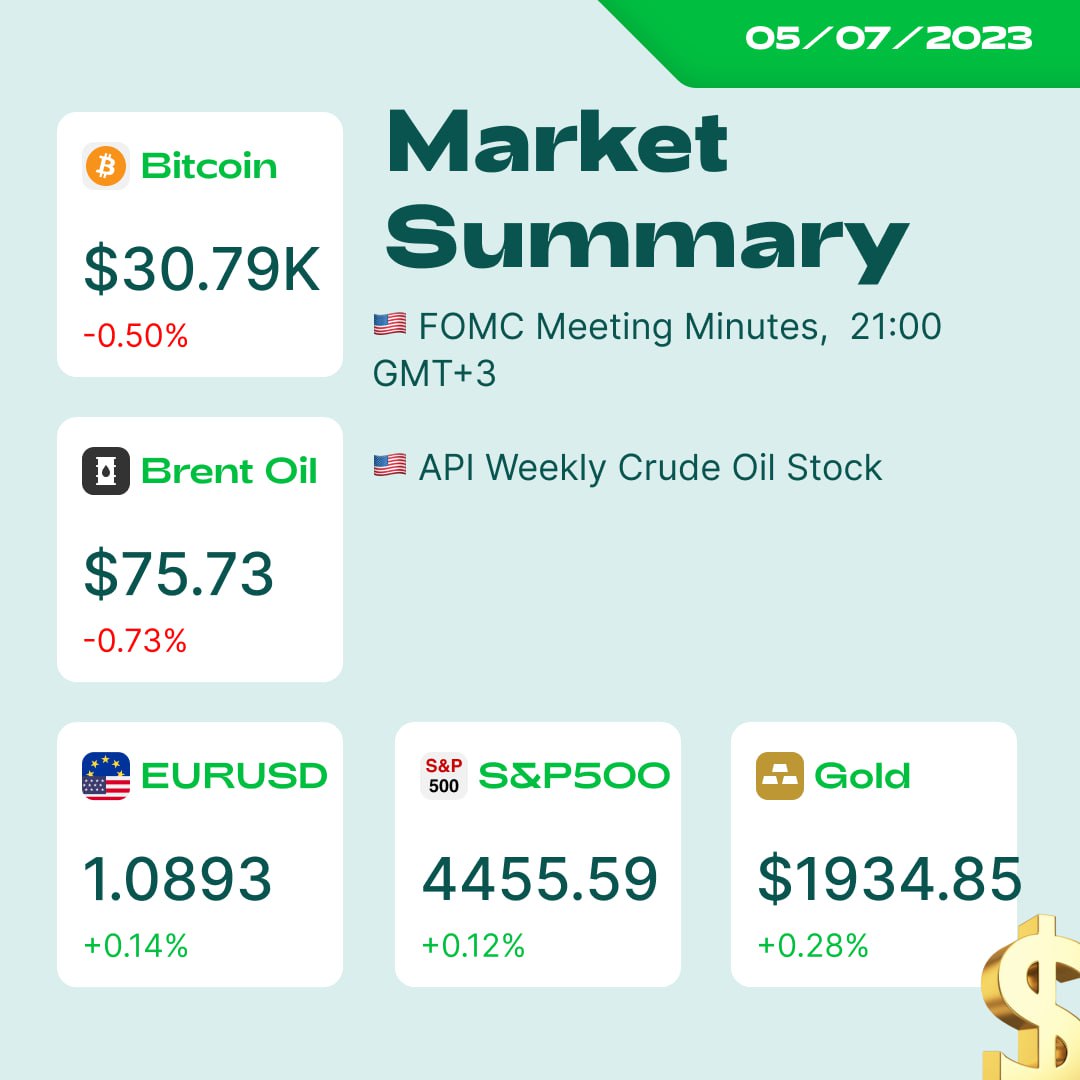
🎉Hey-hi, dears! We are here with you today with lots of different news. Let’s start👇
🇳🇿The Global Dairy Price Index plummeted by 3.3% - usually a negative signal for NZD. But yesterday, NZDUSD grew by 0.61%, breaking the moving averages with periods 50 and 200. Meanwhile, on the weekly timeframe, the trend is bearish. What’s going on with NZDUSD? Check in our review here
➡️ https://tinyurl.com/mkbuhx9h
🇪🇺Citigroup downgraded the Eurozone real GDP growth forecast in 2023 to +0.3% from +0.8%. Purchasing Manager Indices are falling – the economy is slowing down. Meanwhile, inflation in Europe is still high – at 7.1%. Welcome to Stagflation, guys.😂
🇹🇷Turkish CPI for June was released at 38.2% YoY.
🇦🇺Australian Retail Sales MoM increased by 0.7% - the same as the forecast. We’d like to pay attention to EURAUD, guys. The price broke its trend line down and tried to break 50MA. 38.2% Fibo correction level is at the same level. The support is at 1.6173.
🇯🇵Japan Services PMI for June fell to 54 points. If the Purchasing Manager Index drops below 50 points – this is a signal that the economy is slowing down.
🇩🇪German Services PMI also fell to 54.1 points (the same as the forecast). Considering that the Service sector takes over 70% of the National economy, no wonder the Services PMI indices are not as low as the Production ones.
🏆BTCUSD is close to its resistance level – 32500 points. The asset still has room for rising, but risks for long positions are increasing accordingly.
🥇XAUUSD keeps rising. It is possible that soon the price may return to its 100MA at $1945. What do you think about that? Are you long or short in gold, dears?
That’s it for today! Give us❤️ if you liked this digest, and see you soon.
🇳🇿The Global Dairy Price Index plummeted by 3.3% - usually a negative signal for NZD. But yesterday, NZDUSD grew by 0.61%, breaking the moving averages with periods 50 and 200. Meanwhile, on the weekly timeframe, the trend is bearish. What’s going on with NZDUSD? Check in our review here
➡️ https://tinyurl.com/mkbuhx9h
🇪🇺Citigroup downgraded the Eurozone real GDP growth forecast in 2023 to +0.3% from +0.8%. Purchasing Manager Indices are falling – the economy is slowing down. Meanwhile, inflation in Europe is still high – at 7.1%. Welcome to Stagflation, guys.😂
🇹🇷Turkish CPI for June was released at 38.2% YoY.
🇦🇺Australian Retail Sales MoM increased by 0.7% - the same as the forecast. We’d like to pay attention to EURAUD, guys. The price broke its trend line down and tried to break 50MA. 38.2% Fibo correction level is at the same level. The support is at 1.6173.
🇯🇵Japan Services PMI for June fell to 54 points. If the Purchasing Manager Index drops below 50 points – this is a signal that the economy is slowing down.
🇩🇪German Services PMI also fell to 54.1 points (the same as the forecast). Considering that the Service sector takes over 70% of the National economy, no wonder the Services PMI indices are not as low as the Production ones.
🏆BTCUSD is close to its resistance level – 32500 points. The asset still has room for rising, but risks for long positions are increasing accordingly.
🥇XAUUSD keeps rising. It is possible that soon the price may return to its 100MA at $1945. What do you think about that? Are you long or short in gold, dears?
That’s it for today! Give us❤️ if you liked this digest, and see you soon.
❤65👍29🔥4🌭4🐳3
The price bounced off the lower border of an ascending channel, confirming the bullish sentiment. Thus, we can buy AUDUSD with the target at 0.6717.
🎯TP: 0.6718
@fbsanalytics
Please open Telegram to view this post
VIEW IN TELEGRAM
👍41❤12💔5🔥2🍓1
The metal collected liquidity above the recent highs and headed lower. The best option is to wait for a slight pullback and then open a short trade.
🎯TP: 1910 and 1894
@fbsanalytics
Please open Telegram to view this post
VIEW IN TELEGRAM
😍56👍43❤🔥18❤14🔥12😭8⚡2🐳2🌚2🤔1🌭1
#video
Please open Telegram to view this post
VIEW IN TELEGRAM
YouTube
Psychological Levels for a Better Forex Trading Strategy
Start trading now: https://bit.ly/3yf6Ibz
As a scalper, day trader or swing trader, you should understand psychological levels. The collective expectations of market participants create these price levels. In this video, FBS explains how to use these levels…
As a scalper, day trader or swing trader, you should understand psychological levels. The collective expectations of market participants create these price levels. In this video, FBS explains how to use these levels…
👍60❤16🔥7❤🔥6✍4🎉3⚡1👀1
The pair has closed the H4 candle above the key level. The uptrend is likely to continue.
🎯TP: 1.3318, 1.3380
Are you buying?
@fbsanalytics
Please open Telegram to view this post
VIEW IN TELEGRAM
👍35❤25👎11🔥5⚡2😱1
FBS Analytics
Please open Telegram to view this post
VIEW IN TELEGRAM
👍26❤🔥7🤔4✍3
💥Majors analysis
🇺🇸 US dollar index. Inverted hammer. USD might decline today.
🇪🇺🇺🇸 EURUSD. Hammer at the support area.
TP1: The descending trendline.
TP2: 1.0920.
🇬🇧 🇺🇸 GBPUSD. The price bounced off the support area.
TP1: 1.2733
TP2: 1.2755
🇺🇸🇨🇦USDCAD. Rejection & Retest.
TP1: 1.3250.
TP2: 1.3220
Don't forget about SL (Set them below the recent extremum).
➡️ TRADE WITH FBS
@fbsanalytics
🇪🇺
TP1: The descending trendline.
TP2: 1.0920.
TP1: 1.2733
TP2: 1.2755
🇺🇸🇨🇦USDCAD. Rejection & Retest.
TP1: 1.3250.
TP2: 1.3220
Don't forget about SL (Set them below the recent extremum).
@fbsanalytics
Please open Telegram to view this post
VIEW IN TELEGRAM
Please open Telegram to view this post
VIEW IN TELEGRAM
❤46👍33🔥11👌7🐳5🆒2
AUDUSD is forming the right shoulder of an "inverted head and shoulders" pattern. Currently, the price is breaking through the descending trendline. Thus, after a breakout we can take a short-term trade with the target at the neckline (approx. 0.6691).
After the breakout of the neckline two technical targets will be at 0.6750 and 0.6800.
🎯TP: 0.6691
🎯TP: 0.6750, 0.6800.
Agree?
@fbsanalytics
Please open Telegram to view this post
VIEW IN TELEGRAM
👍64🔥11❤9💯4🆒4💘3⚡2🌭1🦄1
#MarketNews
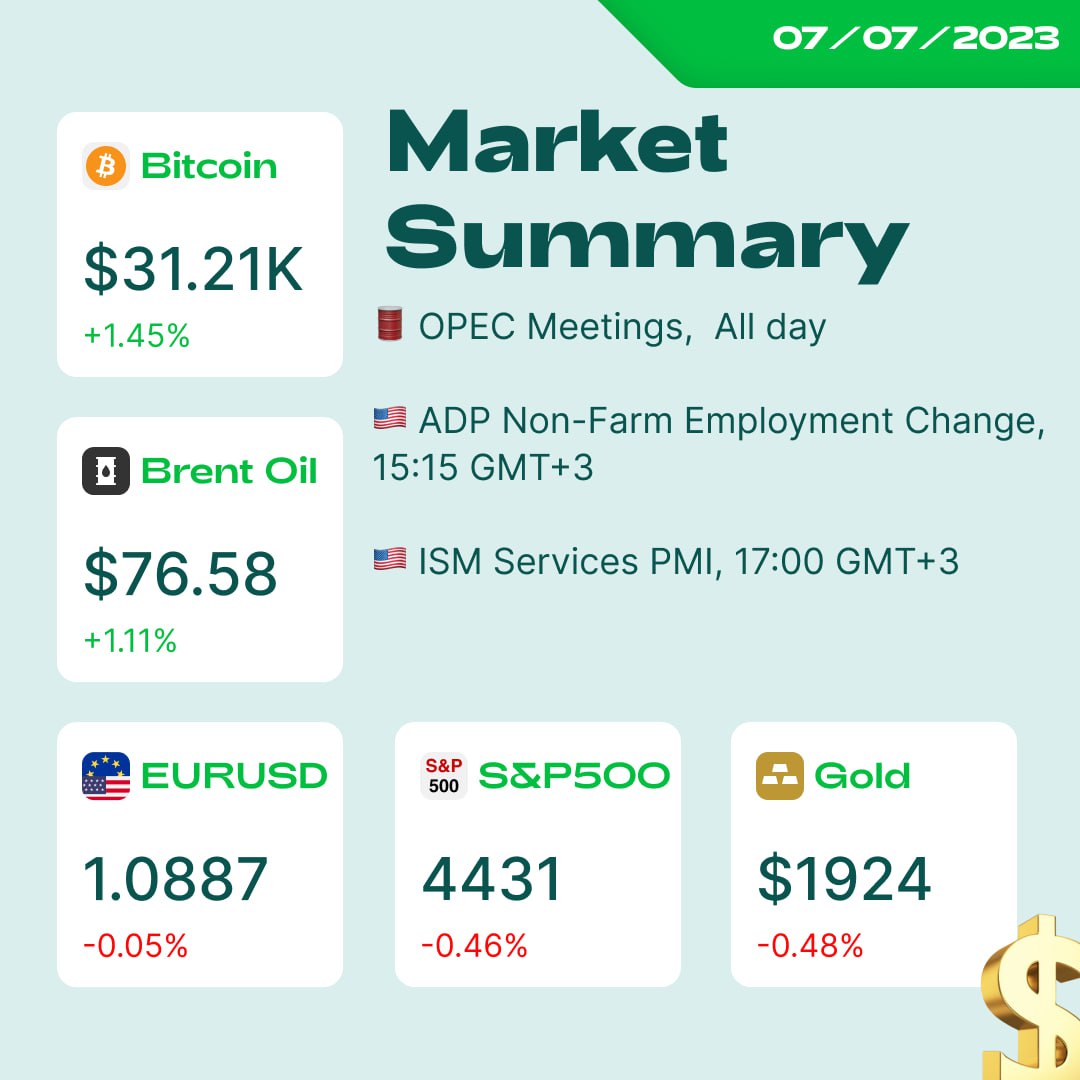
🗞 OPEC decisions, FOMC Meeting Minutes, and even more OPEC decisions. Here’s what this day has for you:
🇸🇦 Saudi energy minister says that the country’s latest oil cut shows unity with Russia. Saudi Arabia said it would extend the 1-million-barrel-per-day production cut it had initially flagged for July into August.
🇰🇼 Kuwait’s oil minister says that he hopes to have a higher production quota. XBRUSD rose to $76.70.
🇬🇧 Markets are now pricing more tare hikes in the UK. The consensus is not at 6.5% vs. the current 5% rate. JPMorgan expects an even higher rate of 7%. BOE’s governor Bailey said that inflation is way too high, above the 2% target.
💸 Bitcoin reached a one-year high of $31 555 after BlackRock CEO said that crypto is digital gold and “Bitcoin is an international asset.”
📊 US Yield Curve continues to move lower, pointing to an even harsher recession in the US. It may start before next year.
🏦 FOMC Meeting Minutes show that almost all Fed members see more rate hikes in 2023. Also, they expect a “Mild recession” in the year’s second half.
🏆 Gold declined to $1915 after the FOMC meeting and then advanced to $1924. The metal may start correction from the level of $1928.
💚 What’s in your focus today? Have an amazing day!
🗞 OPEC decisions, FOMC Meeting Minutes, and even more OPEC decisions. Here’s what this day has for you:
🇸🇦 Saudi energy minister says that the country’s latest oil cut shows unity with Russia. Saudi Arabia said it would extend the 1-million-barrel-per-day production cut it had initially flagged for July into August.
🇰🇼 Kuwait’s oil minister says that he hopes to have a higher production quota. XBRUSD rose to $76.70.
🇬🇧 Markets are now pricing more tare hikes in the UK. The consensus is not at 6.5% vs. the current 5% rate. JPMorgan expects an even higher rate of 7%. BOE’s governor Bailey said that inflation is way too high, above the 2% target.
💸 Bitcoin reached a one-year high of $31 555 after BlackRock CEO said that crypto is digital gold and “Bitcoin is an international asset.”
📊 US Yield Curve continues to move lower, pointing to an even harsher recession in the US. It may start before next year.
🏦 FOMC Meeting Minutes show that almost all Fed members see more rate hikes in 2023. Also, they expect a “Mild recession” in the year’s second half.
🏆 Gold declined to $1915 after the FOMC meeting and then advanced to $1924. The metal may start correction from the level of $1928.
💚 What’s in your focus today? Have an amazing day!
👍48❤🔥15😍8🔥6⚡3✍3
FBS Analytics
Also, we would love to see your support, press ❤️ reaction if you love our gold analysis
@fbsanalytics
Please open Telegram to view this post
VIEW IN TELEGRAM
❤306👍33❤🔥18⚡10🍾5😍4
📣 Attention, Traders! Let's talk about different types of breakouts and their signals in the market. 💥
1️⃣ Strongest Signal: Resistance Trendline Breakout during Uptrend 📈(or support trendline breakout during downtrend).
When the price breaks above the resistance trendline during an uptrend, it signifies a powerful breakout. This type of breakout suggests that the bulls are gaining control, and the market sentiment is strongly bullish. It may indicate a significant upward movement and present potential opportunities for traders to join the uptrend and capitalize on the momentum.
2️⃣ Medium Signal: Horizontal Level Breakout 📊
A breakout that occurs when the price surpasses a horizontal level is a notable signal. It indicates a shift in supply and demand dynamics, potentially leading to increased market activity. Traders should carefully analyze the price action, wait for a breakout retest, and consider additional confirmations before making trading decisions.
3️⃣ Weakest Signal: Resistance Trendline Breakout during Downtrend 📉
When the price breaks above the resistance trendline during a downtrend, it represents the weakest signal among the three types of breakouts. While it suggests a temporary interruption in the downtrend, caution is advised. The overall market sentiment remains bearish, and this breakout may be a mere retracement or a false breakout. Traders should exercise caution and look for further confirmations to avoid potential false signals. It is suggested to wait until the price breaks at least two recent highs to confirm an overall trend reversal.
Remember, breakouts can present opportunities, but it's crucial to analyze them in the context of the overall market trend and use additional indicators to validate the signals. Happy trading! 💪💼
1️⃣ Strongest Signal: Resistance Trendline Breakout during Uptrend 📈(or support trendline breakout during downtrend).
When the price breaks above the resistance trendline during an uptrend, it signifies a powerful breakout. This type of breakout suggests that the bulls are gaining control, and the market sentiment is strongly bullish. It may indicate a significant upward movement and present potential opportunities for traders to join the uptrend and capitalize on the momentum.
2️⃣ Medium Signal: Horizontal Level Breakout 📊
A breakout that occurs when the price surpasses a horizontal level is a notable signal. It indicates a shift in supply and demand dynamics, potentially leading to increased market activity. Traders should carefully analyze the price action, wait for a breakout retest, and consider additional confirmations before making trading decisions.
3️⃣ Weakest Signal: Resistance Trendline Breakout during Downtrend 📉
When the price breaks above the resistance trendline during a downtrend, it represents the weakest signal among the three types of breakouts. While it suggests a temporary interruption in the downtrend, caution is advised. The overall market sentiment remains bearish, and this breakout may be a mere retracement or a false breakout. Traders should exercise caution and look for further confirmations to avoid potential false signals. It is suggested to wait until the price breaks at least two recent highs to confirm an overall trend reversal.
Remember, breakouts can present opportunities, but it's crucial to analyze them in the context of the overall market trend and use additional indicators to validate the signals. Happy trading! 💪💼

👍84❤34✍10🔥9⚡7😱3