
🇺🇸🇨🇦USDCAD technical analysis
📈The price is moving in the ascending price channel.
USDCAD bounced from the support level 1.36870.
⬆️Trade: Buy USDCAD if the price breaks 1.37030
🎯Take Profit: 1.37400
⬇️Trade: Sell USDCAD if the price breaks 1.36870
🎯Take Profit: 1.36480.
🤔Do you agree with the analysis? What are your ideas about USDCAD? Share with us in the comments below👇
➡ TRADE WITH FBS
@fbsanalytics
📈The price is moving in the ascending price channel.
USDCAD bounced from the support level 1.36870.
⬆️Trade: Buy USDCAD if the price breaks 1.37030
🎯Take Profit: 1.37400
⬇️Trade: Sell USDCAD if the price breaks 1.36870
🎯Take Profit: 1.36480.
🤔Do you agree with the analysis? What are your ideas about USDCAD? Share with us in the comments below👇
@fbsanalytics
Please open Telegram to view this post
VIEW IN TELEGRAM
👍57❤24🔥7😁3👎2✍1
GBPUSD has reached the resistance area around 1.2145. Traders should closely watch the price reaction as:
🐳Do you agree guys?
@fbsanalytics
Please open Telegram to view this post
VIEW IN TELEGRAM
👍57❤🔥23❤16🔥10✍8
⁉️Making trades against the current direction of price action is more commonly known as:
Anonymous Poll
27%
Breakout trading
58%
Counter-trend trading
15%
Trend trading
🔥27👍17❤9⚡6✍4🐳2
👋Hello, guys!
🎉Let’s speak about pullbacks.
Some traders prefer to increase their positions on pullbacks and some traders not.
🤔Why so? What’s the right strategy to use if you see a pullback?
❗️Pullbacks are corrections to the main trend
✅when the market is rising - a pullback is a quick movement down📉
✅when the market is falling – a pullback is a quick movement up📈
❗️Pullbacks appear because some market participants want to fix their profit. The volume during the pullback usually falls and increases during the main trend.
What’s wrong with pullbacks?
😱The market is tricky, so when the price starts moving in the opposite direction, we can never say if it’s a pullback or a new trend.
➡️If a trader has profitable positions psychologically he will be afraid that the market will take all his profit back;
➡️If a trader has no positions, psychologically, it will be hard for him to open a trade in a pullback, because prices are too high/low.
🧐So, how do we define that we are dealing with a pullback but not a new trend?
📈Okay, let’s say that we are in the bullish trend. If the price is in the pullback – it should quickly bounce from one of the support levels and start rising again.
😉By the way, in a pullback, the price usually cannot break the previous strong highest high.
The main strategy is not to buy while the price is falling.
❗️Don’t try to catch the lowest low for the price. It’s almost impossible. Buy only when the price starts rising again.
🛑 Set your Stop Loss slightly below the nearest support level.
🤔Do you agree with it?
Share your ideas in the comments👇
➡ TRADE WITH FBS
@fbsanalytics
🎉Let’s speak about pullbacks.
Some traders prefer to increase their positions on pullbacks and some traders not.
🤔Why so? What’s the right strategy to use if you see a pullback?
❗️Pullbacks are corrections to the main trend
✅when the market is rising - a pullback is a quick movement down📉
✅when the market is falling – a pullback is a quick movement up📈
❗️Pullbacks appear because some market participants want to fix their profit. The volume during the pullback usually falls and increases during the main trend.
What’s wrong with pullbacks?
😱The market is tricky, so when the price starts moving in the opposite direction, we can never say if it’s a pullback or a new trend.
➡️If a trader has profitable positions psychologically he will be afraid that the market will take all his profit back;
➡️If a trader has no positions, psychologically, it will be hard for him to open a trade in a pullback, because prices are too high/low.
🧐So, how do we define that we are dealing with a pullback but not a new trend?
📈Okay, let’s say that we are in the bullish trend. If the price is in the pullback – it should quickly bounce from one of the support levels and start rising again.
😉By the way, in a pullback, the price usually cannot break the previous strong highest high.
The main strategy is not to buy while the price is falling.
❗️Don’t try to catch the lowest low for the price. It’s almost impossible. Buy only when the price starts rising again.
🛑 Set your Stop Loss slightly below the nearest support level.
🤔Do you agree with it?
Share your ideas in the comments👇
@fbsanalytics
Please open Telegram to view this post
VIEW IN TELEGRAM
Fbs
Log in to your FBS account
Enter your email and password to access the FBS Personal Area. Deposit, trade, and succeed!
👍134❤43🔥19❤🔥3
👋Hello, guys!
Thanks a lot for answering the questions about Forex Trading Plan
The correct answers are 1️⃣1️⃣1️⃣
Now, let’s go through 9 intraday tips for traders.
Here is our review ➡️ https://bit.ly/46EEUNG
Now when you are ready, try to answer the following questions👇
Question 1. Intraday traders usually pick assets depending on the…
1️⃣fundamental analysis
2️⃣volatility
3️⃣open interest
Question 2. A trader must decide on an entry point and a Take Profit level … entering the market.
1️⃣...the time of...
2️⃣...after...
3️⃣...before...
Question 3. If the market is not supporting your analysis, ... your positions.
1️⃣...add in
2️⃣...close
3️⃣...stay in
TRADE WITH FBS
@fbsanalytics
Thanks a lot for answering the questions about Forex Trading Plan
The correct answers are 1️⃣1️⃣1️⃣
Now, let’s go through 9 intraday tips for traders.
Here is our review ➡️ https://bit.ly/46EEUNG
Now when you are ready, try to answer the following questions👇
Question 1. Intraday traders usually pick assets depending on the…
1️⃣fundamental analysis
2️⃣volatility
3️⃣open interest
Question 2. A trader must decide on an entry point and a Take Profit level … entering the market.
1️⃣...the time of...
2️⃣...after...
3️⃣...before...
Question 3. If the market is not supporting your analysis, ... your positions.
1️⃣...add in
2️⃣...close
3️⃣...stay in
TRADE WITH FBS
@fbsanalytics

👍84🆒12❤🔥9✍7❤7🔥5🌚5👌1🥴1🌭1
#MarketNews
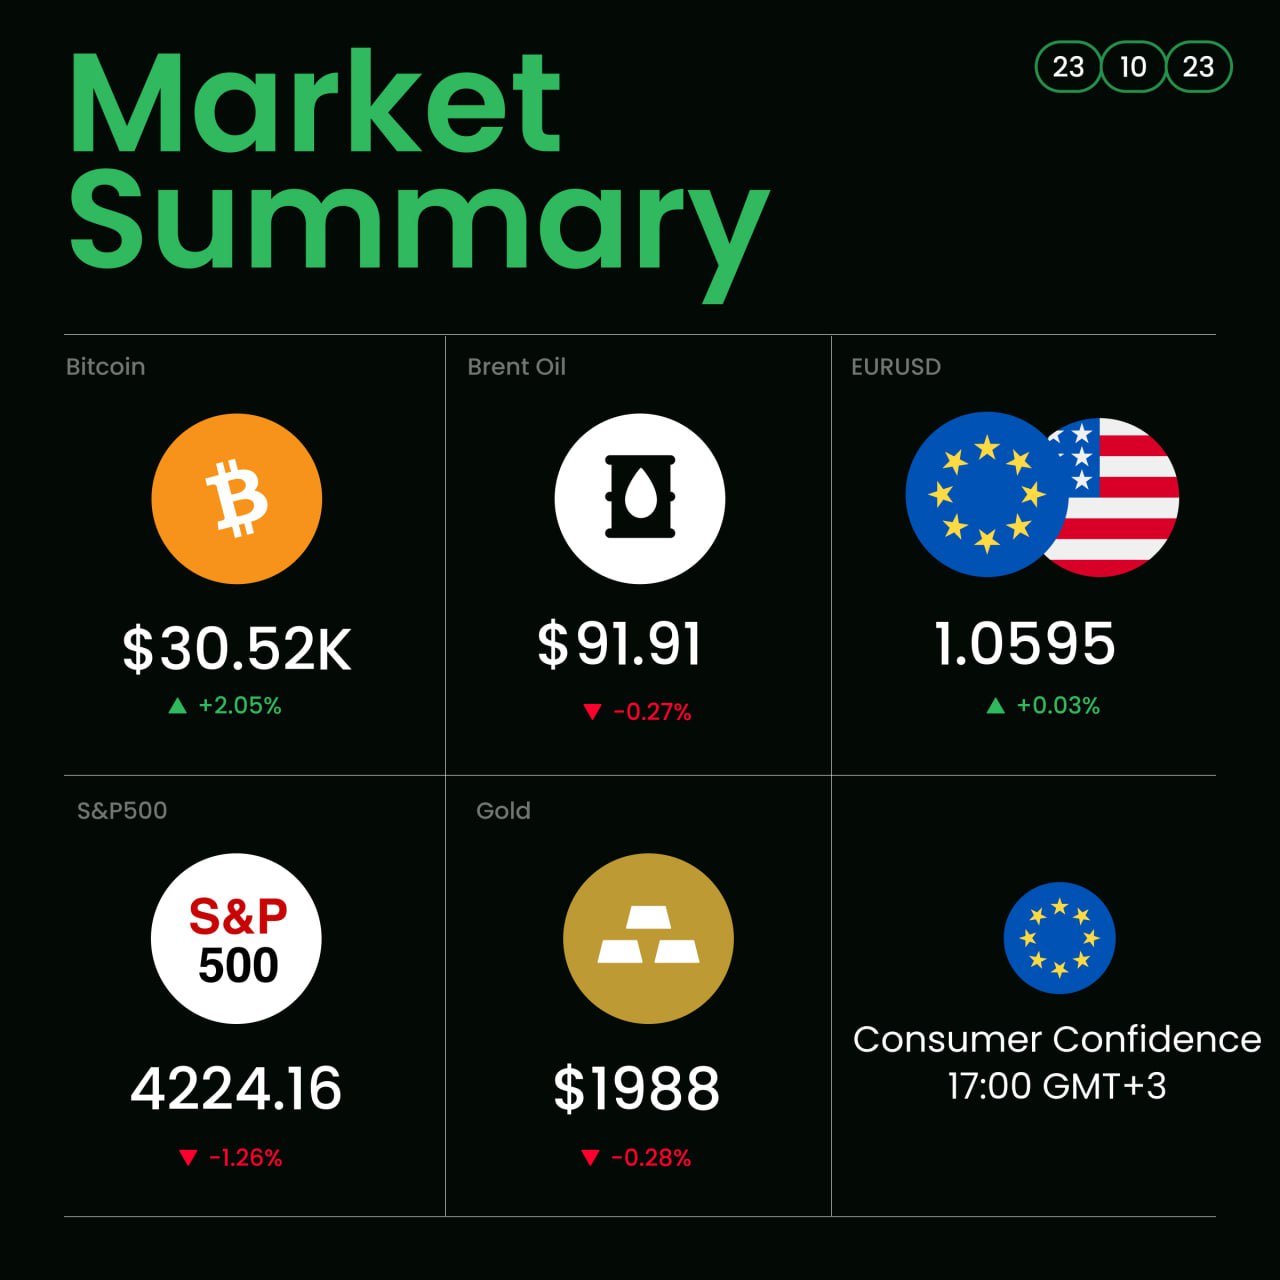
☀️ Good day, traders! Here’s the most impactful news of the week
📆 Economic calendar
The time zone is GMT+3. Check your time zone here. (https://www.timeanddate.com/time/map/)
Monday
1️⃣EUR 17:00, Consumer Confidence Index
Tuesday
1️⃣USD 16:45, S&P Global Services PMI
2️⃣Microsoft, Google, Visa, CocaCola, Novartis reports
Wednesday
1️⃣USD 17:00, New Home Sales
2️⃣CAD 17:00, BoC Interest Rate Decision
3️⃣Oil 17:30, Crude Oil Inventories
4️⃣Facebook, IBM, Boeing reports
Thursday
1️⃣EUR 15:15, ECB Interest Rate Decision
2️⃣USD 15:30, Gross Domestic Product
3️⃣USD 17:00, Pending Home Sales
4️⃣Amazon, Mastercard, Intel reports
Friday
1️⃣USD 15:30, Personal Consumption Expenditure
2️⃣Exxon Mobil, Chevron reports
🗞News to keep you updated
🛢This year, the US Department of Energy has repeatedly stated that it wants to begin replenishing SPR, but the price did not seem right because they set themselves a range from 68 to 72 dollars. The price ironically costs much more - about $90 per WTI. Whether the price will fall within two months is anyone's guess. However, with OPEC and Saudi Arabia still determined to rein in production, the chances of this happening are slim, even with Venezuela's oil production rising.
🛢 China has significantly increased imports of energy resources and raw materials. In September 2023, crude oil imports increased by 14.6% compared to last year's, natural gas by 8.2%, coal by 73.1%, and iron ore by 6.7%.
⛽️Total gas reserves in the EU continue to reach historical highs, with injection rates rebounding following warming in Europe. LNG receipts into the region have increased slightly, but in October, they remain near the minimum values in almost two years.
💶The weekly outflow from money market funds in the United States was the highest since the collapse of Lehman Brothers. The outflow was expected since it was tax week in the States, but even when annual taxes were paid, the outflow from the money market was not so strong.
🏦The most significant US companies will soon present their reports. Strong gains in the so-called "Magnificent Seven" stocks - Apple, Microsoft, Alphabet, Amazon, Nvidia, Tesla, and Meta Platforms - accounted for nearly all of the S&P 500 Index's annual gain - due to their overweight in the S&P 500 index. The Magnificent Seven shares trade at an average forward price-to-earnings ratio of 33.5, compared to the S&P 500's P/E of 18.3.
💸 BTCUSD has almost touched 31000. The price is approaching the resistance line at 31800 in the weekly timeframe.
🥇Gold analysis for the week ahead:
➡️ https://bit.ly/3Sdd2Mi
☀️ Good day, traders! Here’s the most impactful news of the week
📆 Economic calendar
The time zone is GMT+3. Check your time zone here. (https://www.timeanddate.com/time/map/)
Monday
1️⃣EUR 17:00, Consumer Confidence Index
Tuesday
1️⃣USD 16:45, S&P Global Services PMI
2️⃣Microsoft, Google, Visa, CocaCola, Novartis reports
Wednesday
1️⃣USD 17:00, New Home Sales
2️⃣CAD 17:00, BoC Interest Rate Decision
3️⃣Oil 17:30, Crude Oil Inventories
4️⃣Facebook, IBM, Boeing reports
Thursday
1️⃣EUR 15:15, ECB Interest Rate Decision
2️⃣USD 15:30, Gross Domestic Product
3️⃣USD 17:00, Pending Home Sales
4️⃣Amazon, Mastercard, Intel reports
Friday
1️⃣USD 15:30, Personal Consumption Expenditure
2️⃣Exxon Mobil, Chevron reports
🗞News to keep you updated
🛢This year, the US Department of Energy has repeatedly stated that it wants to begin replenishing SPR, but the price did not seem right because they set themselves a range from 68 to 72 dollars. The price ironically costs much more - about $90 per WTI. Whether the price will fall within two months is anyone's guess. However, with OPEC and Saudi Arabia still determined to rein in production, the chances of this happening are slim, even with Venezuela's oil production rising.
🛢 China has significantly increased imports of energy resources and raw materials. In September 2023, crude oil imports increased by 14.6% compared to last year's, natural gas by 8.2%, coal by 73.1%, and iron ore by 6.7%.
⛽️Total gas reserves in the EU continue to reach historical highs, with injection rates rebounding following warming in Europe. LNG receipts into the region have increased slightly, but in October, they remain near the minimum values in almost two years.
💶The weekly outflow from money market funds in the United States was the highest since the collapse of Lehman Brothers. The outflow was expected since it was tax week in the States, but even when annual taxes were paid, the outflow from the money market was not so strong.
🏦The most significant US companies will soon present their reports. Strong gains in the so-called "Magnificent Seven" stocks - Apple, Microsoft, Alphabet, Amazon, Nvidia, Tesla, and Meta Platforms - accounted for nearly all of the S&P 500 Index's annual gain - due to their overweight in the S&P 500 index. The Magnificent Seven shares trade at an average forward price-to-earnings ratio of 33.5, compared to the S&P 500's P/E of 18.3.
💸 BTCUSD has almost touched 31000. The price is approaching the resistance line at 31800 in the weekly timeframe.
🥇Gold analysis for the week ahead:
➡️ https://bit.ly/3Sdd2Mi
👍46❤12🔥10⚡1🌚1
🛢XBRUSD technical analysis!
📈The price is in the ascending price channel. In the H4 timeframe, 50MA broke 100MA up.
XBRUSD bounced from 91.30 and moved down.
🐻If bears succeed in breaking 90 the target may become 89.10.
⬇️Trade: SELL XBRUSD if the price breaks 90.
🎯Take Profit 1: 89.10
🎯Take Profit 2: 87.70
⬆️Trade: BUY XBRUSD if the price breaks 91.30
🎯Take Profit: 92.50.
❗️The analysis was made in H4 timeframe
🤔Do you agree? Share your ideas👇
TRADE WITH FBS
@fbsanalytics
📈The price is in the ascending price channel. In the H4 timeframe, 50MA broke 100MA up.
XBRUSD bounced from 91.30 and moved down.
🐻If bears succeed in breaking 90 the target may become 89.10.
⬇️Trade: SELL XBRUSD if the price breaks 90.
🎯Take Profit 1: 89.10
🎯Take Profit 2: 87.70
⬆️Trade: BUY XBRUSD if the price breaks 91.30
🎯Take Profit: 92.50.
❗️The analysis was made in H4 timeframe
🤔Do you agree? Share your ideas👇
TRADE WITH FBS
@fbsanalytics
👍31⚡17❤5✍3👨💻2🌚1
The price has formed the bullish double bottom pattern. Currently, GBPUSD is testing the neckline, which is the primary resistance. Traders may consider buying GBPUSD with targets at 1.2220 and 1.2260 when the H1 candle closes above 1.2180.
🎯TP: 1.2220, 1.2260
Do you agree?
@fbsanalytics
Please open Telegram to view this post
VIEW IN TELEGRAM
❤49👍40🔥9⚡7🌚6
🧘Control Your Drive part.2
🎬Watch a series of thought-provoking interviews on managing risks and controlling emotions.
In this episode of Control Your Drive, Andrew will meet Eduard, an FBS Financial Market Analyst, to discuss tools that will help you preserve your funds. Join to get insider tips for smarter, safer trading!
🔊Tune in for lots of expert advice on managing risks and emotional control!
Watch now: https://www.youtube.com/watch?v=3-6-5U7l33Q
🎬Watch a series of thought-provoking interviews on managing risks and controlling emotions.
In this episode of Control Your Drive, Andrew will meet Eduard, an FBS Financial Market Analyst, to discuss tools that will help you preserve your funds. Join to get insider tips for smarter, safer trading!
🔊Tune in for lots of expert advice on managing risks and emotional control!
Watch now: https://www.youtube.com/watch?v=3-6-5U7l33Q
YouTube
Control your drive: Trading tools
Watch a series of thought-provoking interviews on managing risks and controlling one's emotions — in driving or trading.In this episode of Control Your Drive...
👍24❤7🔥4
#Education
🦋 Harmonic Patterns in Trading: Unlocking Opportunities!
Hey traders! Let's dive into the world of Harmonic Patterns, a fascinating tool in technical analysis that can help you identify potential trend reversals and continuation points in the market.
🔍 What are Harmonic Patterns?
Harmonic patterns are a type of chart pattern that uses Fibonacci levels to predict potential future price movements. These patterns are named after creatures like the Bat, Butterfly, Crab, Cypher, Gartley, and Shark, which represent different market conditions.
📊 How to Trade Harmonic Patterns?
Identify the Pattern. Start by recognizing one of the harmonic patterns mentioned above on your chart.
Confirm with Indicators. Use other technical indicators like RSI, MACD, or Stochastics to confirm the signal.
Set Entry and Exit Points. Determine your entry and exit points, as well as stop-loss and take-profit levels.
Risk Management. Always use proper risk management techniques to protect your capital.
Practice. Harmonic pattern trading requires practice and experience. Start on a demo account to hone your skills.
Learn more about harmonic patterns on our website!
👀 Have you found any harmonic patterns on the charts recently? Share in the comments!
Hey traders! Let's dive into the world of Harmonic Patterns, a fascinating tool in technical analysis that can help you identify potential trend reversals and continuation points in the market.
Harmonic patterns are a type of chart pattern that uses Fibonacci levels to predict potential future price movements. These patterns are named after creatures like the Bat, Butterfly, Crab, Cypher, Gartley, and Shark, which represent different market conditions.
Identify the Pattern. Start by recognizing one of the harmonic patterns mentioned above on your chart.
Confirm with Indicators. Use other technical indicators like RSI, MACD, or Stochastics to confirm the signal.
Set Entry and Exit Points. Determine your entry and exit points, as well as stop-loss and take-profit levels.
Risk Management. Always use proper risk management techniques to protect your capital.
Practice. Harmonic pattern trading requires practice and experience. Start on a demo account to hone your skills.
Learn more about harmonic patterns on our website!
Please open Telegram to view this post
VIEW IN TELEGRAM
❤61👍37🔥13✍7❤🔥4⚡3🐳2
☀️Happy Tuesday, dear traders. This week is gaining momentum, and we're here to check the freshest news, moving the markets today!
🏦JPMorgan believes the US dollar will remain strong in 3-6 months.
☣️BTCUSD reached $35,000 for the first time since May 2022.
🇦🇺Bullock (Reserve Bank of Australia) says the Bank will undoubtedly raise rates if inflation rises again. AUDUSD is up 300 points today.
🇨🇳 China's stock market falls to pre-Covid lows. HK50 is down 0.42% today.
🇯🇵 Bloomberg says the Bank of Japan may reconsider yield curve control policy due to rising US yields. USDJPY is down 150 points today.
💵 BlackRock CEO forecasts the Fed may have to raise rates further. The US dollar index (DXY) gains 130 points today.
➡️ Read USDCHF analysis: https://bit.ly/408sEma
🏦JPMorgan believes the US dollar will remain strong in 3-6 months.
☣️BTCUSD reached $35,000 for the first time since May 2022.
🇦🇺Bullock (Reserve Bank of Australia) says the Bank will undoubtedly raise rates if inflation rises again. AUDUSD is up 300 points today.
Please open Telegram to view this post
VIEW IN TELEGRAM
👍28⚡9❤9🔥3
In the H4 timeframe, EURUSD broke 23.6% and 38.2% of Fibo correction levels.
🎯TP: 1.0610; 1.0590
@fbsanalytics
Please open Telegram to view this post
VIEW IN TELEGRAM
❤49👍38✍11👎2
💥Join FBS analyst to trade Forex Live! 💥
Our expert Nikolay will analyze the markets live during the ECB Statement and the US Unemployment claims release. The stream will start on Thursday, October 26, at 15:10 GMT+3 👇
➡️ Set a reminder ⏰: https://t.me/fbsanalytics?livestream
Our expert Nikolay will analyze the markets live during the ECB Statement and the US Unemployment claims release. The stream will start on Thursday, October 26, at 15:10 GMT+3 👇
Please open Telegram to view this post
VIEW IN TELEGRAM
❤40👍23🆒9⚡2🔥1🐳1🌚1🍾1
The pair is testing the resistance area around 1.3740, while the RSI broke the trendline and moved to the 70.0 area — bullish signal. Thus, we expect the pair to make a bullish breakout soon.
🎯TP: 1.3780.
@fbsanalytics
Please open Telegram to view this post
VIEW IN TELEGRAM
👍36✍26❤14👎10🔥9
Demo accounts 🆚 Real accounts
Most of the newbies start with trading on Demo, of course. But on Demo, all psychological factors are turned off👩💻
➡️ That’s why switching to the Real account from Demo becomes a big surprise.
🤔 What’s your opinion about that, guys? When is it time to start using a Real account instead of a Demo?
Share your ideas in the comments👇
➡ TRADE WITH FBS
@fbsanalytics
Most of the newbies start with trading on Demo, of course. But on Demo, all psychological factors are turned off
Share your ideas in the comments
@fbsanalytics
Please open Telegram to view this post
VIEW IN TELEGRAM
👍94❤25🔥9❤🔥6
If the price breaks 0.63570 – the next target may become 0.63490, 0.63440, and then 0.63310
🎯TP: 0.63440; 0.63310
@fbsanalytics
Please open Telegram to view this post
VIEW IN TELEGRAM
👍69❤26🔥14❤🔥8🥰2
🇺🇸According to JP Morgan, the number of managers planning to increase long stock positions shortly is growing significantly. By the way, the last three months of the year are historically some of the strongest for global equities.
🛢The International Energy Agency - essentially an antagonist of OPEC - is still trying to “persuade” oil to fall despite the events in the Middle East. However, the projected peak, which the agency also expects for coal and natural gas, does not mean that a rapid decline in fossil fuel consumption is inevitable. The IEA's forecasts largely rely on China's rush demand for electric vehicles. The agency somehow forgot to mention that in China, an impressive share of the electricity is generated at old-fashioned oil and coal-fired power plants.
🥇XAUUSD is moving in the range of 1950 – 1990. Stochastic lines are leaving the overbought zone.
That's it for now. What are your trading ideas?
Please open Telegram to view this post
VIEW IN TELEGRAM
🔥38👍31❤21✍9🐳5⚡2🌚2❤🔥1🫡1
Hello, guys! US companies keep publishing their Q3 financial results.
🏦We have already mentioned about banks in our recent post.
Now, let’s look at some other big companies:
Are you following the earnings season in the US?
@fbsanalytics
Please open Telegram to view this post
VIEW IN TELEGRAM
👍59❤10🔥7💔7🐳6⚡2😈2❤🔥1🌭1
The pair is trading above the support trendline, with buyers showing high interest in this area.
Share your opinion in the comments!
@fbsanalytics
Please open Telegram to view this post
VIEW IN TELEGRAM
❤58👍56🔥14✍6⚡6❤🔥2🌚2