
#TradeIdea
👉 🥇 🇻🇦 👈 XAUUSD Outlook!
👀 On the 30-minute chart, XAUUSD is currently testing the support level of 2024.00. The price action suggests two potential scenarios:
🔽 If the price breaks below the support level 2024.00, it may lead to a significant support zone at 2015.00.
🔼 Conversely, if the bulls gain momentum and push the price higher, the next target could be 2030.00 or even 2040.00.
❓ Are you on the bullish or bearish side?
➡️ TRADE WITH FBS
@fbsanalytics
@fbsanalytics
Please open Telegram to view this post
VIEW IN TELEGRAM
❤64👍45🔥12🆒3❤🔥2⚡2🎉2💅1🦄1😎1
#TradeIdea
👉 💡 ▶️ ⏩ A key moment for the US30!
👀 On the H2, US30 is moving in an ascending channel, but the price is near the lower trend line while testing the resistance level.
🔼 If US30 bounces off the trend line, the upside target will be the 38800 resistance level
🔽 However, overcoming the lower trend line will decrease the price to the support at 37800
❓ Are you bullish or bearish on US30? Share your thoughts in the comments👇
➡️ TRADE WITH FBS
@fbsanalytics
@fbsanalytics
Please open Telegram to view this post
VIEW IN TELEGRAM
👍52❤15❤🔥5🔥5⚡4🆒2🦄2🤩1💯1🍾1
#TradeIdea
👉 🇪🇺 🇻🇦 👈 EURUSD Outlook!
📊 On the M30 chart, EURUSD has formed a double bottom pattern and bounced from the 1.0730 support level. The price action suggests two possible scenarios:
🔼 If EURUSD breaks above the resistance at 1.0760, it could indicate a trend reversal with potential growth towards 1.0780 and even 1.0800.
🔽 However, if the price falls below the support at 1.0730, it may decline towards the 1.0700 level.
❓ Are you bullish or bearish on EURUSD? Share in the comments. 👇
➡️ TRADE WITH FBS
@fbsanalytics
@fbsanalytics
Please open Telegram to view this post
VIEW IN TELEGRAM
❤48👍38🔥11⚡4✍4💯3❤🔥2👎2🆒2🦄2😈1
#TradeIdea
👉 🇻🇦 🇨🇦 👈 USDCAD Outlook!
🕯 In the H4 timeframe, USDCAD approached a vital resistance area again, testing it for the third time.
🔼 If the price manages to break the resistance at 1.3530, USDCAD will rush up to 1.3620 level
🔽 Otherwise, the price may bounce off the resistance again and fall to 1.3420
❓ What do you think the USDCAD is bullish or bearish today? Share your opinion in the comments👇
➡️ TRADE WITH FBS
@fbsanalytics
@fbsanalytics
Please open Telegram to view this post
VIEW IN TELEGRAM
👍54❤10🔥9❤🔥5🆒4👎3🙏3🤩2🌭1👨💻1
#education
🔻 Retracement or Extension?
1️⃣ Fibonacci retracement levels use horizontal lines to indicate where support and resistance are likely to occur based on the Fibonacci sequence. This can help determine potential entry and exit points in a trade
2️⃣ All you need to do is to select a Fibo Retracement tool in MT4 or MT5, then put the start on the lowest point of the price movement (swing low) and the next on the highest (swing high). It's valid for an uptrend and does the opposite for a downtrend.
📈📉📈📉📈📉
1️⃣ On the other hand, Fibonacci extension levels use the same technology to indicate where the price could move after retracing to a certain level. This can help set Take Profit and Stop Loss levels.
2️⃣ To set it up, you need to put a point on a swing low, then on a swing high, and then on the movement's retracement (or on the 50 Fibo Retracement level). As a result, you will get a set of predicted levels where the price may move.
Want to know more about Fibonacci? You can check it out here👇
🔻 Retracement or Extension?
1️⃣ Fibonacci retracement levels use horizontal lines to indicate where support and resistance are likely to occur based on the Fibonacci sequence. This can help determine potential entry and exit points in a trade
2️⃣ All you need to do is to select a Fibo Retracement tool in MT4 or MT5, then put the start on the lowest point of the price movement (swing low) and the next on the highest (swing high). It's valid for an uptrend and does the opposite for a downtrend.
📈📉📈📉📈📉
1️⃣ On the other hand, Fibonacci extension levels use the same technology to indicate where the price could move after retracing to a certain level. This can help set Take Profit and Stop Loss levels.
2️⃣ To set it up, you need to put a point on a swing low, then on a swing high, and then on the movement's retracement (or on the 50 Fibo Retracement level). As a result, you will get a set of predicted levels where the price may move.
Want to know more about Fibonacci? You can check it out here👇

👍117🔥40❤34✍12❤🔥12👎4👀3🤩2🤮2🤣2🌭1
#MarketNews
🙌 Happy Wednesday, dear traders! Let's check the news moving the financial markets today:
📉 Citigroup Inc. strategists warn that the overwhelmingly bullish investor sentiment towards US technology stocks is precarious, as even a minor selloff could cascade into a broader market downturn. Currently, the US500 is valued at $4958.
🏳️ According to Blinken, the United States has no plans to cease its strikes in the Middle East.
🥈 CNBC predicts that the demand for silver will nearly reach record-high levels of 1.2 billion ounces in 2024, and suggests that silver may exhibit more robust performance this year compared to gold. The current price of silver (XAGUSD) is $22.286.
🛢 A peak in global oil demand is projected for the first time in this decade, with India expected to lead the growth in global oil demand from 2024 to 2030. Currently, XBRUSD is at $78.42.
🇨🇦 Canadian building permits hit a three-year low in December 2023, dropping 14% to 9.25 billion Canadian dollars ($6.83 billion), signaling concerns about pent-up housing demand.
🇨🇳 Chinese companies conducted the most significant buyback in 3 years, totaling $4.5 billion. This was accompanied by Beijing's support for the Chinese stock market, leading to the most robust stock growth in two years.
🇯🇵 The Bank of Japan may abandon its hostile interest rate policy as early as March and raise rates several times this year amid accelerating wage growth and stable economic inflation.
❓ What exciting trades are on your radar today? Share your thoughts in the comments! 👇
➡️ TRADE WITH FBS
@fbsanalytics
🛢 A peak in global oil demand is projected for the first time in this decade, with India expected to lead the growth in global oil demand from 2024 to 2030. Currently, XBRUSD is at $78.42.
@fbsanalytics
Please open Telegram to view this post
VIEW IN TELEGRAM
👍69❤17🔥9❤🔥3👎3🍾2🤩1🤮1🤓1🆒1🦄1
#TradeIdea
👉 🇻🇬 🇻🇦 👈 GBPUSD Outlook!
👀 The GBPUSD pair, after breaking and falling below the level of 1.2600, recovered and resumed growth, which creates the possibility of a reversal.
🔼 If the price holds above the support area of 1.2600, we can expect growth to the levels of 1.2720 and even 1.2780
🔽 However, if GBPUSD falls again, the target will be 1.2500
❓ Are you bullish or bearish on GBPUSD? Share in the comments 👇
➡️ TRADE WITH FBS
@fbsanalytics
@fbsanalytics
Please open Telegram to view this post
VIEW IN TELEGRAM
👍49❤🔥28❤11🔥5🤮5🆒5✍3🤩2👌1🐳1🍾1
#TradeIdea
👉 🇦🇺 🇻🇦 👈 AUDUSD Analysis!
📊 In the H1 timeframe, AUDUSD has completed a head and shoulders pattern, signaling a bullish trend for this asset.
🔼 Further continuation of the bullish trend will lead the asset to the target of 0.6570.
🔽 However, a price decline below the support at 0.6510 will open the path to 0.6470.
🤔 Are you on the bullish or bearish side?
➡️ TRADE WITH FBS
@fbsanalytics
@fbsanalytics
Please open Telegram to view this post
VIEW IN TELEGRAM
👍60❤17🔥7❤🔥5👎3🎉3🆒3🤩1😍1🌚1🦄1
#TradeIdea
👉 🇦🇺 🇯🇵 👈 AUDJPY Analysis!
☄️ AUDJPY has formed a symmetrical triangle pattern, and the price is near the upper trend line. Despite the bullish pattern, there is still uncertainty in the market.
🔼 A break of the upper trend line and resistance at 96.700 will open the way to the 97.100 level
🔽 At the same time, a break of the lower trendline and support at 96.500 will drop the price to 96.200
🧐 Are you on the bullish or bearish side? Share your opinion in the comments👇
➡️ TRADE WITH FBS
@fbsanalytics
@fbsanalytics
Please open Telegram to view this post
VIEW IN TELEGRAM
👍52❤10👎6❤🔥5🥰4⚡2🤮2🦄1
#TradeIdea
👉 🥇 🇻🇦 👈 XAUUSD Outlook!
👁 On the H1 chart, XAUUSD tests a critical support zone around the 2030 level. Future price action could unfold in two possible scenarios:
🔽 If the price breaks below the support level at 2030.00, it may target the next support level at 2020.00.
🔼 Conversely, if bullish momentum prevails and drives the price upward, the next target could be 2040.00.
❓ Do you expect a bullish or bearish move? Share in the comments.👇
➡️ TRADE WITH FBS
@fbsanalytics
@fbsanalytics
Please open Telegram to view this post
VIEW IN TELEGRAM
👍55🔥44❤21🆒5🦄5👏1
👋🏻 Good evening, fellow traders! 🤔We would like to know which risk management method do you find most effective:
Anonymous Poll
58%
❌ Using Stop Losses
26%
📈 Trend following
8%
🔀 Martingale strategy
4%
➗Value averaging
5%
🔐 Other
🔥89👍39❤12💯9👎7🆒7❤🔥6🤮4✍2🎉1🤩1
#MarketNews
👋 Hello, dear traders! Today is Thursday, February 8, 2024. Let's quickly delve into the key financial highlights of the day:
☄️ Morgan Stanley has been fined for leaking information about blockchain trading to favored clients. This case highlights the complex interplay between privacy, market fairness, and legal boundaries in financial trading.
🔔 The German court ruled, setting Intel (#INTEL) in patent mode by prefacing some chips with the R2 semiconductor overvoltage regulator. Intel shares fell 0.2%.
➡️ Disney (#DISNEY) reported better-than-expected earnings, buoyed by cost cuts and theme park success, despite mixed results in streaming and media, and announced a bullish profit outlook and strategic investments. Shares rose 6.71%.
🇰🇪 Kenya launched a $2 billion bond buyback and announced plans for a new bond sale to refinance debt as yields on existing Eurobonds fell significantly.
🇨🇳 China's passenger car sales fell 14.1% in January from the previous month, while sales of battery electric vehicles fell 37% amid ongoing price wars between automakers.
✨ Siemens (#SIE) beat first-quarter profit expectations thanks to solid performance from its Mobility and Smart Infrastructure divisions amid the global economic slowdown. Siemens shares rose 0.47%.
🔥 Microsoft (#MICROSOFT) has partnered with Indian startup Sarvam AI to develop voice-based generative artificial intelligence tools. Microsoft shares jumped 2.11% after the news.
🛢 Oil prices rose thanks to gains in global stocks and tensions in the Middle East. Brent crude approached $80, marking the longest winning streak since September amid geopolitical risks and OPEC+ supply cuts.
🥇 Gold prices remain between $2,000 and $2,050, awaiting further cues on interest rates amid robust US economic data and hawkish comments from the Federal Reserve.
That's it for today, guys! Click on ❤️if you liked our review, and see you soon!
➡️ TRADE WITH FBS
@fbsanalytics
🛢 Oil prices rose thanks to gains in global stocks and tensions in the Middle East. Brent crude approached $80, marking the longest winning streak since September amid geopolitical risks and OPEC+ supply cuts.
That's it for today, guys! Click on ❤️if you liked our review, and see you soon!
@fbsanalytics
Please open Telegram to view this post
VIEW IN TELEGRAM
❤70👍38🔥11❤🔥6⚡4✍3👎3🤩2💩2🍾2🆒2
#TradeIdea
👉 🇪🇺 🇨🇦 👈 EURCAD Outlook!
🕯 EURCAD continues its downward movement and is sandwiched between the upper trendline and the support level 1.4500, corresponding to 61.8 Fibonacci.
🔼 If the price breaks the trend line, the upside could reach the resistance at 1.4570
🔽 However, if the price breaks the support at 1.4500, the decline can be expected to reach the level of 1.4400
❓ What do you think the EURCAD is bullish or bearish today?
➡️ TRADE WITH FBS
@fbsanalytics
@fbsanalytics
Please open Telegram to view this post
VIEW IN TELEGRAM
❤35👍13🆒5✍4❤🔥3🔥3🤮3🍾2🦄2👎1🥰1
#TradeIdea
👉 🇻🇦 🇯🇵 👈 USDJPY Outlook!
📊 USDJPY is testing a critical resistance level at 148.800. Let's examine the further developments on the chart.
🔼 If USDJPY breaks through the resistance, it will pave the way to the target of 149.300.
🔽 However, a corrective move could bring the asset down to the 38.2% Fibonacci level and 147.800.
🤠 Are you on the bullish or bearish side? Share your opinion in the comments.👇
➡️ TRADE WITH FBS
@fbsanalytics
@fbsanalytics
Please open Telegram to view this post
VIEW IN TELEGRAM
👍64❤10🔥7🆒5🦄3❤🔥2👎2🤩2🤮1🍾1
#TradeIdea
👉 🇪🇺 🇻🇦 🛸 👈 EURUSD Alert!
📉 On the M30, EURUSD bounced from the 1.0800 resistance area and broke the trendline.
🔽 Trade: Sell EURUSD on a breakout below 0.0760
🎯TP: 0.0720
Smash ❤️ if you trade EURUSD today!
➡️ TRADE WITH FBS
@fbsanalytics
🎯TP: 0.0720
Smash ❤️ if you trade EURUSD today!
@fbsanalytics
Please open Telegram to view this post
VIEW IN TELEGRAM
👍98❤30🔥12❤🔥9👎8🆒6⚡4🤮4✍2👌2🦄2
#education
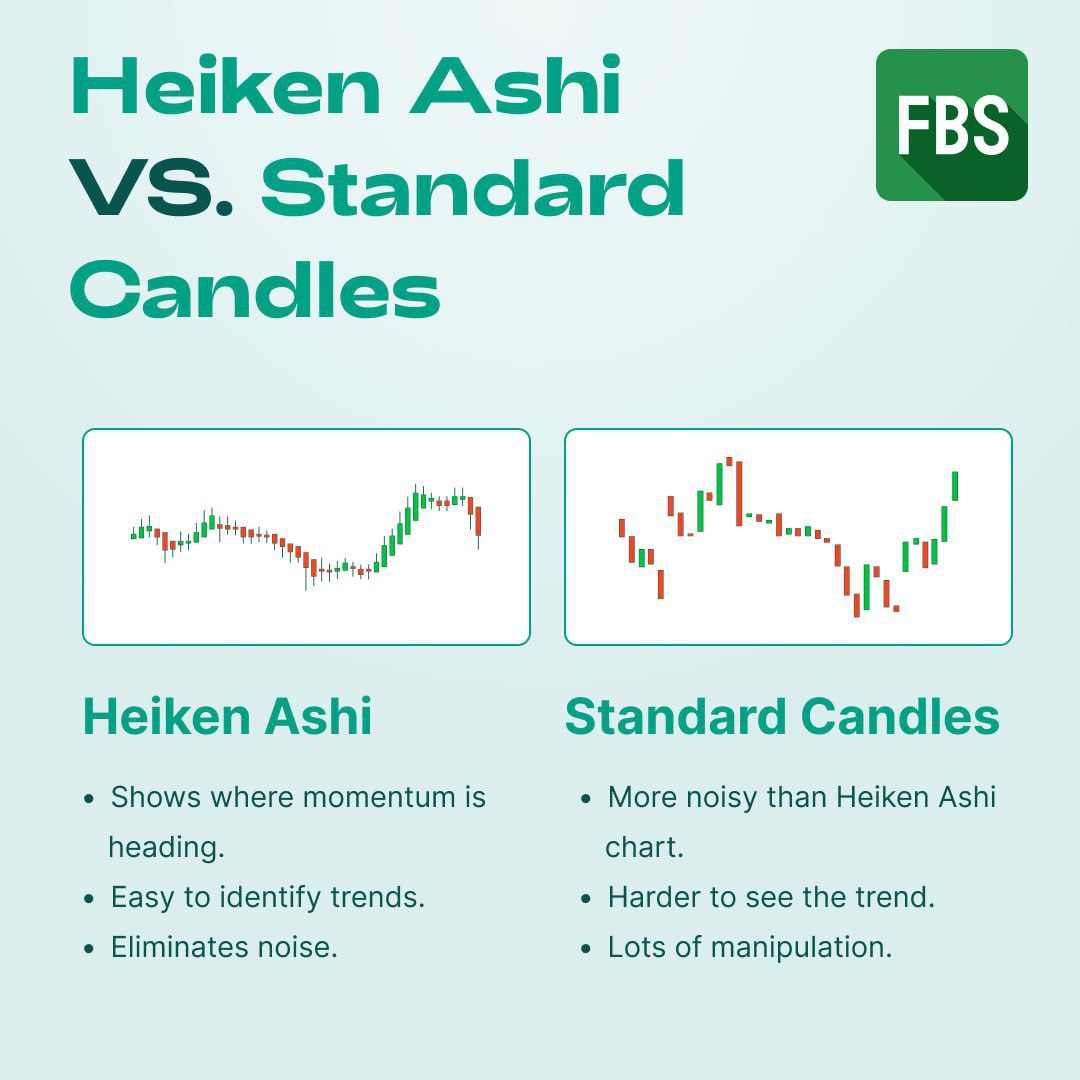
🔻 Japanese Candles vs. Heiken Ashi
📈 Japanese Candlesticks are the most commonly used charting method. They show the open, high, low, and close of a trading session. This type of chart is great for determining patterns and identifying potential trends.
📉 Heiken Ashi charts are similar, but they use a modified formula to calculate price. This means that they filter out some of the market noise and can make it easier to identify trends.
📍 Both types of charts have their pros and cons, and it's up to you to decide which method works the best. Ultimately, the goal is to find a charting style that helps you in trading without relying solely on one type of analysis.
💚Find our comparison in the figure and share it with your friends!
💭Do you use Heiken Ashi? You can read more here👇
🔻 Japanese Candles vs. Heiken Ashi
📈 Japanese Candlesticks are the most commonly used charting method. They show the open, high, low, and close of a trading session. This type of chart is great for determining patterns and identifying potential trends.
📉 Heiken Ashi charts are similar, but they use a modified formula to calculate price. This means that they filter out some of the market noise and can make it easier to identify trends.
📍 Both types of charts have their pros and cons, and it's up to you to decide which method works the best. Ultimately, the goal is to find a charting style that helps you in trading without relying solely on one type of analysis.
💚Find our comparison in the figure and share it with your friends!
💭Do you use Heiken Ashi? You can read more here👇
👍82❤18🔥13✍6🆒5⚡4❤🔥3🤔3🤩3🌚2🗿2
#TradeIdea
👉 🇻🇦 🇨🇭 👈 All eyes on USDCHF!
👀 USDCHF is trending upwards within the H1 timeframe, having rebounded from the upper boundary of the channel and the resistance level of 0.8760. The next movement of the asset may unfold in two possible scenarios:
🔼 If the price breaks above the trendline and surpasses the resistance at 0.8760, it could target the level of 0.8780.
🔽 Alternatively, a potential rejection from the trendline could result in a retracement towards the support at 0.8730.
❓ Do you expect a bullish or bearish move today? Share in the comments. 👇
➡️ TRADE WITH FBS
@fbsanalytics
@fbsanalytics
Please open Telegram to view this post
VIEW IN TELEGRAM
❤58👍37🔥18❤🔥5🤩4🆒4⚡3🍾3✍2🦄2
#MarketNews
🌞 Happy Friday, dear traders! Look at the major news on this week's last trading session!
🛢 JPMorgan predicts oil prices to rise to $90 by May, driven by stronger-than-expected global economic growth and reductions in oil inventories.
💵 Before the US elections, the dollar may strengthen, but it's expected to weaken afterward. Economists suggest a Trump victory could boost the USD, while a Biden re-election might lead to a more neutral stance.
🇲🇽 As previously set, Mexico's central bank maintained its interest rate at 11.25%. The bank has signaled the possibility of future rate cuts.
📈 Chinese stocks closed higher ahead of the Chinese New Year, with mainland China markets set to be completed next week.
🌐 BlackRock's Chief Investment Officer Rick Ryder openly stated that BlackRock would buy BTC. BTCUSD is currently at $ 46 269.
🆙 The S&P500 has broken the 5000 mark for the first time. This was supported by optimistic earnings reports from some companies.
🚀 Disney's shares skyrocketed by 11.5% yesterday, driven by robust earnings and a $1.5 billion investment in Epic Games. As of now, Disney's stock is priced at $110.53.
💸 US companies plan buybacks worth $155 billion in 2024. It is forecasted that the S&P 500 will repurchase shares worth $885 billion, 10% more than in 2023 but 4% less than the record pace in 2022.
📉 #PINS stocks dropped by 9.27% and #TTWO by 9.43% following the release of their earnings reports.
😎 How was your trading week? Share your opinion in the comments! 👇
➡️ TRADE WITH FBS
@fbsanalytics
🛢 JPMorgan predicts oil prices to rise to $90 by May, driven by stronger-than-expected global economic growth and reductions in oil inventories.
@fbsanalytics
Please open Telegram to view this post
VIEW IN TELEGRAM
👍54❤15🔥9✍5🆒4⚡3🤩2❤🔥1🦄1
#TradeIdea
👉 🇪🇺 🇻🇦 👈 EURUSD Outlook!
📊 On the 1H chart, EURUSD is nearing a key resistance at 1.0790, aligned with the 38.2% Fibonacci retracement level. Potential scenarios for the asset's movement include:
🔼 A breakout above the 1.0790 resistance level may target 1.0830.
🔽 Conversely, a corrective move could bring the asset towards support at 1.0750.
Smash 👍 if you agree with the analysis!
➡️ TRADE WITH FBS
@fbsanalytics
Smash 👍 if you agree with the analysis!
@fbsanalytics
Please open Telegram to view this post
VIEW IN TELEGRAM
👍79❤21🔥9❤🔥6👎6🫡4🆒2🦄1
#TradeIdea
👉 🇪🇺 🇦🇺 🛸 👈 EURAUD is going down!
📉 On the H1, EURAUD bounced off the resistance at 1.6600 and broke above 1.6550, which corresponds to 61.8 Fibonacci.
🔽 Trade: Sell EURAUD
🎯 TP1: 1.6510
🎯 TP2: 1.6475
Smash ❤️ if you trade EURUSD today!
➡️ TRADE WITH FBS
@fbsanalytics
🎯 TP1: 1.6510
🎯 TP2: 1.6475
Smash ❤️ if you trade EURUSD today!
@fbsanalytics
Please open Telegram to view this post
VIEW IN TELEGRAM
👍83❤32🍾9🔥7❤🔥5🆒4👏3🐳3🦄3🤩2👎1