
FBS Analytics
Join now for Gold and EURUSD analysis
Please open Telegram to view this post
VIEW IN TELEGRAM
❤30👍20🔥7🤩6👎5❤🔥3✍2🐳1
☄️ US inflation release
⚡️ Monthly CPI
Actual — 0.4%
Forecast — 0.3%
Previous — 0.3%
⚡️ Annual CPI
Actual — 3.1%
Forecast — 2.9%
Previous — 3.4%
⚡️ Monthly Core CPI
Actual — 0.3%
Forecast — 0.2%
Previous — 0.3%
⚡️ Monthly CPI
Actual — 0.4%
Forecast — 0.3%
Previous — 0.3%
⚡️ Annual CPI
Actual — 3.1%
Forecast — 2.9%
Previous — 3.4%
⚡️ Monthly Core CPI
Actual — 0.3%
Forecast — 0.2%
Previous — 0.3%
❤82👍46🔥16🤯11🎉7🆒7⚡6👀6👎5🐳4🌚4
#education
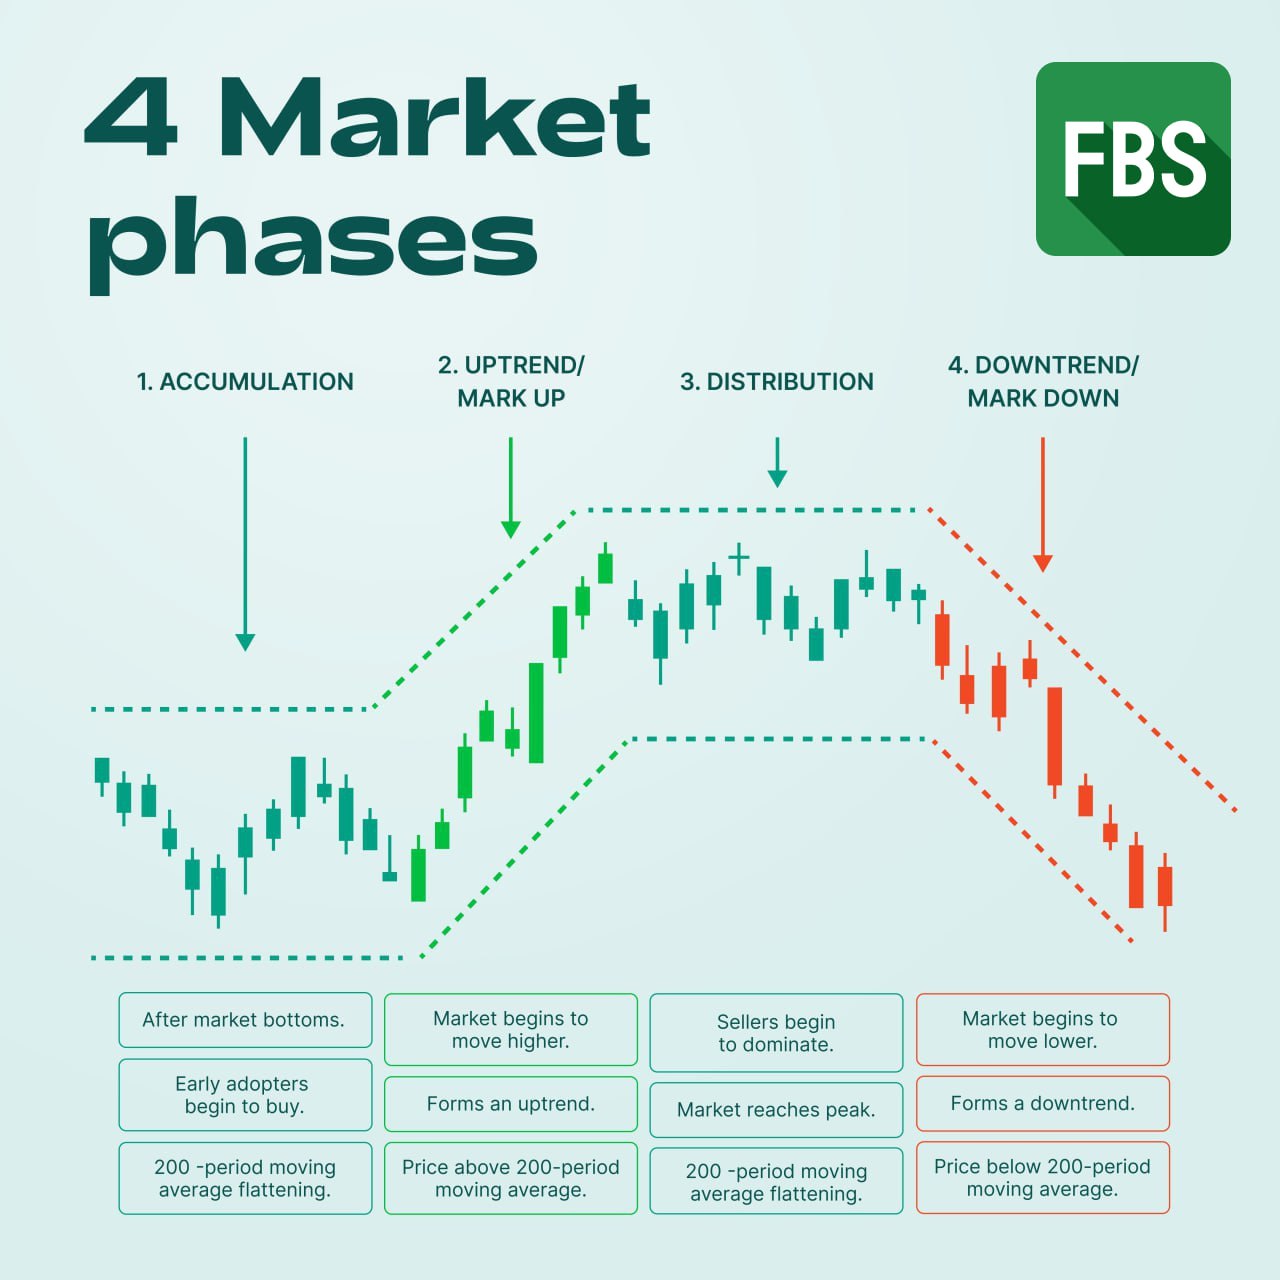
💸 Here are four market phases that you can use to spot when smart money is entering/ exiting the game
🔋 First up is the accumulation phase. During this phase, prices are low, and smart money investors are starting to accumulate the asset. This is the phase where the market is building a base before an uptrend, the absolutely best time to enter (Buy)
📈 The uptrend phase (or markup) is the second phase, where prices rise. This is when the market is making higher highs and higher lows, and more and more investors start to jump in. This is the phase where you want to be long (in the Buy trade)
🤑 The third phase is the distribution phase. During this phase, prices are high, and smart money investors start to sell their holdings. Be ready to Sell here!
📉 The final phase is the downtrend (or mark down) phase, where prices fall. This is when the market makes lower lows and lower highs, and investors panic and sell. We hope you sold everything earlier.
✅ Remember, the market is building a base before a trend in the accumulation and distribution phases. In the uptrend and downtrend phases, the market is making higher highs or lower lows, respectively.
📍 Share this post with your friends and save it to find the same pattern on the chart!
💸 Here are four market phases that you can use to spot when smart money is entering/ exiting the game
🔋 First up is the accumulation phase. During this phase, prices are low, and smart money investors are starting to accumulate the asset. This is the phase where the market is building a base before an uptrend, the absolutely best time to enter (Buy)
📈 The uptrend phase (or markup) is the second phase, where prices rise. This is when the market is making higher highs and higher lows, and more and more investors start to jump in. This is the phase where you want to be long (in the Buy trade)
🤑 The third phase is the distribution phase. During this phase, prices are high, and smart money investors start to sell their holdings. Be ready to Sell here!
📉 The final phase is the downtrend (or mark down) phase, where prices fall. This is when the market makes lower lows and lower highs, and investors panic and sell. We hope you sold everything earlier.
✅ Remember, the market is building a base before a trend in the accumulation and distribution phases. In the uptrend and downtrend phases, the market is making higher highs or lower lows, respectively.
📍 Share this post with your friends and save it to find the same pattern on the chart!
👍117❤31🔥15❤🔥8🤩7👀6✍4🏆4🍾4👎2🐳1
#MarketNews
☀️ Happy Wednesday, dear traders! Let's check the news moving the financial markets today:
☄️ Investors see a Fed rate cut in May less likely amid strong US inflation figures.
🇬🇧 The looming election and fiscal concerns are spotlighting Britain's challenged markets, stirring debates among investors over the undervaluation amid potential government changes and anticipated interest rate cuts.
📈 Nvidia (#NVIDIA) is more expensive than Amazon for the first time since 2002. The company became America's fourth most valuable and fifth most valuable globally. Nvidia shares rose 0.49%.
🤔 Jeff Bezos sold $4 billion worth of Amazon (#AMAZON) shares over the past week, following his intention to sell up to 50 million shares over the year, similar to the active sales of 2021.
📉 Asian stocks fell due to the US CPI shock, with the Nikkei retreating from a 34-year high. Most Asian stocks fell following an overnight decline on Wall Street after disappointing US inflation data reignited fears of higher interest rates for longer.
🔝 Sony's (#SONY) Q3 profit surged 10% to 463.3 billion yen, outperforming estimates with financial solid, movies, and music sectors, and plans to list its financial business in 2025. The share price rose 0.15% today.
🛢Oil prices dipped following reports of a substantial increase in US crude inventories and elevated inflation figures. However, due to refinery maintenance, the decline mitigated geopolitical tensions and tight US fuel supplies.
🥇 Gold prices fell below the $2,000 mark after the Consumer Price Index report for January raised concerns about the Federal Reserve's prolonged high-interest rate environment.
That's it for today, guys! Click on ❤️if you liked our review, and see you soon!
➡️ TRADE WITH FBS
@fbsanalytics
🛢Oil prices dipped following reports of a substantial increase in US crude inventories and elevated inflation figures. However, due to refinery maintenance, the decline mitigated geopolitical tensions and tight US fuel supplies.
That's it for today, guys! Click on ❤️if you liked our review, and see you soon!
@fbsanalytics
Please open Telegram to view this post
VIEW IN TELEGRAM
👍54❤33🔥7❤🔥5⚡3🐳3✍2🙏2🍾1🆒1🦄1
#TradeIdea
👉 🇻🇬 🇻🇦 👈 GBPUSD Analysis!
👀 GBPUSD, after falling sharply and breaking several vital levels, has dropped to support, creating two potential scenarios:
🔽 If GBPUSD consolidates below the 1.2550 support, we can expect a further drop to the 1.2500 level
🔼 However, with a possible rebound, the price will return to 1.2600 resistance
❓ What do you think the GBPUSD is bullish or bearish today? Share your opinion in the comments👇
➡️ TRADE WITH FBS
@fbsanalytics
@fbsanalytics
Please open Telegram to view this post
VIEW IN TELEGRAM
❤35👍31❤🔥6🔥5👏4🆒4🤩3🦄3😎2🐳1🍾1
#TradeIdea
👉 💵 🇻🇦 👈 All eyes on XBRUSD!
👁🗨 XBRUSD is following an upward trend and is currently testing the resistance level at 82.50. Possible future movements for the asset include:
🔼 A breakthrough above the resistance level of 82.50, continuing the trend towards 83.40.
🔽 A corrective break below the trend line resulted in a pullback to the target of 81.00.
❓ Are you bullish or bearish on XBRUSD? Share your thoughts in the comments. 👇
➡️ TRADE WITH FBS
@fbsanalytics
@fbsanalytics
Please open Telegram to view this post
VIEW IN TELEGRAM
👍28🔥9❤8❤🔥3✍2👎2🤩2😁1🍌1🆒1
#TradeIdea
👉 🥇 🇻🇦 👈 XAUUSD Outlook!
⚡️ On the H1, XAUUSD fell sharply after releasing the US inflation data, and now the price is consolidating in a narrow range.
🔼 If the resistance of 1996 is broken, gold may rise to the level of 2012 and recover to the resistance of 2026 in case of a further breakdown
🔽 However, if XAUUSD continues to fall and breaks the support of 1988, the target will be at the level of 1975
❓ Are you on the bullish or bearish side?
➡️ TRADE WITH FBS
@fbsanalytics
@fbsanalytics
Please open Telegram to view this post
VIEW IN TELEGRAM
👍88❤22🔥22🤩4👌4😍4✍3🆒3❤🔥2⚡2🌭1
#TradeIdea
👉 🇪🇺 🇻🇦 👈 EURUSD Outlook!
📊 On the M30 chart, EURUSD has formed a double bottom pattern and bounced from the trendline and 1.0700 support level. The price action suggests two possible scenarios:
🔼 If EURUSD breaks above the resistance at 1.0720, it could indicate a potential growth towards 1.0750.
🔽 However, if the price falls below the support level 1.0700, it may decline towards the 1.0670 level.
❓ Are you bullish or bearish on EURUSD? Share in the comments 👇
➡️ TRADE WITH FBS
@fbsanalytics
@fbsanalytics
Please open Telegram to view this post
VIEW IN TELEGRAM
👍53❤15🔥8❤🔥4🦄4✍3🤩3🆒2
#Survey
🌟 We Want to Know Your Opinion! 🌟 Which oscillator do you find most effective for your trading strategy?
🌟 We Want to Know Your Opinion! 🌟 Which oscillator do you find most effective for your trading strategy?
Anonymous Poll
53%
Relative Strength Index (RSI) 💪🏼
13%
Stochastic Oscillator 📈
17%
MACD (Moving Average Convergence/Divergence) 〰️
5%
Awesome Oscillator 💎
3%
CCI (Commodity Channel Index) 💸
3%
Momentum Oscillator 💡
6%
Other (please specify in the comments) 👇
❤48👍24🔥15❤🔥6🍾5✍4💯4🆒4🦄4🥴3🌭3
🎉 Happy Birthday to FBS! Celebrate 15 years of trust with us – Join a Giveaway🎉
🔔 The FBS birthday giveaway!!!
📅 From February 14 till February 29
📌How to join:
1. Open an FBS account and subscribe to FBS Instagram page
2. Publish a post about your trading journey on your Instagram profile (your profile should be public during the giveaway)
3. Add a hashtag #HappyBirthdayFBS
4. Join a stream hosted by Andreas Thalassinos & try to get your prize
🎁 15 iPhones 15 Pro Max raffled during stream🎁
Share your experience and join a stream on February 29, where a brilliant trading educator, Andreas Thalassinos will unveil secrets of trading and unique risk management techniques that few know, as well as announce those who will get their iPhone 15 Pro Max.
Let’s celebrate 15 years of reliability, support & trust by 27 million FBS traders. And tell everyone about your story on financial markets.
🔔 The FBS birthday giveaway!!!
📅 From February 14 till February 29
📌How to join:
1. Open an FBS account and subscribe to FBS Instagram page
2. Publish a post about your trading journey on your Instagram profile (your profile should be public during the giveaway)
3. Add a hashtag #HappyBirthdayFBS
4. Join a stream hosted by Andreas Thalassinos & try to get your prize
🎁 15 iPhones 15 Pro Max raffled during stream🎁
Share your experience and join a stream on February 29, where a brilliant trading educator, Andreas Thalassinos will unveil secrets of trading and unique risk management techniques that few know, as well as announce those who will get their iPhone 15 Pro Max.
Let’s celebrate 15 years of reliability, support & trust by 27 million FBS traders. And tell everyone about your story on financial markets.

❤200👍70🔥23🍾15👎12🆒11❤🔥6😁5⚡4👏2🤩2
FBS Analytics pinned «🎉 Happy Birthday to FBS! Celebrate 15 years of trust with us – Join a Giveaway🎉 🔔 The FBS birthday giveaway!!! 📅 From February 14 till February 29 📌How to join: 1. Open an FBS account and subscribe to FBS Instagram page 2. Publish a post about your trading…»
#MarketNews
☀️ Happy Thursday, dear traders! Let's check the news moving the financial markets today:
👩💻 Cisco provided a weak quarterly and annual outlook, attributing it to decreased customer orders from its service provider. The company plans to reduce its global workforce by 5% (4000 jobs) through layoffs. Cisco's stock price is $50.24.
🕊 Canada, Australia, and New Zealand have called on Israel to cancel its operation in Rafah.
🔥 The European Union plans not to renew the gas transit agreement with Russia via Ukraine, which is set to expire at the end of 2024. The current price of natural gas (XNGUSD) stands at $1.668.
🛫 Airbus (#AIR) reported fourth-quarter revenue of 22.89 billion euros, beating estimates of 22.46 billion euros. The company plans to deliver about 800 aircraft in 2024, slightly below its 826 aircraft.
📉 The German government has lowered its GDP growth forecast for Germany in 2024 to 0.2%. Analysts indicate an increasing likelihood of a recession in Germany within the next 12 months.
🇯🇵 Japan's economy has entered a recession, yet its stocks are near historical highs. The JP225 index stands at 38 117 JPY.
💻 Nvidia has risen to third in the list of the most valuable companies in the US. Nvidia's stock price is $738.56.
🏠 The rate for a 30-year fixed mortgage in the US has risen to a two-month high. Mortgage applications have been declining since mid-January.
❓ What exciting trades are on your radar today? Share your thoughts in the comments! 👇
➡️ TRADE WITH FBS
@fbsanalytics
@fbsanalytics
Please open Telegram to view this post
VIEW IN TELEGRAM
👍58❤20🔥9❤🔥3🆒3🦄3🤔1🤩1🙏1💯1
#TradeIdea
👉 💵 🇻🇦 👈 XBRUSD Outlook!
⚡️ On the H1 chart, XBRUSD tests a support zone at 81.00, aligning with the 38.2% Fibonacci level. Here are the potential scenarios:
🔼 If XBRUSD rebounds from the 81.00 support, it will aim for the 82.00 resistance level.
🔽 However, if Brent breaks below this support zone, it could lead to a descent towards 79.00 and the Fibonacci golden ratio.
🤔 Are you bullish or bearish on this setup? Share your insights in the comments below.👇
➡️ TRADE WITH FBS
@fbsanalytics
@fbsanalytics
Please open Telegram to view this post
VIEW IN TELEGRAM
👍30❤15🔥10❤🔥3🤩2🤣1🍾1🆒1🦄1
#TradeIdea
👉 🗽 🕛 US500 may go up!
📈 US500 is moving in an ascending channel, and after bouncing off the lower trend line, the price continues to rise again. In addition, the price has overcome the critical level of 5000, which is a signal for recovery.
🔼 Trade: Buy US500
🎯 TP: 5053
Smash 👍 if you're agree with the analysis!
➡️ TRADE WITH FBS
@fbsanalytics
🎯 TP: 5053
Smash 👍 if you're agree with the analysis!
@fbsanalytics
Please open Telegram to view this post
VIEW IN TELEGRAM
❤50👍35🔥7🆒6✍4⚡3❤🔥3🐳3🍾3👏2🌭2
#TradeIdea
👉 🇻🇬 🇻🇦 👈 GBPUSD Outlook!
📊 GBPUSD is currently testing the trend line coinciding with the support level of 1.2550. The future movement of an asset can develop in one of two ways:
🔽 If it breaks the 1.2550 support level, a fall to 1.2520 could be on the horizon.
🔼 If a correction occurs, the price may rebound to the resistance level of 1.2600.
❓ Are you bullish or bearish on GBPUSD? Share in the comments. 👇
➡️ TRADE WITH FBS
@fbsanalytics
📊 GBPUSD is currently testing the trend line coinciding with the support level of 1.2550. The future movement of an asset can develop in one of two ways:
@fbsanalytics
Please open Telegram to view this post
VIEW IN TELEGRAM
❤39👍29🔥9❤🔥6🆒5🤩2🦄2😁1
#TradeIdea
👉 🇻🇦 🇨🇦 👈 All eyes on USDCAD!
📊 On the H4, USDCAD broke a critical level, but the bulls could not hold the price, and it is testing the support area of 1.3530 again.
🔼 If the price breaks the support at 1.3530, we can expect a fall to 1.3430
🔽 However, if the price bounces off the support, it may rise to 1.3620
🧐 Are you on the bullish or bearish side? Share your opinion in the comments👇
➡️ TRADE WITH FBS
@fbsanalytics
@fbsanalytics
Please open Telegram to view this post
VIEW IN TELEGRAM
❤34👍20🔥12❤🔥3🆒3✍1🤩1🦄1
#education
🪙 The next reserve currency?
⚠️ For over 500 years, the world has seen a succession of reserve currencies held by various countries. Here's how it was:
🇵🇹 The Portuguese were the first to set the trend, with their currency being the world's reserve currency between 1450 and 1530. Portuguese real was in demand as the country dominated world trade and exploration
🇪🇸 Spain took over as the world's reserve currency from 1530 to 1640 as they became dominant in world trade and held vast amounts of gold and silver.
🇳🇱 The Dutch took over from 1640 to 1720 because of their economic and financial strength, including their dominance in the financial industry.
🇫🇷 France's currency took over from 1720 to 1815, largely due to their military and economic power.
🇬🇧 After Napoleon's defeat, the British pound took the leadership from 1815 to 1920 due to Britain's status as the world's economic powerhouse and its vast colonial empire.
🇺🇸 The United States then became the boss from 1920 to the present day. This change occurred mainly due to the growth of the US economy after World War I and the United State's role as a dominant military power.
🇨🇳 However, China is about to take the US's place, with its yuan becoming the next candidate.
❓ What do you think, will it happen?
➡️ TRADE WITH FBS
@fbsanalytics
@fbsanalytics
Please open Telegram to view this post
VIEW IN TELEGRAM
❤84👍40🔥13❤🔥6🍾6🆒4🎉3🤩2🤣2👀2⚡1
#MarketNews
☀️ Happy Friday, dear traders! This week was intense, and we hope you enjoyed it! Let's take a look at our end-of-week news!
🚀 SpaceX has launched a rocket carrying a US firm's spacecraft to land on the moon. The landing is expected to take place on February 22. A US spacecraft has yet to land in integrity on the moon since 1972.
🇬🇧 Britain entered a mild recession in the second half of 2023, failing to fulfill Prime Minister Rishi Sunak's promises of economic growth, with GDP contracting more sharply than expected.
🇺🇸 Many US banks significantly increased their commercial real estate loan portfolios, crossing the threshold of increased regulatory scrutiny due to potential risks.
🛢 Oil prices have risen significantly amid surging stock markets and OPEC+'s commitment to increase supply despite the International Energy Agency's gloomy demand outlook.
🤔 Jeff Bezos recently sold about $2.03 million worth of Amazon (#AMAZON) shares, marking the third significant sale of Amazon stock this month, with total sales exceeding $6 billion. The stock price is down 0.69%.
📈 Elon Musk has more than doubled his stake in Tesla (#TESLA), now owning a 20.5% stake in the company, valued at more than $120 billion. Tesla shares have gained 6.22% recently.
🔔 Nike (#NIKE) announced it will cut about 2% of its workforce, equivalent to more than 1,600 jobs, as part of a cost-cutting initiative amid worsening profit forecasts.
🥇 Gold prices broke through the $2,000 an ounce mark after weak US retail sales data, but many experts believe the metal is poised for its worst weekly losses since early December.
❓ How was your trading week? Share your opinion in the comments👇
➡️ TRADE WITH FBS
@fbsanalytics
🛢 Oil prices have risen significantly amid surging stock markets and OPEC+'s commitment to increase supply despite the International Energy Agency's gloomy demand outlook.
@fbsanalytics
Please open Telegram to view this post
VIEW IN TELEGRAM
👍60❤17🔥11❤🔥5✍3⚡1👏1🆒1🦄1
#TradeIdea
👉 🇪🇺 🇻🇦 👈 EURUSD Outlook!
📊 EURUSD has formed a double-bottom pattern enclosed in a bullish rising wedge. The price action suggests two possible scenarios:
🔼 If EURUSD breaks above the resistance at 1.0780, it could indicate a trend reversal with potential growth towards 1.0840.
🔽 However, the correction move may cause the asset to decline towards the 1.0700 level.
❓ Are you bullish or bearish on EURUSD? Share in the comments. 👇
➡️ TRADE WITH FBS
@fbsanalytics
@fbsanalytics
Please open Telegram to view this post
VIEW IN TELEGRAM
❤40👍29🔥5🆒4🤩2❤🔥1🌭1🦄1
#TradeIdea
👉 🇻🇦 🇯🇵 👈 USDJPY Technical Analysis!
🕯 USDJPY has formed an ascending channel; the price is near the lower trend line.
🔼 If USDJPY consolidates above the resistance at 150.600, it is expected to rise to the level of 151.900
🔽 On the other hand, if the price breaks the trend line and overcomes the support at 149.800, it will fall to 147.500
❓ What do you think the USDJPY is bullish or bearish today? Share your opinion in the comments👇
➡️ TRADE WITH FBS
@fbsanalytics
@fbsanalytics
Please open Telegram to view this post
VIEW IN TELEGRAM
👍41❤16🔥7🆒3🤩2✍1❤🔥1👏1🍾1👀1🦄1