
#TradeIdea
👉 🇻🇦 🇨🇦 👈 USDCAD Outlook!
☄️ USDCAD tests the crucial support level at 1.3480, coinciding with the golden Fibonacci ratio. Two potential scenarios could unfold:
🔼 A rebound from the support zone could propel the asset toward 1.3520.
🔽 Conversely, breaking through the 1.3480 mark could open a path to 1.3440.
❓ Are you bullish or bearish on USDCAD? Share your thoughts in the comments.👇
➡️ TRADE WITH FBS
@fbsanalytics
@fbsanalytics
Please open Telegram to view this post
VIEW IN TELEGRAM
👍50🔥13❤11❤🔥4🌚3🆒3🎉2🦄1
#education
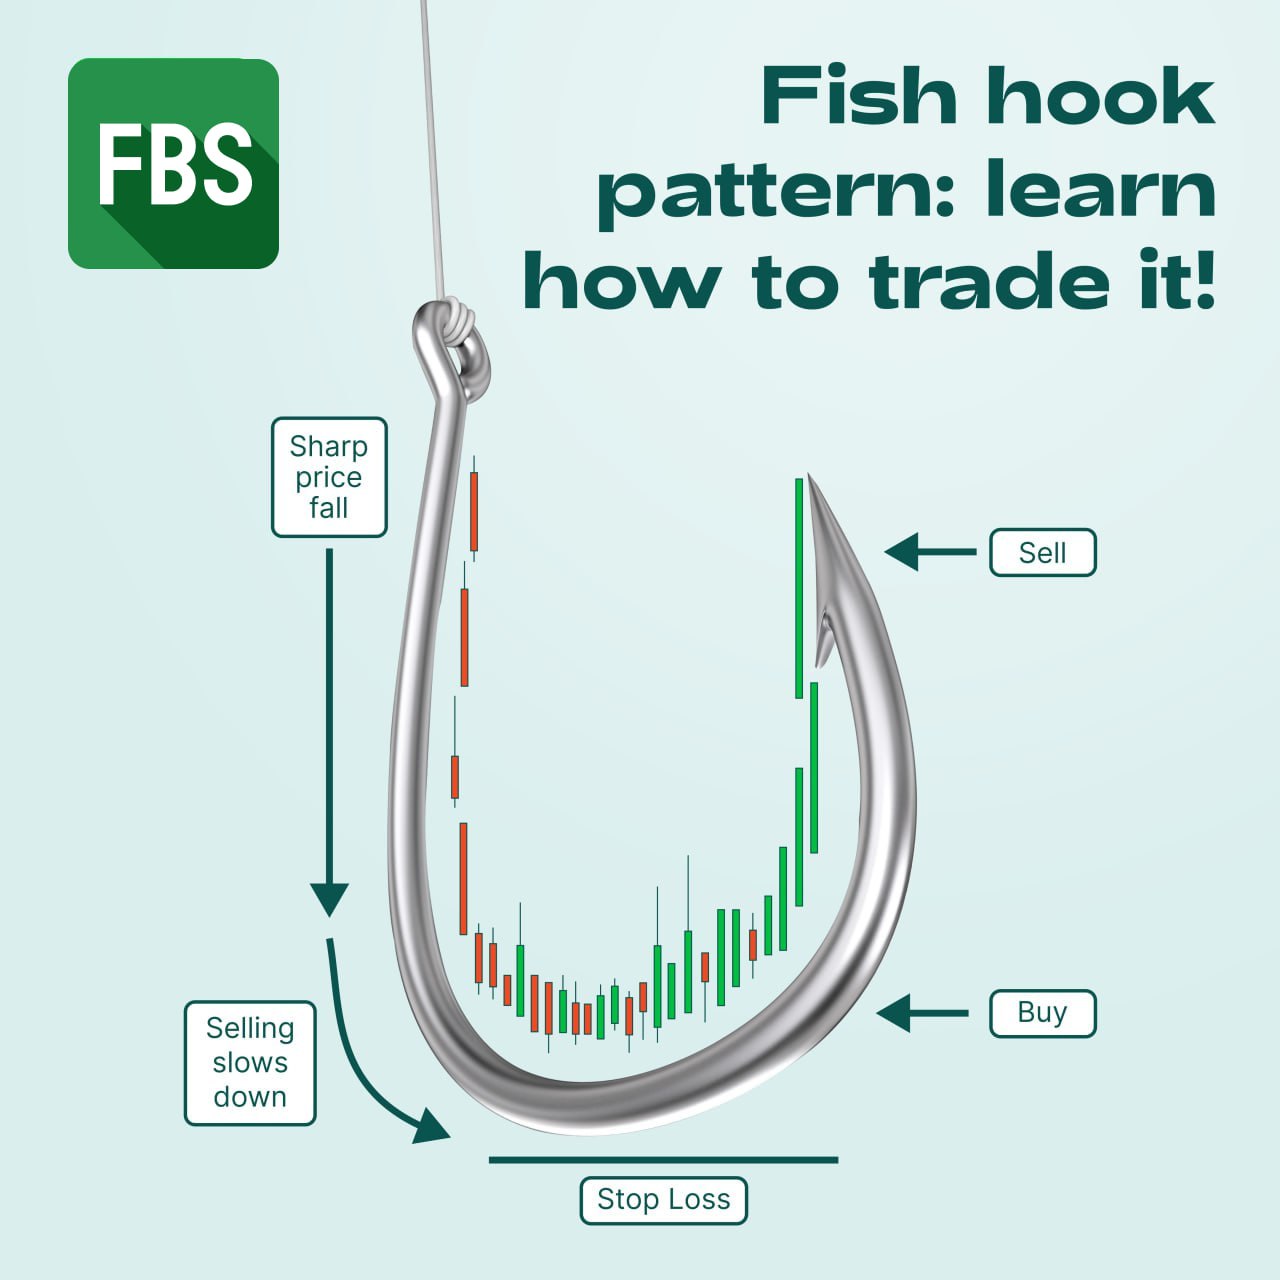
🎣 Time for fishing with a new pattern!
🐠 The fish hook pattern looks like an actual fish hook trying to catch something, so spotting it on a chart is easy. A steep drop in price followed by a sudden and sharp rise back up: that's how we can describe this pattern. You can find it on any chart, from gold and euro to stocks and crypto.
🐡 The pattern suggests the price has hit bottom and is recovering now. Traders who recognize this pattern may look for opportunities to buy at the bottom and then ride the upward momentum.
🐟 You must look for the price "rounding" after a sharp drop. Also, it would be best if the initial decline caused buyers' liquidations. That would mean that all who bought the instrument are out of the game, and the price can fly high without problems.
Would you like to know more? You'll be able to read here.👇
🎣 Time for fishing with a new pattern!
🐠 The fish hook pattern looks like an actual fish hook trying to catch something, so spotting it on a chart is easy. A steep drop in price followed by a sudden and sharp rise back up: that's how we can describe this pattern. You can find it on any chart, from gold and euro to stocks and crypto.
🐡 The pattern suggests the price has hit bottom and is recovering now. Traders who recognize this pattern may look for opportunities to buy at the bottom and then ride the upward momentum.
🐟 You must look for the price "rounding" after a sharp drop. Also, it would be best if the initial decline caused buyers' liquidations. That would mean that all who bought the instrument are out of the game, and the price can fly high without problems.
Would you like to know more? You'll be able to read here.👇
👍118❤34🔥16🍾9✍8❤🔥7🤩7🐳3👏2🆒2
#MarketNews
☀️ Happy Wednesday, dear traders! Let's check the news moving the financial markets today:
💻 Intel is negotiating a $10 billion subsidy under the Chip Act, with its shares currently valued at $44.54.
🥇 Citi forecasts gold (XAUUSD) could hit $3000 within 12-18 months, with its current price at $2030.05.
📈 Chinese stocks rise following another decisive government intervention. HK50 is up 4% and trading at 16 580 HKD.
✂️ Hedge funds have reduced their holdings in the "Magnificent Seven" mega-cap tech stocks during the fourth quarter amid signs of extreme market events. The US500 is at $4977.
🛍 Jeff Bezos has sold Amazon shares worth over $2 billion again, marking his fourth sale this month. Over the last month, he has sold more than 50 million shares. Amazon is at $167.08.
📉 NVIDIA shares fell more than 4% ahead of earnings results as investors seek confirmation the company can meet high expectations spurred by the AI boom. NVIDIA is at $694.63.
🇨🇳 On Tuesday, the People’s Bank of China lowered the five-year loan prime rate from 4.2% to 3.95%, the most significant cut since the benchmark's 2019 introduction, influencing commercial banks to adjust mortgage rates accordingly.
🌐 Interest in spot Bitcoin ETFs wanes: Wednesday saw the lowest one-day gross inflow of investors to the group since trading began on January 11. BTCUSD stands at $51 894.
That's it for today, guys! Click on ❤️if you liked our review, and see you soon!
➡️ TRADE WITH FBS
@fbsanalytics
That's it for today, guys! Click on ❤️if you liked our review, and see you soon!
@fbsanalytics
Please open Telegram to view this post
VIEW IN TELEGRAM
👍65❤45🔥11❤🔥5🎉2🆒2✍1😁1🤩1
#TradeIdea
👉 🥇 🇻🇦 👈 XAUUSD Analysis!
⭐️ XAUUSD is currently testing the 2028.00 support level and bullish trendline, with future moves potentially heading in two directions:
🔼 The rebound from the 2028 support may continue the bullish trend towards the 2040 resistance.
🔽 Alternatively, a break below this support and trendline could indicate a decline toward the 2015.00 level.
❓ Are you on the bullish or bearish side?
➡️ TRADE WITH FBS
@fbsanalytics
@fbsanalytics
Please open Telegram to view this post
VIEW IN TELEGRAM
👍77❤23🔥11❤🔥4🤗3🆒3🤔2🎉2👏1
#TradeIdea
👉 🇻🇦 🇨🇦 👈 USDCAD Outlook!
🔔 In the H4 Timeframe, USDCAD is sideways, and the price is testing the 1.3530 resistance area for the fourth time, which creates two potential scenarios:
🔼 Breaking the resistance at 1.3530 and holding above it can be expected to rise to 1.3620
🔽 However, in case of another pullback from the resistance, the price will fall back to the support at 1.3430
❓ What do you think the USDCAD is bullish or bearish today?
➡️ TRADE WITH FBS
@fbsanalytics
@fbsanalytics
Please open Telegram to view this post
VIEW IN TELEGRAM
👍48❤10🔥7🆒5✍2❤🔥2👏2🤔1
#TradeIdea
👉 🇪🇺 🇻🇦 👈 EURUSD Outlook!
📊 EURUSD has formed a bearish flag pattern and testing 1.0800 support level. The price action suggests two possible scenarios:
🔼 A bounce from the support level could signal a trend continuation, leading to growth towards 1.0830.
🔽 Conversely, a successful breach below the trendline might lead to a decline towards the 1.0770 level.
❓ Are you bullish or bearish on EURUSD? Share in the comments. 👇
➡️ TRADE WITH FBS
@fbsanalytics
@fbsanalytics
Please open Telegram to view this post
VIEW IN TELEGRAM
❤48👍34🔥7❤🔥5⚡3🆒2🤩1
#TradeIdea
👉 🇨🇦 🇯🇵 👈 CADJPY Update!
🔥 CADJPY has formed a rising wedge pattern, with the price moving for almost two months. There was a recent rebound from the resistance level, and the price tests the lower trend line.
🔼 If the price does not break the trend line, it will rush to the resistance of 111.600 again
🔽 However, if the trend line is broken and the price falls below 110.600, we can expect a bearish scenario and a fall to 109.500 and 109.000 levels
Smash👍 if you trade CADJPY!
➡️ TRADE WITH FBS
@fbsanalytics
Smash
@fbsanalytics
Please open Telegram to view this post
VIEW IN TELEGRAM
👍57❤15🔥7✍4👏4🆒4❤🔥3🥰1🌭1
❓Which type of economic news do you believe has the most significant impact on market movements? 📊
Anonymous Poll
31%
Employment reports 📈
37%
Interest rate decisions 💼
18%
Inflation figures 📉
11%
Global political events 🌍
3%
Other (please specify in the comments) 🔍
👍110❤19🔥13❤🔥10⚡7🆒5👀4👎2👏2😭2🦄2
#MarketNews
☀️ Happy Thursday, dear traders! Let's check the news moving the financial markets today!
☄️ The dollar depreciated following the publication of the Federal Reserve's January meeting minutes, which revealed the Fed's more significant concern over premature interest rate cuts than delays in reducing them.
💥 Nvidia (#NVIDIA) shares rose as the company's report, beating Wall Street expectations, confirmed its leading position as a primary beneficiary of investment in AI technology, showing no signs of slowing the AI boom. The stock jumped 9.07%.
🇺🇸 A federal judge has temporarily blocked a California law allowing the firearms industry to be sued for selling "abnormally dangerous" guns, citing a possible violation of the Constitution's defunct Commerce Clause.
💬 JPMorgan warns that the current economic situation may lead to 1970s-era stagflation, characterized by high inflation and low growth, which would be terrible news for stocks.
🇯🇵 The Nikkei 225 stock index hit a record high, surpassing its 1989 peak, driven by a surge in technology stocks and an influx of global investment, helped by solid earnings from Nvidia.
🇨🇳 Man Group notes that the "quant shake-up" in China, triggered by regulators' attention to quant funds and the CSI 300 Index falling to a five-year low, is reminiscent of the 2007 US crisis.
🇹🇷 The Turkish lira fell to an all-time low, with the dollar becoming more expensive than 31 lira for the first time.
🛢 Oil prices rose for the second day on expectations of higher demand in the US, the world's biggest oil consumer, amid the resumption of refinery operations after disruptions and a weaker dollar.
That's it for today, guys! Click on❤️ if you liked our review, and see you soon!
➡️ TRADE WITH FBS
@fbsanalytics
🛢 Oil prices rose for the second day on expectations of higher demand in the US, the world's biggest oil consumer, amid the resumption of refinery operations after disruptions and a weaker dollar.
That's it for today, guys! Click on
@fbsanalytics
Please open Telegram to view this post
VIEW IN TELEGRAM
❤44👍32🔥7❤🔥6✍1🤩1🌭1🍾1🤝1🆒1🦄1
#TradeIdea
👉 🇻🇦 🇯🇵 👈 Key moment for USDJPY!
💸 On the H1, USDJPY is in a range, consolidating between two critical levels, creating two possible options.
🔼 If the resistance at 150.400 is broken, the price will rise to 151.900
🔽 A fall below 149.800 will open USDJPY's way to 147.500 support
❓ Do you expect a bullish or bearish move? Share in the comments👇
➡️ TRADE WITH FBS
@fbsanalytics
@fbsanalytics
Please open Telegram to view this post
VIEW IN TELEGRAM
👍45❤19❤🔥6🔥6🤝3🆒2🤩1💯1
#AnalyticArticle
🌟 S&P 500 (US500): On the Brink of Breakthrough or Retreat?
🔎 Dive deep into the S&P 500 saga with our insightful analysis, peeling back layers to reveal what lies ahead: a bullish sprint towards uncharted territories or a bearish retreat into consolidation. This detailed scrutiny unveils crucial trading milestones, charting a path with precise entry points, envisioned targets, and strategically placed stop-loss safeguards.
✨ Led by seasoned FBS expert Tibisay Ramos Medina, this narrative extends beyond mere data, morphing into a holistic strategy aimed at arming traders with the acumen to adeptly sail through the upcoming market tides, swayed by pivotal events like Nvidia's earnings revelation.
📍Don't let this chance slip through your fingers and embrace our latest analysis👇
🌟 S&P 500 (US500): On the Brink of Breakthrough or Retreat?
🔎 Dive deep into the S&P 500 saga with our insightful analysis, peeling back layers to reveal what lies ahead: a bullish sprint towards uncharted territories or a bearish retreat into consolidation. This detailed scrutiny unveils crucial trading milestones, charting a path with precise entry points, envisioned targets, and strategically placed stop-loss safeguards.
✨ Led by seasoned FBS expert Tibisay Ramos Medina, this narrative extends beyond mere data, morphing into a holistic strategy aimed at arming traders with the acumen to adeptly sail through the upcoming market tides, swayed by pivotal events like Nvidia's earnings revelation.
📍Don't let this chance slip through your fingers and embrace our latest analysis👇
❤36👍24🍾4🔥3🆒3❤🔥1🤩1🏆1👀1
#TradeIdea
👉 🦅 🕛 US100 Analysis!
⚡️ In the H1 Timeframe, US100 has formed a descending channel pattern, and now the price is testing the upper trend line again, thus creating two possible scenarios:
🔼 If the price breaks the trend line and holds above the 17860 resistance, then it will return to the historical high at the 18040 level
🔽 A bounce off the trendline will bring the US100 back to 17600 support, corresponding to a 23.6 Fibonacci retracement
🧐 Are you on the bullish or bearish side?
➡️ TRADE WITH FBS
@fbsanalytics
@fbsanalytics
Please open Telegram to view this post
VIEW IN TELEGRAM
❤41👍27🔥5✍4🙏3🆒3⚡1❤🔥1🏆1
#TradeIdea
👉 🇪🇺 🇻🇦 👈 EURUSD Outlook!
👀 EURUSD is in a long-term bearish trend, but the price is rising and testing the 38.2 Fibonacci resistance. At the same time, the RSI crossed above 70, signaling overbought conditions.
🔼 If the bulls push the price above the resistance at 1.0860, we can expect a rise to 1.0910 level
🔽 A rebound from the trend line could start a minor correction and a decline to 1.0800 level
❓ What do you think the EURUSD is bullish or bearish today? Share your opinion in the comments👇
➡️ TRADE WITH FBS
@fbsanalytics
@fbsanalytics
Please open Telegram to view this post
VIEW IN TELEGRAM
👍54❤20🔥9🆒8💯4⚡1❤🔥1👎1🤯1🍾1👀1
#TradeIdea
👉 🥇 🇻🇦 👈 XAUUSD Technical Analysis!
☄️ XAUUSD is in a short-term uptrend; the price is testing the trend line, which creates two options for the development of events.
🔽 If gold breaks below the trend line and overcomes the support of 2023, it is possible put TP at the level of 2012
🔼 However, if XAUUSD bounces off the trend line and rises above the 2033 resistance, a 2055 level is possible
Smash❤️ if you trade XAUUSD today!
➡️ TRADE WITH FBS
@fbsanalytics
Smash
@fbsanalytics
Please open Telegram to view this post
VIEW IN TELEGRAM
❤84👍26🔥13🤔3🐳3💯3👀3👾3❤🔥2🍾2⚡1
#education
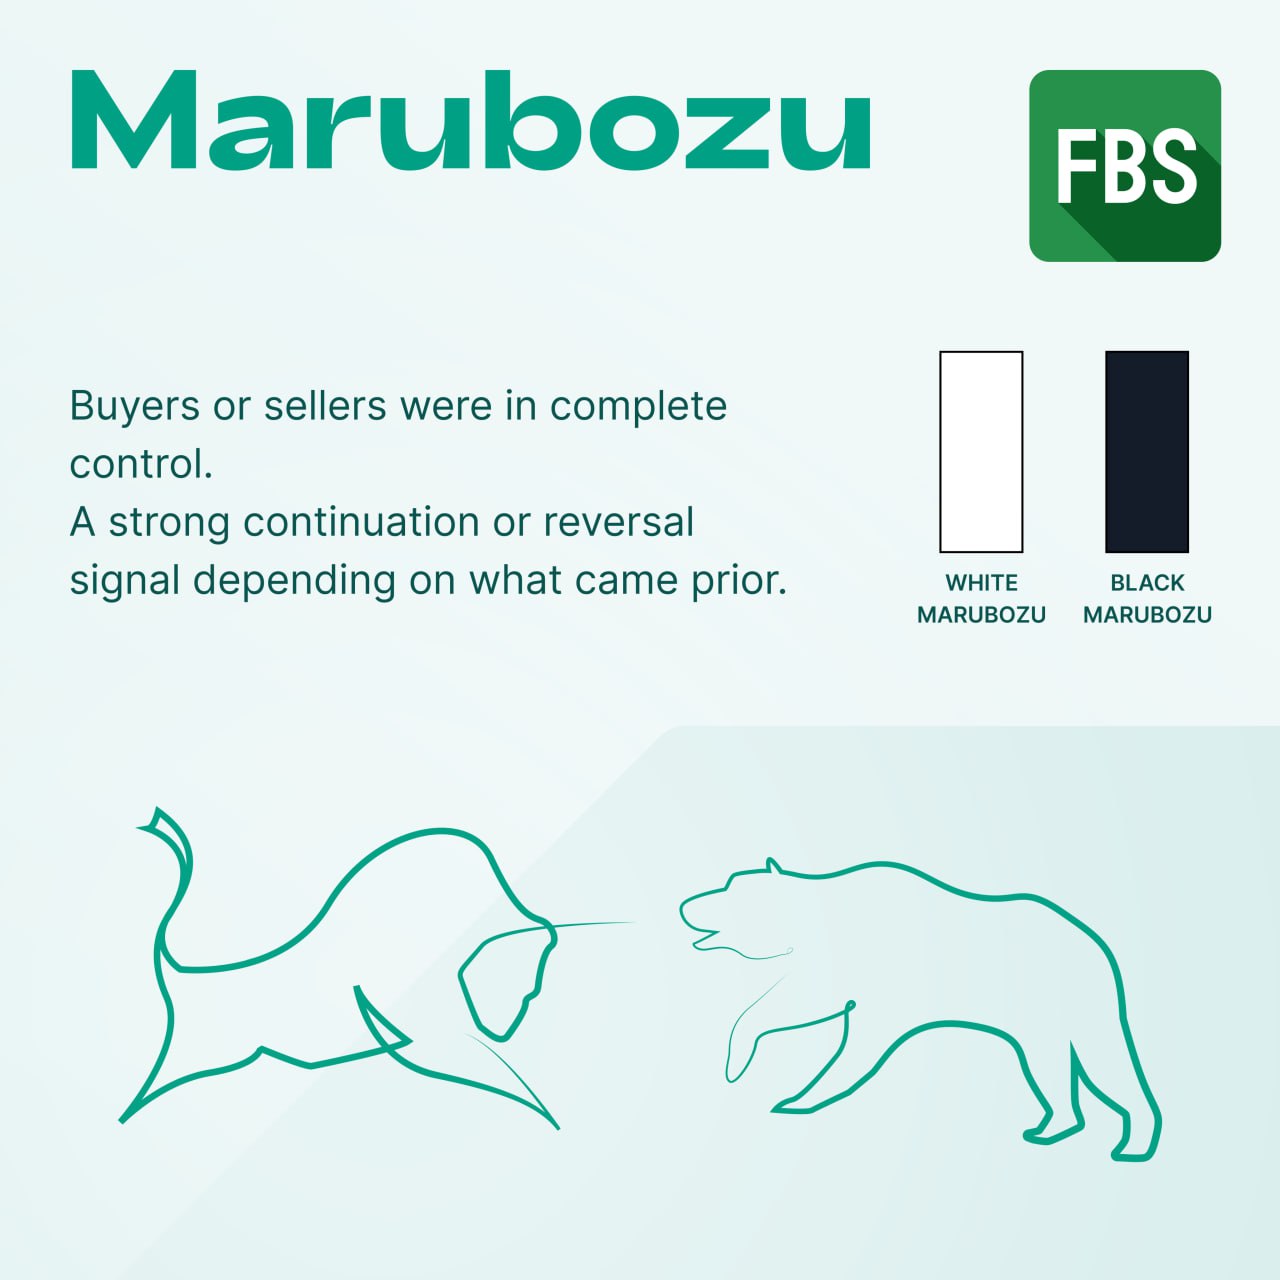
🎉Today we will speak about Marubozu Candlestick Pattern🎉
🤔There are four types of Marubozu: black and white Marubozu, opening and closing Marubozu
◾️Black and White Marubozu are just candlesticks with long bodies and with no shadows.◽️
❗️These are mostly continuation patterns. Thus, if white Marubozu (also called Major Yang) appears, the bullish trend will continue📈, and if you see the black one (also called Major Yin) – it’s a strong bearish trend📉.
❓Want to know more? Read a book by Gregory L. Morris ‘Candlestick Charting Explained' and don’t forget to check some of our other candlesticks reviews:
✔️About Three Black Crows
✔️About Pin Bar
🎉And here is a complete guide for complete newbies👇
🎉Today we will speak about Marubozu Candlestick Pattern🎉
🤔There are four types of Marubozu: black and white Marubozu, opening and closing Marubozu
◾️Black and White Marubozu are just candlesticks with long bodies and with no shadows.◽️
❗️These are mostly continuation patterns. Thus, if white Marubozu (also called Major Yang) appears, the bullish trend will continue📈, and if you see the black one (also called Major Yin) – it’s a strong bearish trend📉.
❓Want to know more? Read a book by Gregory L. Morris ‘Candlestick Charting Explained' and don’t forget to check some of our other candlesticks reviews:
✔️About Three Black Crows
✔️About Pin Bar
🎉And here is a complete guide for complete newbies👇
👍96❤20🔥11👌4🎉3🌚3❤🔥2✍1🏆1🍾1🆒1
#MarketNews
☀️ Happy Friday, dear traders! Look at the major news on this week's last trading session!
⚡️ Nvidia (#NVIDIA) approaches a $2 trillion valuation fueled by the unprecedented demand for AI chips, highlighting its rapid ascent and dominance in the GPU market. The stock is up 16.40% after the report!
📈 US, Europe, and Japan markets hit record highs after Nvidia revived optimism about AI.
🇺🇸 Senior Federal Reserve figures, including Vice Chair Jefferson and Governor Cook, stress the importance of further proof of disinflation before contemplating rate reductions, despite acknowledging the likelihood of cuts within the year.
🔼 Asian stocks rose, with Australia and South Korea advancing, amid a global equity rally that pushed significant indices to record highs, even as Chinese markets experienced fluctuations.
🇨🇳 China's central bank, under Governor Pan Gongsheng, surprises markets with aggressive policy easing, including significant cuts to mortgage rates and the reserve requirement ratio.
🛢 Oil prices declined following a Federal Reserve official's recommendation to postpone interest rate cuts amid a complex backdrop of healthy demand signals and supply concerns.
🇸🇬 Singapore's CPI inflation in January reached its lowest in over two years, driven by reduced fuel and housing costs and tighter monetary conditions leading to decreased recreational spending, signaling a quicker-than-anticipated easing of inflationary pressures.
🍻 Investors are increasingly drawn to beer stock as a cost-effective opportunity for growth, especially in emerging markets, with brewers poised for recovery and potential profit increases as cost pressures ease.
❓ How was your trading week? Share your opinion in the comments!
➡️ TRADE WITH FBS
@fbsanalytics
🛢 Oil prices declined following a Federal Reserve official's recommendation to postpone interest rate cuts amid a complex backdrop of healthy demand signals and supply concerns.
@fbsanalytics
Please open Telegram to view this post
VIEW IN TELEGRAM
👍54🔥11❤10❤🔥3✍2⚡2🆒1🦄1
#TradeIdea
👉 🥇 🇻🇦 🌠 👈 XAUUSD Alert!
☄️ On the H1, the XAUUSD pair formed a "head and shoulders" pattern and broke the uptrend line, which signals the beginning of the bearish movement.
🔽 Trade: Sell XAUUSD
🎯 TP: 2010
Smash❤️ if you trade XAUUSD today!
➡️ TRADE WITH FBS
@fbsanalytics
🎯 TP: 2010
Smash
@fbsanalytics
Please open Telegram to view this post
VIEW IN TELEGRAM
❤137👍43❤🔥19🔥15🏆4🍾4🎉3🌭3⚡2🙏2💯2
#TradeIdea
👉 💵 🇻🇦 👈 XBRUSD Outlook!
🛢 XBRUSD is moving sideways and testing the support area again, which could imply two possible scenarios.
🔼 If XBRUSD once again bounces off the 81.60 support, the price will return to the 83.00 level
🔽 However, if the support is broken, we can expect a fall to 80.80, corresponding to 61.8 Fibonacci
🧐 Are you on the bullish or bearish side?
➡️ TRADE WITH FBS
@fbsanalytics
🛢 XBRUSD is moving sideways and testing the support area again, which could imply two possible scenarios.
@fbsanalytics
Please open Telegram to view this post
VIEW IN TELEGRAM
👍40❤🔥7🔥6❤5✍3🆒3👎1🐳1🌚1💯1🦄1
#AnalyticArticle
📣 XAGUSD: Navigating Through Uncertain Waters🧐
👀 Learn more about silver as we examine its current trajectory: it oscillates between a potential bearish decline and the hope of a bullish revival. This comprehensive analysis sheds light on crucial trading guidelines, offering well-defined entry strategies, achievable targets, and protective stop losses.
⚡️ Guided by the expert insights of FBS analyst Tibisay Ramos Medina, this exploration delves into the intricacies of market dynamics, presenting a narrative that transcends raw numbers to forge a tactical blueprint for traders aiming to navigate the fluctuating currents of the silver market with finesse.
💎 Take advantage of this opportunity to use it for your trading strategy today👇
📣 XAGUSD: Navigating Through Uncertain Waters🧐
👀 Learn more about silver as we examine its current trajectory: it oscillates between a potential bearish decline and the hope of a bullish revival. This comprehensive analysis sheds light on crucial trading guidelines, offering well-defined entry strategies, achievable targets, and protective stop losses.
⚡️ Guided by the expert insights of FBS analyst Tibisay Ramos Medina, this exploration delves into the intricacies of market dynamics, presenting a narrative that transcends raw numbers to forge a tactical blueprint for traders aiming to navigate the fluctuating currents of the silver market with finesse.
💎 Take advantage of this opportunity to use it for your trading strategy today👇
❤31👍21🔥8👎4❤🔥3✍2
#TradeIdea
👉 🇪🇺 🇦🇺 👈 EURAUD Analysis!
👀 EURAUD is sideways after the decline, and the price has been testing the support area corresponding to 38.2 Fibonacci for a long time.
🔽 If the price overcomes the support at 1.6470 and holds below, the fall is possible to 1.6425, corresponding to 23.6 Fibonacci
🔼 Another rebound from the support will push the price up to 1.6510
❓ What do you think the EURAUD is bullish or bearish today? Share your opinion in the comments👇
➡️ TRADE WITH FBS
@fbsanalytics
@fbsanalytics
Please open Telegram to view this post
VIEW IN TELEGRAM
👍43❤10🔥5❤🔥3🆒3😍2🦄1