
#survey
🙌🏻 Dear traders, given the expected volatility this week, what is your forecast for the XAUUSD pair movement?
🙌🏻 Dear traders, given the expected volatility this week, what is your forecast for the XAUUSD pair movement?
Anonymous Poll
37%
📈 It will rise
55%
📉It will fall
8%
🚫I don't trade XAUUSD
👍38🔥6❤5❤🔥2✍2👀2👨💻1
#TradeIdea
👉 🇻🇦 🇨🇭 👈 USDCHF Outlook!
⚡️ On the H4, USDCHF is moving sideways; the price has reached the upper boundary of the range, testing the resistance area. Therefore, two options are possible:
🔽 If the price bounces off the resistance at 0.8880, it will drop down to the lower boundary of 0.8750;
🔼 However, if the resistance breakout happens, the price will continue its long-term growth and increase to 0.9000.
❓ What do you think the USDCHF is bullish or bearish today? Share your opinion in the comments👇
➡️ TRADE WITH FBS
@fbsanalytics
@fbsanalytics
Please open Telegram to view this post
VIEW IN TELEGRAM
👍36❤12🔥5⚡2❤🔥2👌2💯2🍾2🎉1🐳1🆒1
#TradeIdea
👉 🇪🇺 🇻🇦 👈 EURUSD Analysis!
💶 On the H1 chart, EURUSD is testing the lower border of a bullish falling wedge and the 1.0840 support level, presenting two potential scenarios:
🔼 If the price rebounds from the 1.0840 support, we might see a rise to 1.0870;
🔽 Conversely, a breach below the lower border and support could drive EURUSD down to 1.0800.
❓ What's your take on EURUSD's direction today—bullish or bearish?
➡️ TRADE WITH FBS
@fbsanalytics
@fbsanalytics
Please open Telegram to view this post
VIEW IN TELEGRAM
👍59❤9❤🔥5🔥5🤩3🏆3🍾3⚡2👎1👌1🐳1
#InstrumentoftheWeek
⚡️ Second Instrument of the Week! ⚡️
🔥 Fantastic news for traders! We are reducing spreads by 20% all week long on our second instrument, Marathon Digital Holdings (#MARA)! Take the chance to trade this very week when cryptocurrencies are exceptionally volatile.
⚠️ But Wait, There's More! Don't miss out on our detailed #MARA stock analysis, crafted to empower your trading strategies.
📊 In the H4 Timeframe, #MARA formed an ascending channel pattern, and after active growth, the price collapsed to the lower trend line. Indicators give multidirectional signals, which create two possible price movements.
🔼 If the bulls can push the price above the resistance at 20.00, #MARA can rise to 25.00;
🔽 However, a breakdown of the lower trend line and a fall below the support at 18.00 will open the way to 14.00.
Smash🦄 if you're bullish. Put 😈 if you're bearish! Let's check who wins!
➡️ TRADE WITH FBS
@fbsanalytics
Smash
@fbsanalytics
Please open Telegram to view this post
VIEW IN TELEGRAM
👍49🔥8🦄7❤🔥2❤2🍾2😈2🐳1🌚1
#TradeIdea
👉 🥇 🇻🇦 👈 XAUUSD Technical Analysis!
⭐️ On the H1 chart, XAUUSD continues moving within a bullish flag pattern, challenging the critical 2155 resistance zone. Possible outcomes include:
🔼 A successful break above the 2155 resistance might propel the price toward the flag's upper boundary at 2170;
🔽 Failure to surpass this resistance could see a retracement to 2143.
❓ How do you view XAUUSD's direction today? Share your perspective! 💬
➡️ TRADE WITH FBS
@fbsanalytics
@fbsanalytics
Please open Telegram to view this post
VIEW IN TELEGRAM
👍68🔥17❤12🐳7❤🔥4🆒4⚡2🍾2👎1🥰1🌭1
#Education
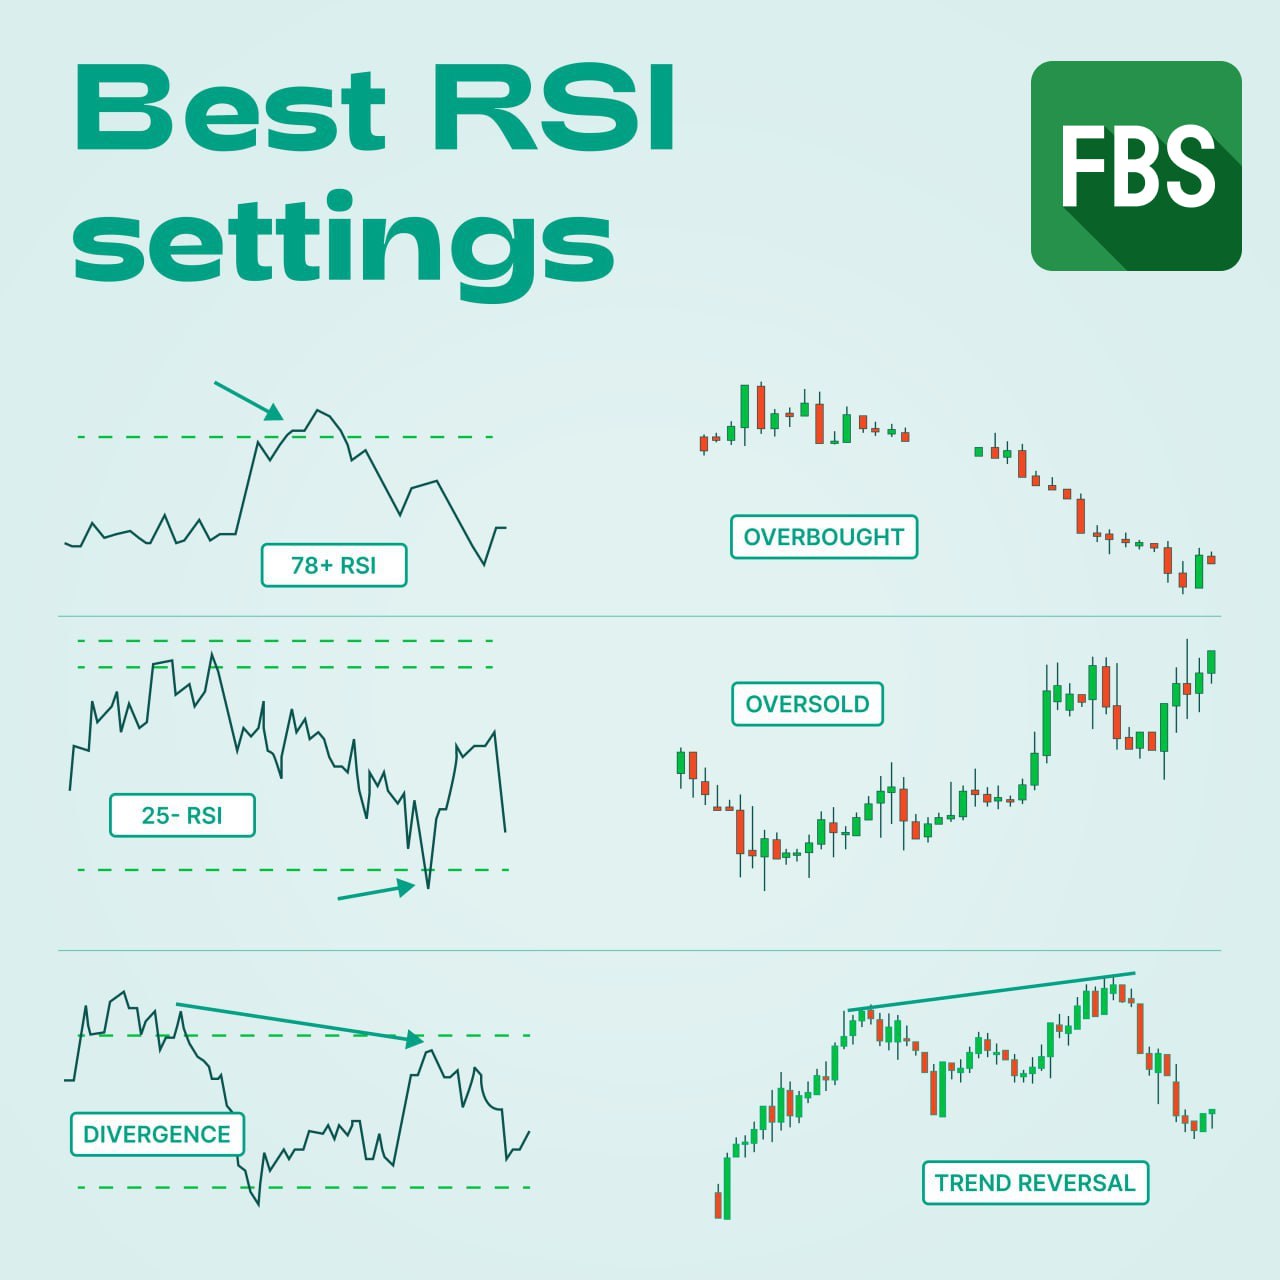
🙌🏻 Hello traders! Let's explore the Relative Strength Index (RSI), a practical and powerful tool for gauging market momentum that can significantly enhance your trading strategies.
📉 RSI is a momentum oscillator that evaluates price movements through a 0-100 scale, identifying overbought (above 70) or oversold (below 30) conditions. It's calculated from average gains and losses over a specified period, typically displayed as a line graph.
🧠 Pro tip: By adjusting the RSI settings, such as 78 for overbought and 25 for oversold, you can potentially sharpen its sensitivity, offering quicker reactions to market changes and enhancing your trading strategy.
🔼 An overbought RSI suggests potential overvaluation and upcoming reversal.
🔽 An oversold RSI indicates possible undervaluation, indicating a forthcoming price increase.
📈📉 Watch out for RSI divergence—it signals weakening momentum when the price direction and RSI trend diverge, often preceding a market reversal.
Embrace the RSI to refine your trading strategy!
🙌🏻 Hello traders! Let's explore the Relative Strength Index (RSI), a practical and powerful tool for gauging market momentum that can significantly enhance your trading strategies.
📉 RSI is a momentum oscillator that evaluates price movements through a 0-100 scale, identifying overbought (above 70) or oversold (below 30) conditions. It's calculated from average gains and losses over a specified period, typically displayed as a line graph.
🧠 Pro tip: By adjusting the RSI settings, such as 78 for overbought and 25 for oversold, you can potentially sharpen its sensitivity, offering quicker reactions to market changes and enhancing your trading strategy.
🔼 An overbought RSI suggests potential overvaluation and upcoming reversal.
🔽 An oversold RSI indicates possible undervaluation, indicating a forthcoming price increase.
📈📉 Watch out for RSI divergence—it signals weakening momentum when the price direction and RSI trend diverge, often preceding a market reversal.
Embrace the RSI to refine your trading strategy!
👍91❤24🔥11🆒9✍8❤🔥5🍾5🐳4🌭4🤩3
#MarketNews
☀️ Happy Wednesday, dear traders! Today, March 20th, we're bringing you the day's most thrilling news highlights:
💵 The US dollar could strengthen if the Fed signals just two rate cuts this year. On March 20th, it's expected to keep rates stable but may lean hawkish, with markets forecasting 2-3 cuts. The UsDollar is at 103.88.
❌ The SEC has postponed the review of the application for a spot ETH-ETF. ETHUSD stands at 3148.
🛢 The global energy demand will outpace population growth until 2050. The CEO of Kuwait Oil expressed significant doubts about reaching a peak in oil demand this decade at CERAWeek. Brent crude is priced at $86.52.
⭐️ Global central banks are purchasing gold at record rates, according to BofA. The WGC forecasts record gold demand this year. XAUUSD stands at 2157.
🚗 Tesla China is raising prices for the Model Y in China. Tesla's stock is at 171.31.
📉 Morgan Stanley cautions that a weakening dollar could lead to stock declines, as the current strong dollar boosts stocks, but its potential weakening poses risks to valuations. US500 is at 5180.
🏆 China has the conditions to achieve a 5% GDP growth in 2024, according to Liu Aihua, a representative of the National Bureau of Statistics. HK50 stands at 16580.
🚀 On March 18th, investors bought Nvidia call options with a $1940 strike, per Bloomberg. BofA suggests the ongoing NVIDIA GTC AI 2024 conference could further boost its shares. NVIDIA stands at 894.95.
🌐 On March 19th, outflows from spot BTC-ETFs intensified, with a net outflow of $326.2 million, marking this year's record daily outflows, reports Farside. BTCUSD is at 62101.
That's it for today, guys! Click on🔥 if you liked our review, and see you soon!
➡️ TRADE WITH FBS
@fbsanalytics
🛢 The global energy demand will outpace population growth until 2050. The CEO of Kuwait Oil expressed significant doubts about reaching a peak in oil demand this decade at CERAWeek. Brent crude is priced at $86.52.
That's it for today, guys! Click on
@fbsanalytics
Please open Telegram to view this post
VIEW IN TELEGRAM
👍40❤26🔥15🍾2👀2🆒2❤🔥1✍1
#TradeIdea
👉 💵 🇻🇦 🌠 👈 XBRUSD is flying down!
📉 Brent surged to a new yearly high, but now the price has broken the trend line, bounced off the 61.8 Fibonacci resistance, and headed downwards.
🔽 Trade: Sell XBRUSD
🎯 TP: 84.20
Smash👍 if you're agree with the analysis!
➡️ TRADE WITH FBS
@fbsanalytics
🎯 TP: 84.20
Smash
@fbsanalytics
Please open Telegram to view this post
VIEW IN TELEGRAM
👍59❤14🔥9👏3🤔3👀3❤🔥2🌭2💯2🆒2😁1
#TradeIdea
👉 🇻🇦 🇨🇦 👈 USDCAD Outlook!
🔔 In the H2 timeframe, USDCAD is testing the crucial 1.3600 resistance zone. Here's what could happen next:
🔼 A breakthrough above 1.3600 could propel the asset towards the 1.3640 resistance;
🔽 A retreat from this resistance might push it down to the 1.3550 support.
❓ Do you see USDCAD as bullish or bearish today? Share your thoughts! 💬
➡️ TRADE WITH FBS
@fbsanalytics
@fbsanalytics
Please open Telegram to view this post
VIEW IN TELEGRAM
👍35❤11🔥7😁3🌭2❤🔥1🎉1🍾1🆒1
#TradeIdea
👉 💡 ▶️ ⏩ US30 Update!
🕯 On the H4, US30 is in a long-term uptrend, and the price is approaching a significant resistance level, which has already bounced several times.
🔼 If US30 can break the resistance at 39200, the bullish trend will continue up to 39600;
🔽 However, if another bounce from the resistance occurs, the price may fall to the trend line 38900.
❓ Do you expect a bullish or bearish move? Share in the comments👇
➡️ TRADE WITH FBS
@fbsanalytics
@fbsanalytics
Please open Telegram to view this post
VIEW IN TELEGRAM
❤34👍22🔥7❤🔥3🆒3🤩1💯1
Please open Telegram to view this post
VIEW IN TELEGRAM
YouTube
Live Market Review After FOMC – March 21
Check the FBS website: https://bit.ly/3TKMeU4
More analytics: https://bit.ly/3voOG9p
The best telegram channel: https://t.me/fbsanalytics
Join us for an exclusive YouTube live stream as our FBS partner from Africa, FBS financial expert Adetola Freeman will…
More analytics: https://bit.ly/3voOG9p
The best telegram channel: https://t.me/fbsanalytics
Join us for an exclusive YouTube live stream as our FBS partner from Africa, FBS financial expert Adetola Freeman will…
👍57❤19🔥8🎉3❤🔥2🆒2✍1⚡1🤩1🐳1🌭1
#TradeIdea
👉 🥇 🇻🇦 🚀 👈 XAUUSD Bullish Alert Pre-FOMC!
⭐️ XAUUSD has surged past the bullish flag's upper boundary and is challenging the 2165 resistance. The 100-MA poses additional resistance.
🔼 Trade: Go long on XAUUSD with a breakout above 2165;
🎯 Target: 2185.
❓ How do you predict today's FOMC meeting will impact XAUUSD? Share your insights! 💬
➡️ TRADE WITH FBS
@fbsanalytics
🎯 Target: 2185.
@fbsanalytics
Please open Telegram to view this post
VIEW IN TELEGRAM
👍92❤30🔥10❤🔥8🍾5🤓5🤩4💯4👎3🆒2
#survey
📍Question for investors! Which types of assets do you prefer in the current macroeconomic situation?
📍Question for investors! Which types of assets do you prefer in the current macroeconomic situation?
Anonymous Poll
19%
📈 Traditional stocks of large companies
12%
💻 Stocks of technology companies and startups
9%
💰Bonds and fixed-income
23%
💸 Cryptocurrencies and blockchain assets
36%
🛢 Commodities and precious metals
👍58❤23🔥10🆒5🌭4🍾3❤🔥2🐳1
#MarketNews
☀️ Happy Thursday, dear traders! Let's check the news moving the financial markets today! There are also many reports to be published today!
☄️ The Federal Reserve maintains steady interest rates and indicates the possibility of three cuts later in 2024, reflecting a cautious stance amid a projected GDP growth acceleration.
🇨🇳 China's central bank suggests increasing liquidity for banks while exercising restraint on interest rate cuts, citing ample policy space amid a robust economic beginning in 2024.
🇪🇺 The ECB warns Eurozone banks to prepare for new risks amid changing economic conditions, including cyber threats and increased competition.
📈 Coinbase will launch futures trading for Dogecoin, Litecoin, and Bitcoin Cash starting April 1st. Shares of Coinbase (#COIN) surged 11.63%.
🌐 Asian stocks soar on Fed's rate cut hopes, propelling Nikkei to record high, while tech-heavy bourses surge on AI hype.
🚗 BMW expects its 2024 automotive margin to match last year's levels amid peak R&D and capital expenditures following a shortfall in 2023. BMW (#BMW) stock is down 0.71% today.
🍎 The US Department of Justice is set to sue Apple for antitrust violations, alleging it blocked rivals from accessing iPhone features. Nevertheless, Apple's (#APPLE) stock is up 1.47% today.
🥇 Gold jumped above $2,200 an ounce for the first time as the Federal Reserve's dovish stance on rate cuts amid inflationary pressures bolstered demand for the precious metal.
That's it for today, guys! Click on❤️ if you liked our review, and see you soon!
➡️ TRADE WITH FBS
@fbsanalytics
🍎 The US Department of Justice is set to sue Apple for antitrust violations, alleging it blocked rivals from accessing iPhone features. Nevertheless, Apple's (#APPLE) stock is up 1.47% today.
That's it for today, guys! Click on
@fbsanalytics
Please open Telegram to view this post
VIEW IN TELEGRAM
❤58👍33🔥7❤🔥6🆒4🐳3✍2👏2💯2
#TradeIdea
👉 💡 ▶️ ⏩ XNGUSD Outlook!
🔥 XNGUSD is navigating a bearish rising wedge, currently testing the 1.85 support level and its lower boundary. Here's what could happen next:
🔼 A rebound from the 1.85 level could propel the asset towards 1.92;
🔽 Conversely, if XNGUSD breaks below this boundary, it could fall to the 1.75 support.
❓ What's your stance on XNGUSD - bullish or bearish? Drop your insights below👇
➡️ TRADE WITH FBS
@fbsanalytics
@fbsanalytics
Please open Telegram to view this post
VIEW IN TELEGRAM
👍30❤14🔥9✍5💯4❤🔥2🤩1🆒1
#TradeIdea
👉 🥇 🇻🇦 👈 XAUUSD Technical Analysis!
⚡️ After the FOMC meeting, Gold updated a new historical record but is now consolidating before further movement. The moving averages are bullish, while the RSI signals a strong overbought condition.
🔼 If XAUUSD breaks above the resistance at 2210, it will open the way for a rise to 2257,corresponding to 261.8 Fibonacci;
🔽 Otherwise, a fall below 2200 support will drop Gold to 2175.
🧐 Are you on the bullish or bearish side?
➡️ TRADE WITH FBS
@fbsanalytics
@fbsanalytics
Please open Telegram to view this post
VIEW IN TELEGRAM
❤64👍45🔥11❤🔥8🐳5🍾4🆒4✍3👏2💯1😘1
#LiveStreamAlert
🌟 Dive into a Live Market Review After FOMC!
⏰ We'll start market research in a few minutes, so get ready!
🎞 Introducing our market maestro, Adetola Freeman, a seasoned finance expert and FBS analyst. Gear up for unparalleled live trading sessions filled with unique insights!
🚀 Take a chance to enhance your trading experience with FBS. Transform your approach and outcomes in trading starting now!
https://www.youtube.com/watch?v=wLohdiu4oJk
https://www.youtube.com/watch?v=wLohdiu4oJk
Please open Telegram to view this post
VIEW IN TELEGRAM
YouTube
Live Market Review After FOMC – March 21
Check the FBS website: https://bit.ly/3TKMeU4
More analytics: https://bit.ly/3voOG9p
The best telegram channel: https://t.me/fbsanalytics
Join us for an exclusive YouTube live stream as our FBS partner from Africa, FBS financial expert Adetola Freeman will…
More analytics: https://bit.ly/3voOG9p
The best telegram channel: https://t.me/fbsanalytics
Join us for an exclusive YouTube live stream as our FBS partner from Africa, FBS financial expert Adetola Freeman will…
❤35👍24🔥5🤝4🌚3❤🔥1💯1🍾1
#TradeIdea
👉 🗽 🕛 US500 Outlook!
⚙️ The US500 is navigating a bearish flag, currently testing its upper boundary and the 5260 resistance level. Potential scenarios include:
🔼 Surpassing the 5260 resistance could trigger a climb to 5300;
🔽 However, a rejection at the upper boundary might cause a retreat to the 5150 support level.
😊 Do you agree or have a different point of view? Let's discuss in the comments below👇
➡️ TRADE WITH FBS
@fbsanalytics
@fbsanalytics
Please open Telegram to view this post
VIEW IN TELEGRAM
👍26🔥6❤4🆒4❤🔥2🤩1🌚1👀1
#TradeIdea
👉 💡 ▶️ ⏩ XAGUSD Update!
🥈 On the H4, XAGUSD formed an ascending channel, but the price did not reach the 100.0 Fibonacci level and fell to the lower trend line.
🔽 If Silver breaks below the trend line and overcomes the 25,000 support, it will fly down to the 24,400 level, corresponding to 61.8 Fibonacci;
🔼 A rebound from the trend line will allow the price to reach 25.900.
❓ Are you trading Silver today? Write in the comments👇
➡️ TRADE WITH FBS
@fbsanalytics
@fbsanalytics
Please open Telegram to view this post
VIEW IN TELEGRAM
👍36❤🔥5❤5⚡2🔥2✍1🐳1🏆1🆒1
#AnalyticArticle
📊 US30: Key Zones and Trading Setups!
🔥 Uncover the secrets to accurate trading of the US30! Our latest analysis shows target strategies for bearish and bullish scenarios. Explore detailed information on where to sell, buy, and place stops to maximize performance.
⚡️Analyze the market confidently using FBS expert Tibisay Ramos Medina's guide to entry points and potential targets. Whether you're preparing for a pullback or are on a bullish upswing, our guide will equip you with the tools to succeed.
🔺 Enhance your trading strategy and align it with market momentum. Click here to get an expert view of US30👇
📊 US30: Key Zones and Trading Setups!
🔥 Uncover the secrets to accurate trading of the US30! Our latest analysis shows target strategies for bearish and bullish scenarios. Explore detailed information on where to sell, buy, and place stops to maximize performance.
⚡️Analyze the market confidently using FBS expert Tibisay Ramos Medina's guide to entry points and potential targets. Whether you're preparing for a pullback or are on a bullish upswing, our guide will equip you with the tools to succeed.
🔺 Enhance your trading strategy and align it with market momentum. Click here to get an expert view of US30👇
❤41👍19❤🔥5🆒5🔥2🍾1👀1