
#TradeIdea
👉 🇪🇺 🇻🇦 🛸 👈 EURUSD Opportunity!
⚡️ On the H4, EURUSD has formed a descending channel pattern in a long-term downtrend. Price bounced off the upper trendline and fell below the 61.8 Fibonacci support, with Momentum falling below 100.0.
🔽 Trade: Sell EURUSD;
🎯 TP: 1.0680;
Smash👍 if you trade EURUSD today!
➡️ TRADE WITH FBS
@fbsanalytics
Smash
@fbsanalytics
Please open Telegram to view this post
VIEW IN TELEGRAM
👍59❤20🔥8😍5👏4👎3❤🔥2💯2🆒1
#Education
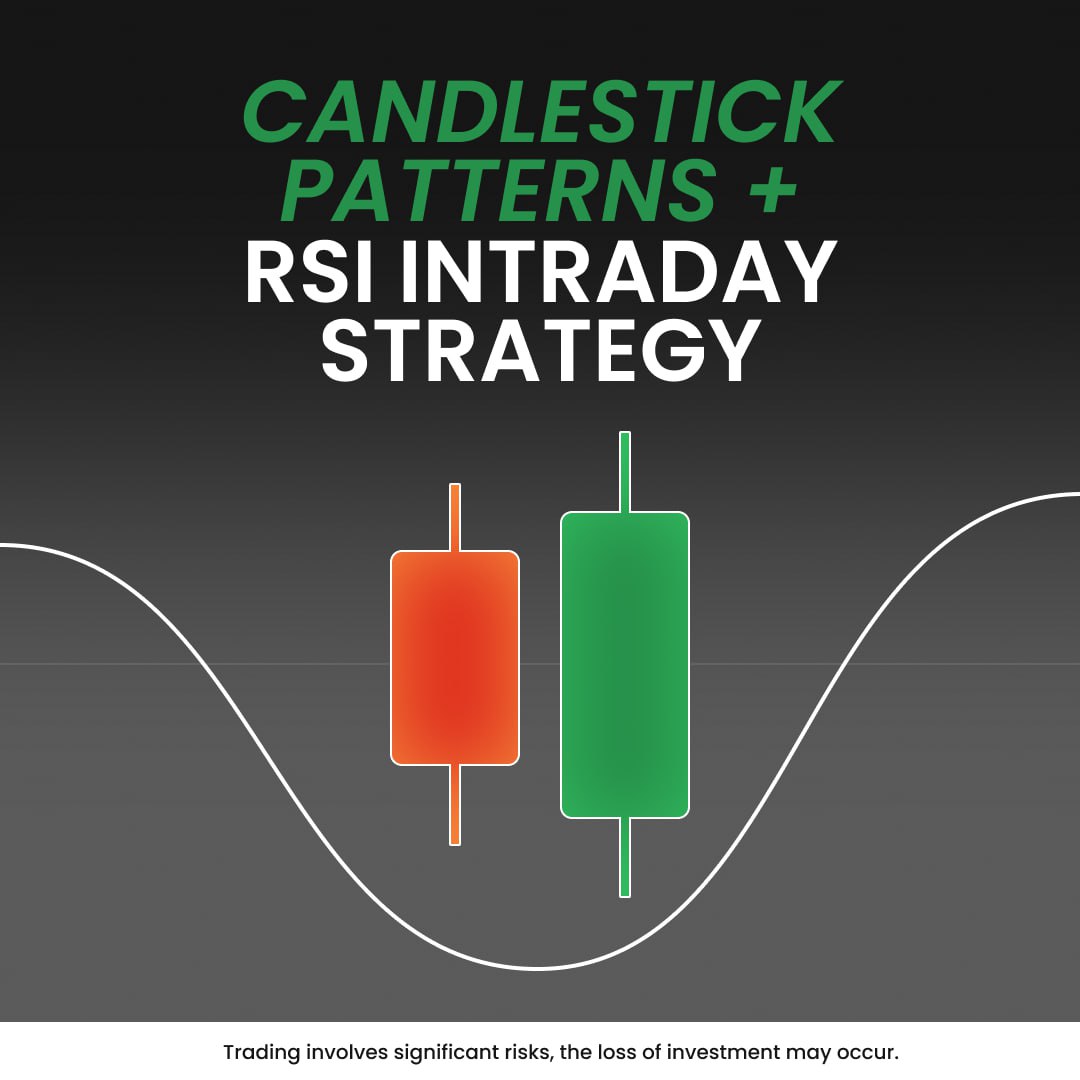
💡 Unlock the RSI & Engulfing Pattern Strategy! 💡
⚡️ Learn how to combine RSI with Bullish/Bearish Engulfing Patterns for powerful trades! This strategy leverages momentum and candlestick patterns to give you a winning edge.
📈 Long Entry:
🔘Spot Bullish Engulfing.
🔘Confirm with RSI below 40.
🔘Enter at the next candle.
📉 Short Entry:
🔘Identify Bearish Engulfing.
🔘Confirm with RSI above 60.
🔘Enter at the next candle.
❓ Want to master this strategy and boost your trades? Dive into the full tutorial here 👇
💡 Unlock the RSI & Engulfing Pattern Strategy! 💡
⚡️ Learn how to combine RSI with Bullish/Bearish Engulfing Patterns for powerful trades! This strategy leverages momentum and candlestick patterns to give you a winning edge.
📈 Long Entry:
🔘Spot Bullish Engulfing.
🔘Confirm with RSI below 40.
🔘Enter at the next candle.
📉 Short Entry:
🔘Identify Bearish Engulfing.
🔘Confirm with RSI above 60.
🔘Enter at the next candle.
❓ Want to master this strategy and boost your trades? Dive into the full tutorial here 👇
❤57👍19✍9🔥7⚡6😍4🐳2👀2❤🔥1👏1🤮1
#MarketNews
☀️ Happy Wednesday, dear traders! Today, June 26, we're bringing you the day's most thrilling news highlights:
🇪🇺 ECB's Olli Rehn considers market expectations of two more rate cuts in 2024, potentially lowering the deposit rate to 2.25%, as reasonable.
🇨🇳 Economists raised China's 2024 GDP growth forecast to 5% and export growth to 4.3%, citing improved exports despite risks from weak domestic spending and trade tensions.
📈 Nvidia's stock (#NVIDIA) surged 6.8%, its best rebound in three years, after a three-session 12.9% decline. It ranks second in the S&P 500.
⚡️ The Bank for International Settlements says central banks must use AI for real-time data and better inflation prediction but should not replace humans in setting rates.
🇨🇦 Canada's May CPI rose to 2.9% year-over-year, beating the 2.6% estimate. This reduced the Bank of Canada's July rate cut odds to 52%.
🇯🇵 Traders say Japan is unlikely to intervene in the yen's decline before Friday's US PCE data, despite the yen's 12% drop against the dollar this year.
⛽️ The global LNG market faces supply risks from Russian sanctions, aging plants (25% are over 20 years old), shipyard bottlenecks, and a US licensing pause that could potentially delay 70 million tons of new capacity.
📦 FedEx (#FDX) shares jumped over 15% after hours as $4 billion cost-cutting measures led to better-than-expected fiscal Q4 earnings and revenue.
That's it for today, guys! Click on👍 if you liked our review, and see you soon!
➡️ TRADE WITH FBS
@fbsanalytics
⛽️ The global LNG market faces supply risks from Russian sanctions, aging plants (25% are over 20 years old), shipyard bottlenecks, and a US licensing pause that could potentially delay 70 million tons of new capacity.
That's it for today, guys! Click on
@fbsanalytics
Please open Telegram to view this post
VIEW IN TELEGRAM
👍40❤6🔥6❤🔥3😍2⚡1👏1👀1🤝1🫡1
#TradeIdea
👉 🇻🇦 🇯🇵 🚀 👈 USDJPY Alert!
💸 On the H4, USDJPY is in a long-term bullish trend, and the price has overcome 161.8 Fibonacci. MA50 and MA200, along with the Bulls Power Indicator, indicate bullish sentiment, which makes it possible to consider buying on further upside.
🔼 Trade: Buy USDJPY;
🎯 TP: 160.900;
Hit❤️ if you're going to take it!
➡️ TRADE WITH FBS
@fbsanalytics
Hit
@fbsanalytics
Please open Telegram to view this post
VIEW IN TELEGRAM
❤55👍21❤🔥5🔥5🫡3💅3👎2😍2💯1🆒1😎1
#TradeIdea
👉 🥇 🇻🇦 👈 XAUUSD Outlook!
⚡️ On the H4, XAUUSD has decisively breached below the 2325 support level and a key trendline. The Momentum oscillator crossing below the 100 level indicates a bearish sentiment for the asset, signaling potential further downside.
🔼 If XAUUSD breaks above the 2325 level, it will propel the asset to 2350;
🔽 However, if the price bounces from the resistance, it may trigger a decline to 2290.
Smash❤️ if you trade XAUUSD today!
➡️ TRADE WITH FBS
@fbsanalytics
Smash
@fbsanalytics
Please open Telegram to view this post
VIEW IN TELEGRAM
❤54👍34🤝6⚡4🔥3🌚3🫡2❤🔥1😍1🌭1
#TradeIdea
👉 🇪🇺 🇻🇦 🛸 👈 EURUSD May Fall!
💸 On the H4, EURUSD formed a Double-Top Pattern in a long-term bearish trend, and the price fell to the neckline, testing the support area. At the same time, Momentum fell below 100.0 again, and MA200 is indicating a possible decline.
🔽 Trade: Sell EURUSD on a breakout below 1.0680;
🎯 TP1: 1.0650;
🏹 TP2: 1.0630;
Smash👍 if you trade EURUSD today!
➡️ TRADE WITH FBS
@fbsanalytics
Smash
@fbsanalytics
Please open Telegram to view this post
VIEW IN TELEGRAM
👍60❤13🔥8⚡6👎5❤🔥4🌭2👏1😍1
#TradeIdea
👉 💡 ▶️ ⏩ US30 Update!
👁 On the H1 chart, US30 navigates within a head-and-shoulders pattern and tests its lower border. However, the Momentum oscillator aims to cross the 100 level from below, indicating a potential bullish sentiment.
🔼 If US30 manages to break above the resistance at 39140, bullish momentum could drive it towards 39300;
🔽 However, breaching below the pattern’s border will trigger a decline to 38920.
❓ Do you anticipate a bullish or bearish move? Share your thoughts in the comments below. 👇
➡️ TRADE WITH FBS
@fbsanalytics
@fbsanalytics
Please open Telegram to view this post
VIEW IN TELEGRAM
👍31❤8🔥4🤝3⚡2😍2✍1
#Education
📉 Have you ever heard of a drawdown? It's not a loss, but it can be a real rollercoaster in trading!
💸 A drawdown is the difference between your account's highest and lowest points before it recovers. It helps you understand risk and how much effort it takes to bounce back.
📌Here's a quick breakdown:
✅ Drawdowns are normal: Even profitable traders experience them.
✅ They measure risk: A higher drawdown means it takes more gains to recover.
✅ Diversification helps: Spread your investments to lessen the blow.
⚡️Always remember risk management and use FBS trading ideas for daily insights!
🔍 Want to get daily trade ideas? Check out👇
📉 Have you ever heard of a drawdown? It's not a loss, but it can be a real rollercoaster in trading!
💸 A drawdown is the difference between your account's highest and lowest points before it recovers. It helps you understand risk and how much effort it takes to bounce back.
📌Here's a quick breakdown:
✅ Drawdowns are normal: Even profitable traders experience them.
✅ They measure risk: A higher drawdown means it takes more gains to recover.
✅ Diversification helps: Spread your investments to lessen the blow.
⚡️Always remember risk management and use FBS trading ideas for daily insights!
🔍 Want to get daily trade ideas? Check out👇
👍41❤19🔥18💯6😍5👏4⚡3😭2❤🔥1🌭1👾1
#MarketNews
🌤 Happy Thursday, dear traders! Let's check the news moving the financial markets today:
🔥 According to the International Gas Union, the global LNG market faces supply uncertainties due to sanctions on Russian fuel, aging plants, and attacks on ships in the Red Sea. XNGUSD dropped to 2.75.
🌥 Google is partnering with CME Group to create a new cloud computing network, enabling the exchange to move futures and options trading to the cloud. Google shares rose to 183.85.
🌐 BofA: SP500 stock correlation hits a 20-year low. JPMorgan sees a Dotcom bubble-like dominance by a few major US stocks. US500 consolidates at 5476.
🇹🇷 According to a BBG survey, analysts expect Turkey's central bank to maintain the interest rate at 50% during the June 27 meeting. USDTRY rose to 32.87 after a correction.
🇨🇳 China faces a housing oversupply crisis, prompting authorities to lower minimum down payments and urge reductions in unsold homes. The real estate sector is over 25% of China's GDP. HK50 dropped to 17677
🇯🇵 Japan will take necessary measures to protect the yen, says Finance Minister Suzuki, as the yen falls to its lowest level against the dollar since 1986. USDJPY rises to 160.47.
🛫 Boeing has resumed deliveries of wide-body jets to China, which has led to a rise in #BA shares to 178.50.
🤖 Microsoft is the top choice for 874 hedge funds, driven by its significant AI advancements. Microsoft shares are at 452.12.
That's it for today, guys! Click on🔥 if you liked our review, and see you soon!
➡️ TRADE WITH FBS
@fbsanalytics
That's it for today, guys! Click on
@fbsanalytics
Please open Telegram to view this post
VIEW IN TELEGRAM
❤28👍28🔥15👏4🆒3✍2🥰1😁1👌1🌭1💅1
#TradeIdea
👉 🇻🇦 🇨🇭 👈 USDCHF Update!
🇨🇭 USDCHF encountered strong resistance around the 0.8980 level, aligned with the 38.2% Fibonacci ratio, following an extended uptrend. The MFI oscillator's overbought condition suggests a possible trend reversal.
🔼 If the price breaks the resistance zone, it will likely rise to 0.9080 level;
🔽 A rebound from the 38.2 Fibonacci will lead USDCHF down to 0.8900 support.
❓ Is USDCHF bullish or bearish today? Share your opinion in the comments.👇
➡️ TRADE WITH FBS
@fbsanalytics
@fbsanalytics
Please open Telegram to view this post
VIEW IN TELEGRAM
👍37❤11🔥6❤🔥2⚡1👏1😍1🌭1
#TradeIdea
👉 🥇 🇻🇦 🚀 👈 XAUUSD Alert!
💡 DeMarker System Strategy setup!
☄️ On the H4, XAUUSD, after a substantial fall, fell to the critical support area and rebounded to start rising. Demarker crossed 0.300, and Parabolic SAR indicates the beginning of a short rise.
🔼 Trade: Buy XAUUSD on a breakout above 2310;
🎯 TP1: 2325;
🎯 TP2: 2330;
Smash❤️ if you trade XAUUSD today!
➡️ TRADE WITH FBS
@fbsanalytics
Smash
@fbsanalytics
Please open Telegram to view this post
VIEW IN TELEGRAM
❤105👍33❤🔥17🔥8🍌3⚡2👏2😍1🆒1
🥇 Is XAUUSD forming a reversal pattern? 📉
🔥 Our comprehensive trading analysis shows if the Gold price is poised for a reversal or trend continuation. Take advantage of this detailed examination! 👁
Read more here 👇
🔥 Our comprehensive trading analysis shows if the Gold price is poised for a reversal or trend continuation. Take advantage of this detailed examination! 👁
Read more here 👇
👍64❤16🔥12✍11💯5⚡3🌭3👏2🎉2❤🔥1😍1
#TradeIdea
👉 🇪🇺 🇻🇦 👈 EURUSD Key Moment!
💸 EURUSD is in a descending channel and in a long-term decline. The price has reached the upper trend line and is testing the resistance area, while the 50-MA provides an extra layer of resistance.
🔼 If the bulls push the price above 1.0700 and break the trend line, the growth will go up to 1.0750;
🔽 A rebound from the trend line will continue the bearish momentum to 1.0670.
❓ Do you expect EURUSD to rise or fall? Write in the comments.⬇️
➡️ TRADE WITH FBS
@fbsanalytics
@fbsanalytics
Please open Telegram to view this post
VIEW IN TELEGRAM
👍54❤15🔥7🤯4❤🔥3🤣3⚡2😍2🌭2👏1
FBS Analytics
#TradeIdea 👉 🥇 🇻🇦 🚀 👈 XAUUSD Alert! 💡 DeMarker System Strategy setup! ☄️ On the H4, XAUUSD, after a substantial fall, fell to the critical support area and rebounded to start rising. Demarker crossed 0.300, and Parabolic SAR indicates the beginning of a short…
@fbsanalytics
Please open Telegram to view this post
VIEW IN TELEGRAM
❤🔥92👍54🔥22❤17👏7🍾5😍4🌚4🆒3💘3🏆2
#MarketNews
☀️ Happy Friday, dear traders! This week was intense, and we hope you enjoyed it! Let's take a look at our end-of-week news:
☄️ The International Monetary Fund criticized the US for its 6.7% GDP deficit and projected a 140% debt-to-GDP ratio by 2032, warning of risks from trade policies and insufficient banking reforms.
🇺🇸 The US is easing sanctions on Russia, Iran, and Venezuela to prevent a global oil price surge, potentially increasing Venezuelan production by 200,000 barrels/day.
🇯🇵 Tokyo's inflation rose to 2.1% in June, driven by a 3.8% increase in natural gas prices. Industrial output grew 2.8% in May, likely prompting a Bank of Japan rate hike in July.
🇬🇧 The UK's economy grew by 0.7% in the first quarter of 2024, surpassing the initial estimate of 0.6%, with GDP 0.3% higher than a year earlier.
🇫🇷 French inflation slowed to 2.5% in June, down from 2.6% in May, just two days before elections, aligning with expectations.
💵 Coinbase partners with Stripe to enable USDC transfers on its blockchain project, Base, integrating Stripe's fiat-to-crypto on-ramp for instant USDC purchases.
🚗 Tesla's design changes have led to 266 problems per 100 vehicles, impacting consumer satisfaction and potentially reducing sales, thus posing economic risks for the company.
🛰 Amazon delayed the launch of its Project Kuiper broadband satellites to Q4 2024, with customer tests in 2025, shifting from the initially planned first-half launch.
❓ How was your trading week? Share your opinion in the comments👇
➡️ TRADE WITH FBS
@fbsanalytics
🛰 Amazon delayed the launch of its Project Kuiper broadband satellites to Q4 2024, with customer tests in 2025, shifting from the initially planned first-half launch.
@fbsanalytics
Please open Telegram to view this post
VIEW IN TELEGRAM
👍54❤13🔥8✍4👀3🤯2❤🔥1⚡1🆒1
#TradeIdea
👉 🇻🇦 🇯🇵 🚀 👈 USDJPY: Could Rise!
💸 On the H4, USDJPY continued its bullish trend and rose above the 200.0 Fibonacci level and then corrected to the trend line. However, the Bulls Power Indicator and the moving averages indicate bullish sentiment, so we may consider buying on further upside.
🔼 Trade: Buy USDJPY on a breakout above 161.100;
🎯 TP: 162.000;
Smash👍 if you agree with the analysis!
➡️ TRADE WITH FBS
@fbsanalytics
Smash
@fbsanalytics
Please open Telegram to view this post
VIEW IN TELEGRAM
👍66❤17👏5⚡4❤🔥4✍4🔥4😍3🎉1🤩1🌭1
#TradeIdea
👉 🥇 🇻🇦 👈 XAUUSD Outlook!
⚡️ On the H1 chart, XAUUSD is testing the 2335 resistance level. The MFI and RSI oscillators show bearish divergence, with the RSI also indicating an overbought condition, potentially signaling a bearish sentiment.
🔼 If XAUUSD breaks above the 2335 level, it will propel the asset to 2355;
🔽 However, if the price bounces from the resistance, it may trigger a decline to 2320.
Smash❤️ if you trade XAUUSD today!
➡️ TRADE WITH FBS
@fbsanalytics
Smash
@fbsanalytics
Please open Telegram to view this post
VIEW IN TELEGRAM
❤69👍33🔥13❤🔥4🤣4⚡2👏2🏆2🤝2😁1😍1
#networking
⭐️ Happy Friday, everyone! ⭐️
🎬 Watch the wild world of finance with the TV series "Black Monday" (2019–2021)! This dark comedy, starring Don Cheadle and Regina Hall, takes you back to October 19, 1987—the worst stock market crash in the history of Wall Street!📉
💡 Blending real-life events with fictional antics, "Black Monday" explores the outrageous and unpredictable factors that led to the financial meltdown. 🎭
🍿 Perfect for a binge-worthy weekend, this series combines humor with a critique of excess and ambition. Catch "Black Monday" for a hilarious yet sharp look at one of history’s craziest financial times! ✨
➡️ TRADE WITH FBS
@fbsanalytics
@fbsanalytics
Please open Telegram to view this post
VIEW IN TELEGRAM
❤39👍25❤🔥7🔥6✍3👏2🎉1🤩1👀1
#Education
💡 Unlock the Simple Trend Strategy! 💡
⚡️ Learn how to use MACD and Parabolic SAR for powerful trend trading. This strategy combines momentum and trend-following indicators to give you a winning edge.
📈 Long Entry:
🟢 Spot a buy signal when MACD crosses above the signal line.
🟢 Confirm with Parabolic SAR dots below the price.
🟢 Buy when the price chart crosses the moving average upwards.
📉 Short Entry:
🟢 Identify a sell signal when MACD crosses below the signal line.
🟢 Confirm with Parabolic SAR dots above the price.
🟢 Sell when the price chart crosses the moving average downwards.
❓Want to master this strategy and boost your trades? Dive into the full tutorial here👇
💡 Unlock the Simple Trend Strategy! 💡
⚡️ Learn how to use MACD and Parabolic SAR for powerful trend trading. This strategy combines momentum and trend-following indicators to give you a winning edge.
📈 Long Entry:
🟢 Spot a buy signal when MACD crosses above the signal line.
🟢 Confirm with Parabolic SAR dots below the price.
🟢 Buy when the price chart crosses the moving average upwards.
📉 Short Entry:
🟢 Identify a sell signal when MACD crosses below the signal line.
🟢 Confirm with Parabolic SAR dots above the price.
🟢 Sell when the price chart crosses the moving average downwards.
❓Want to master this strategy and boost your trades? Dive into the full tutorial here👇
👍65❤21🔥8✍5⚡2👎2😍2👀1