

#TradingEducation
🤓Good Saturday, everyone! Are you ready to learn something new about trading?
Today, we want to talk about correlation. Correlation in Forex is a connection between currency pairs. The stronger the correlation is – the more related their price charts are. There are two types of correlation: positive and negative.
🟢 Positive correlation is extremely high between AUD/USD and NZD/SD, EUR/USD and GBP/USD, USD/JPY and GBP/JPY.
🔴 Negative correlation can be seen between such pairs as EUR/USD and USD/CHF, GBP/USD and USD/CAD, USD/CAD and EUR/JPY.
It is significant for every trader to monitor correlations in the Forex market. For example, traders could accidentally go long on (buy) USD/CAD and go short on (sell) EUR/JPY thinking they have opened two different trades. But, instead, these pairs tend to move in opposite directions since these currency pairs have a strong negative correlation.
Which Forex correlation trading strategies exist?
◽️Coping strategy - When one positively correlated pair is rising and the other is lagging, you can predict with a great possibility its future movement simply by looking at its twin.
◽️Double-check strategy - If you open orders with correlated pairs, be cautious as you can increase the level of risk you take. Use signals from both correlated pairs.
◽️Hedging strategy - If a trader place a buy order for two pairs that are negatively correlated, one of the trades will cover the losses.
Let's chat! Do you use Forex correlations in trading?
For more insights on correlations in trading, visit the FBS website: https://bit.ly/3BxutwN
🤓Good Saturday, everyone! Are you ready to learn something new about trading?
Today, we want to talk about correlation. Correlation in Forex is a connection between currency pairs. The stronger the correlation is – the more related their price charts are. There are two types of correlation: positive and negative.
🟢 Positive correlation is extremely high between AUD/USD and NZD/SD, EUR/USD and GBP/USD, USD/JPY and GBP/JPY.
🔴 Negative correlation can be seen between such pairs as EUR/USD and USD/CHF, GBP/USD and USD/CAD, USD/CAD and EUR/JPY.
It is significant for every trader to monitor correlations in the Forex market. For example, traders could accidentally go long on (buy) USD/CAD and go short on (sell) EUR/JPY thinking they have opened two different trades. But, instead, these pairs tend to move in opposite directions since these currency pairs have a strong negative correlation.
Which Forex correlation trading strategies exist?
◽️Coping strategy - When one positively correlated pair is rising and the other is lagging, you can predict with a great possibility its future movement simply by looking at its twin.
◽️Double-check strategy - If you open orders with correlated pairs, be cautious as you can increase the level of risk you take. Use signals from both correlated pairs.
◽️Hedging strategy - If a trader place a buy order for two pairs that are negatively correlated, one of the trades will cover the losses.
Let's chat! Do you use Forex correlations in trading?
For more insights on correlations in trading, visit the FBS website: https://bit.ly/3BxutwN

👍55🔥11❤5🥰1👏1
🔥 Last week was full of surprises!
The US dollar plunged despite a better-than-expected retail sales report. EUR/USD bounced off the 1.1290 support and reached 1.1385. Stock indices traded sideways. Bitcoin did not break through $44 000 and returned to $40 000.
Do you want to know what this week will bring us? If yes, click the link! ➡️ https://bit.ly/3LLlGvW
The US dollar plunged despite a better-than-expected retail sales report. EUR/USD bounced off the 1.1290 support and reached 1.1385. Stock indices traded sideways. Bitcoin did not break through $44 000 and returned to $40 000.
Do you want to know what this week will bring us? If yes, click the link! ➡️ https://bit.ly/3LLlGvW
FBS
Market Outlook For February 21-25
The US dollar plunged despite a better-than-expected retail sales report. EUR/USD bounced off the 1.1290 support and reached 1.1385.
👍19🔥5👏3
#MarketNews
📈📉Tensions between Russia and Ukraine keep influencing the market. Still, there are diplomatic efforts to bring both sides back from the brink of war. Presidents Joe Biden and Vladimir Putin may have a summit on the condition that Russia does not invade Ukraine.
🔺Russia’s ruble rose as much as 1.1% and the dollar plunged in offshore trading.
🛢Oil fluctuated and nickel jumped in part as investors assess what might happen to commodity prices if the Ukraine situation worsens.
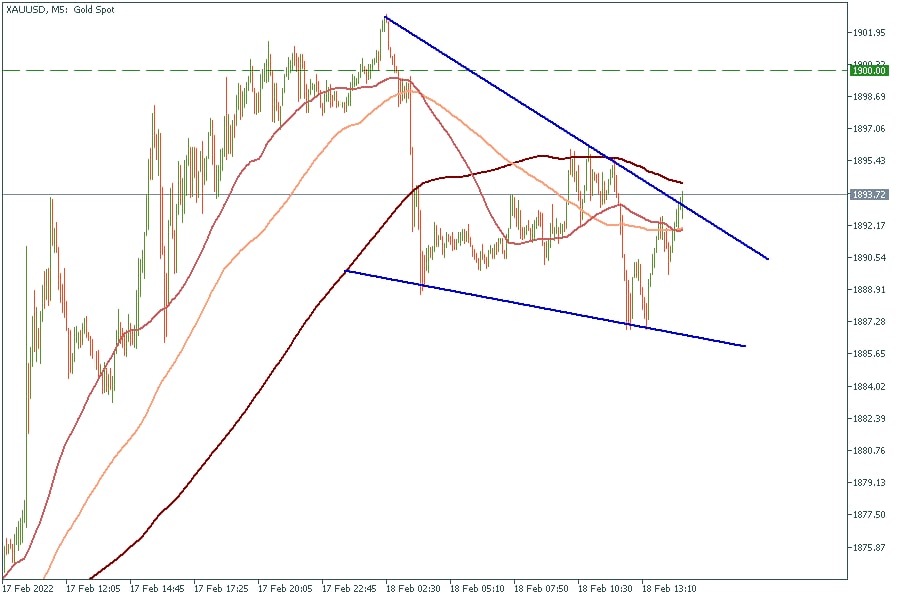
🟡Demand for safe havens calmed a little, taking gold below $1,900 an ounce.
💹The Nasdaq 100, S&P 500 and European contracts bounced back and turned higher, while the Asia-Pacific stock index rose from lows but remained in red.
What’s your trading ideas this week? Share in the comments below!
📈📉Tensions between Russia and Ukraine keep influencing the market. Still, there are diplomatic efforts to bring both sides back from the brink of war. Presidents Joe Biden and Vladimir Putin may have a summit on the condition that Russia does not invade Ukraine.
🔺Russia’s ruble rose as much as 1.1% and the dollar plunged in offshore trading.
🛢Oil fluctuated and nickel jumped in part as investors assess what might happen to commodity prices if the Ukraine situation worsens.
🟡Demand for safe havens calmed a little, taking gold below $1,900 an ounce.
💹The Nasdaq 100, S&P 500 and European contracts bounced back and turned higher, while the Asia-Pacific stock index rose from lows but remained in red.
What’s your trading ideas this week? Share in the comments below!
👍14
🔥AUD/USD reached the resistance area!
The US dollar index is trading right above the ascending trend line. So it looks like today, USD will strengthen. As a result, USD/*** will increase, and ***/USD will decrease.
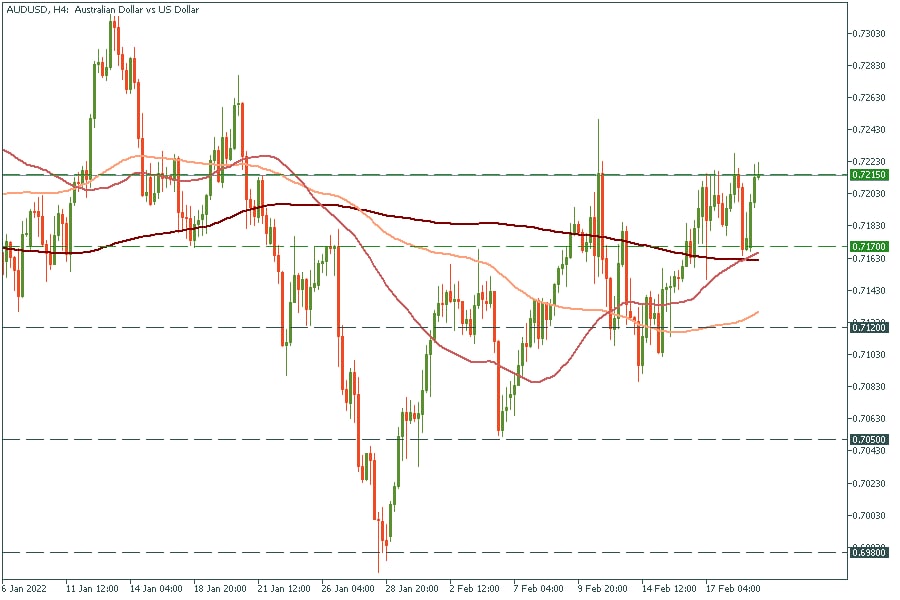
Let's look at AUD/USD. The pair reached the 0.7215 resistance level. If the H4 candle closes below this level, it will signal an upcoming reversal. In this case, the target will be at 0.7170!
✅TRADE NOW - https://bit.ly/2NH9X88
The US dollar index is trading right above the ascending trend line. So it looks like today, USD will strengthen. As a result, USD/*** will increase, and ***/USD will decrease.
Let's look at AUD/USD. The pair reached the 0.7215 resistance level. If the H4 candle closes below this level, it will signal an upcoming reversal. In this case, the target will be at 0.7170!
✅TRADE NOW - https://bit.ly/2NH9X88
👍15
👋Ladies and gentlemen!
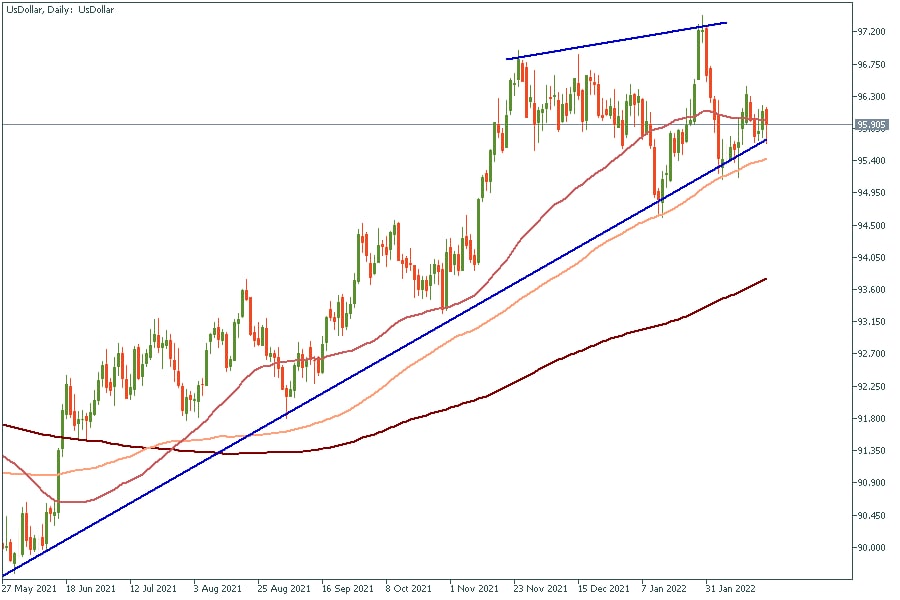
The US dollar index (DXY) increases after a solid consolidation above the trend line. The index still has the potential to increase to 97.3.
🧐What to do?
Consider buying USD/*** pairs (USD/CAD) and selling ***/USD pairs (GBP/USD).
The US dollar index (DXY) increases after a solid consolidation above the trend line. The index still has the potential to increase to 97.3.
🧐What to do?
Consider buying USD/*** pairs (USD/CAD) and selling ***/USD pairs (GBP/USD).
👍11💩1
🥇 Gold - safe-haven!
During the past several weeks, Gold has been growing due to the geopolitical crisis in Eastern Europe. Today, US president Joe Biden asked Emmanuel Macron to host a summit with Vladimir Putin. This news brought some positive on the Russian stock market, as most of the stocks bounced from support levels.
We believe that positive will keep on markets for next several days. That's why we consider selling Gold in the 1898 - 1905 range.
📈Technical analysis
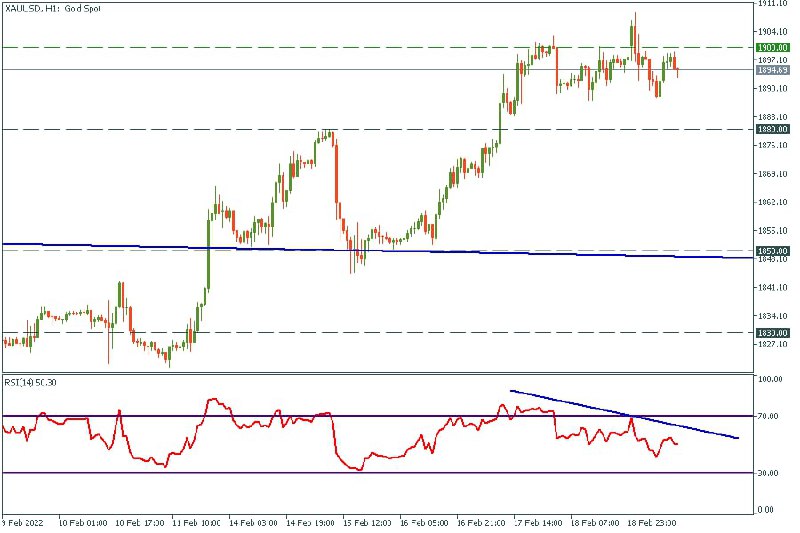
On the H1 chart, we can notice a bearish divergence, and it looks like buyers do not have enough power to break through $1900.
✅Targets
The closest target for the correction is $1880. As soon as the price breaks through this support, it might decline to $1850.
🧐What are your thoughts about yellow metal?
During the past several weeks, Gold has been growing due to the geopolitical crisis in Eastern Europe. Today, US president Joe Biden asked Emmanuel Macron to host a summit with Vladimir Putin. This news brought some positive on the Russian stock market, as most of the stocks bounced from support levels.
We believe that positive will keep on markets for next several days. That's why we consider selling Gold in the 1898 - 1905 range.
📈Technical analysis
On the H1 chart, we can notice a bearish divergence, and it looks like buyers do not have enough power to break through $1900.
✅Targets
The closest target for the correction is $1880. As soon as the price breaks through this support, it might decline to $1850.
🧐What are your thoughts about yellow metal?
👍30🔥2👏2🤮1
👀Let's look at the US stock market!
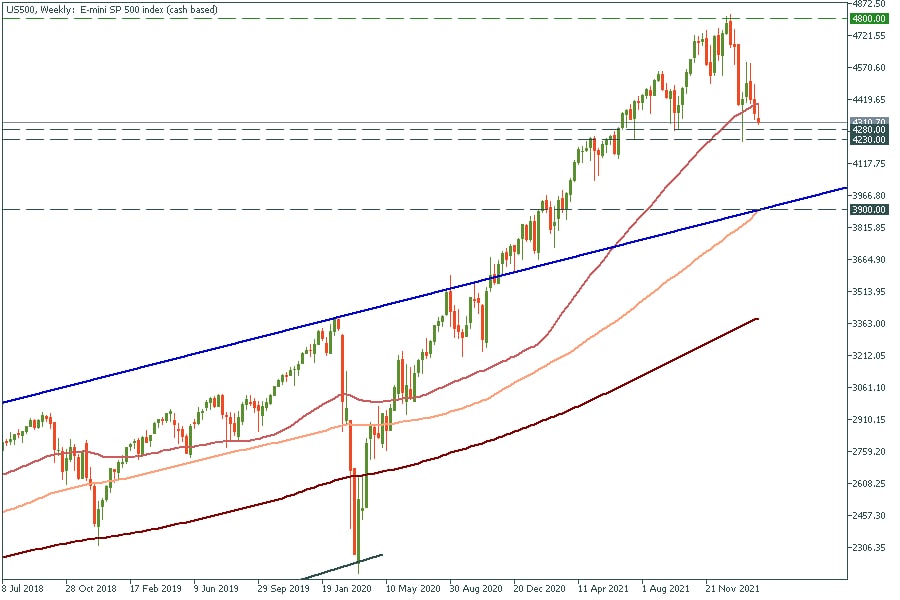
🔴Since May 2020, the weekly candle has closed below the 50-week moving average for the first time. Moreover, today the price retested this line from below and dropped after.
❗️This week will be decisive for the US stock market! If the price breaks through the 4230-4280 range, the head-with-shoulders pattern will be closed and the price will head towards 3900 (global trend line and the 100-week moving average crosspoint).
🟢On the other hand, if the US500 reverses at this support range, the double bottom pattern will appear, and the price will head towards 4800.
🔴Since May 2020, the weekly candle has closed below the 50-week moving average for the first time. Moreover, today the price retested this line from below and dropped after.
❗️This week will be decisive for the US stock market! If the price breaks through the 4230-4280 range, the head-with-shoulders pattern will be closed and the price will head towards 3900 (global trend line and the 100-week moving average crosspoint).
🟢On the other hand, if the US500 reverses at this support range, the double bottom pattern will appear, and the price will head towards 4800.
👍23🔥2💩1
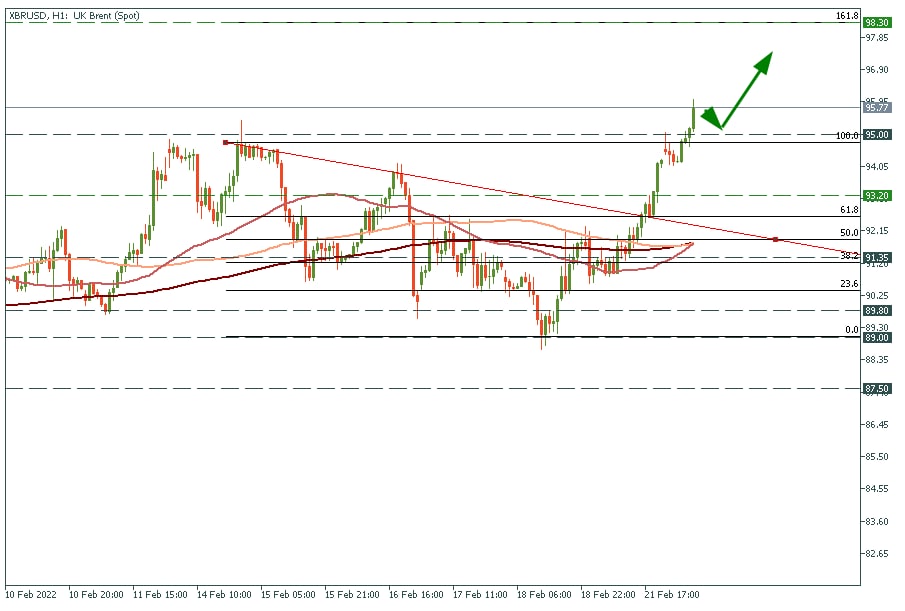
🆘Brent broke through the $95 resistance due to the tension in Eastern Europe.
The next target is $98.3.
Are you trading oil right now?
The next target is $98.3.
Are you trading oil right now?
👏3👍2🤮1
#MarketNews
🌤 Morning, traders! Though we don’t trade Russian stocks, it was an intense day for them and the Russian ruble. The currency lost 6% against the dollar amid Vladimir Putin’s speech. The president decided to declare the independence of two Ukrainian regions. The conflict between Russia and the US escalates and pressures on stock markets worldwide. Turn on notifications in this channel to stay in touch with market events!
🇨🇳 HK50 lost 6.5% amid the strongest Covid-19 outbreak since 2020 Wuhan.
👨🦳Putin orders troops to eastern Ukraine with a peacekeeping operation. Western nations will invoke sanctions on Russia, for which US President Joe Biden has already signed an executive order to prohibit trade and investment between US individuals and the two breakaway regions of eastern Ukraine
💶 EUR/USD sinks to test below 1.1300. A double bottom pattern has been formed on the chart, with targets at 1.1400 and 1.1500.
🛢 Oil, nickel, and aluminum jumped as traders weighed the risk of supply disruptions from potential Western sanctions. European gas surged over 10%.
🥇 Gold reached our first target at $1915. After a pullback, we expect the metal to reach $1965.
🤔 What are your thoughts on the market today?
🌤 Morning, traders! Though we don’t trade Russian stocks, it was an intense day for them and the Russian ruble. The currency lost 6% against the dollar amid Vladimir Putin’s speech. The president decided to declare the independence of two Ukrainian regions. The conflict between Russia and the US escalates and pressures on stock markets worldwide. Turn on notifications in this channel to stay in touch with market events!
🇨🇳 HK50 lost 6.5% amid the strongest Covid-19 outbreak since 2020 Wuhan.
👨🦳Putin orders troops to eastern Ukraine with a peacekeeping operation. Western nations will invoke sanctions on Russia, for which US President Joe Biden has already signed an executive order to prohibit trade and investment between US individuals and the two breakaway regions of eastern Ukraine
💶 EUR/USD sinks to test below 1.1300. A double bottom pattern has been formed on the chart, with targets at 1.1400 and 1.1500.
🛢 Oil, nickel, and aluminum jumped as traders weighed the risk of supply disruptions from potential Western sanctions. European gas surged over 10%.
🥇 Gold reached our first target at $1915. After a pullback, we expect the metal to reach $1965.
🤔 What are your thoughts on the market today?
👍16💩1
👍20🔥8💩1
🤩 Did you miss the stock market opportunities? Check this out!
There are plenty of opportunities for stock trading with the releases of earnings reports. The most important ones (that you can trade with FBS) are listed below!
Tuesday
▫️Virgin Galactic
Forecasts:
EPS $-0.34
Revenue $330k
Wednesday
▫️eBay
Forecasts:
EPS $1
Revenue $2.61B
▫️Booking
Forecasts:
EPS $13.68
Revenue $2.85B
Thursday
▫️Coinbase
Forecasts:
EPS $1.85
Revenue $1.91B
▫️Moderna
Forecasts:
EPS $9.9
Revenue $6.79B
▫️Alibaba
Forecasts:
EPS $2.56
Revenue $38.92B
If the actual level is higher than the forecasts, stocks of the mentioned companies will rise. Otherwise - fall. For more details, check the article on the FBS website: https://bit.ly/3h4e4GP
There are plenty of opportunities for stock trading with the releases of earnings reports. The most important ones (that you can trade with FBS) are listed below!
Tuesday
▫️Virgin Galactic
Forecasts:
EPS $-0.34
Revenue $330k
Wednesday
▫️eBay
Forecasts:
EPS $1
Revenue $2.61B
▫️Booking
Forecasts:
EPS $13.68
Revenue $2.85B
Thursday
▫️Coinbase
Forecasts:
EPS $1.85
Revenue $1.91B
▫️Moderna
Forecasts:
EPS $9.9
Revenue $6.79B
▫️Alibaba
Forecasts:
EPS $2.56
Revenue $38.92B
If the actual level is higher than the forecasts, stocks of the mentioned companies will rise. Otherwise - fall. For more details, check the article on the FBS website: https://bit.ly/3h4e4GP

👍12💩1
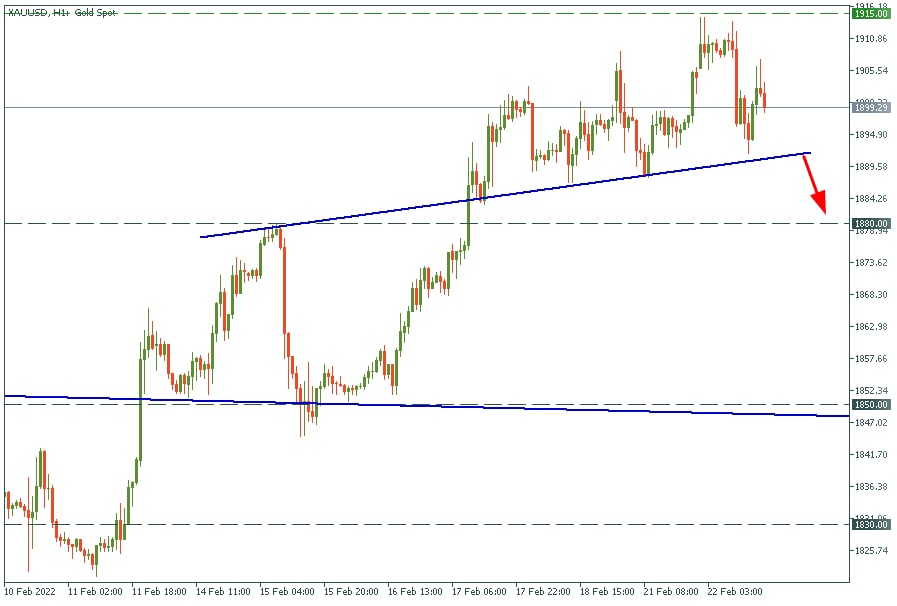
🥇Gold gets under pressure as tension eases.
Wait for the breakout of blue trend line and consider opening sell trade with a target at $1880.
✅Also, you might consider selling the yellow metal, if it reaches the previous high at $1915.
✅Start trading - https://bit.ly/2NH9X88
Wait for the breakout of blue trend line and consider opening sell trade with a target at $1880.
✅Also, you might consider selling the yellow metal, if it reaches the previous high at $1915.
✅Start trading - https://bit.ly/2NH9X88
👍16🤮2🔥1
❓Is crypto winter coming? Part 1
On Tuesday, February 22, Bitcoin fell by 7%, to a minimum of $36.3 thousand since February 3. Its market capitalization has fallen below $700 billion.
The total capitalization of the crypto market decreased by 7.6%, to $1.7 trillion.
The market continues to decline after bitcoin failed to stay above $44,000 last week. Since then, the cryptocurrency has lost more than 18%.
Sentiment
Earlier, the Huobi crypto exchange co-founder, Du Jun, suggested that Bitcoin has entered the early stage of the "bear" market. According to the specialist's opinion, the cryptocurrency will decline until the end of 2024 or the beginning of 2025. Jun explained that the bullish movements of Bitcoin are directly related to the halving, so the next wave of the asset's growth should be expected only after the next halving.
Moreover, the crypto market still gets pressed by uncertainty with the cryptocurrencies regulation in Russia and the United States.
To be continued...👇
On Tuesday, February 22, Bitcoin fell by 7%, to a minimum of $36.3 thousand since February 3. Its market capitalization has fallen below $700 billion.
The total capitalization of the crypto market decreased by 7.6%, to $1.7 trillion.
The market continues to decline after bitcoin failed to stay above $44,000 last week. Since then, the cryptocurrency has lost more than 18%.
Sentiment
Earlier, the Huobi crypto exchange co-founder, Du Jun, suggested that Bitcoin has entered the early stage of the "bear" market. According to the specialist's opinion, the cryptocurrency will decline until the end of 2024 or the beginning of 2025. Jun explained that the bullish movements of Bitcoin are directly related to the halving, so the next wave of the asset's growth should be expected only after the next halving.
Moreover, the crypto market still gets pressed by uncertainty with the cryptocurrencies regulation in Russia and the United States.
To be continued...👇
👍11👏2🤬2
Is crypto winter coming? Part 2
Fundamental
Bitcoin is a risky asset despite its limited supply. The correlation between Bitcoin and the US 500 reached the highest values in recent months. As you know, during recent months, the problem of rising inflation has been pressing markets and Bitcoins as well. In February, geopolitical risks dumped markets even deeper.
We believe the current correction is close to culmination, and markets will turn green after the FOMC meeting in March 2022.
Investors are pricing FOMC to increase the key rate by 50 basis points in March 2022. These expectations are very bold, especially with the huge US debt.
"Buy are rumors, sell the news," the famous saying might work this time as well. After the key rate increase in March, traders and investors might become brave again and turn their view to risk assets as inflation will not go away.
Geopolitical conflict in Eastern Europe is also fading away, as the president of Russia, Vladimir Putin, has signed the decree recognizing the independence of the Donetsk People's Republic and the Luhansk People's Republic without any hostilities.
Technical analysis
First scenario
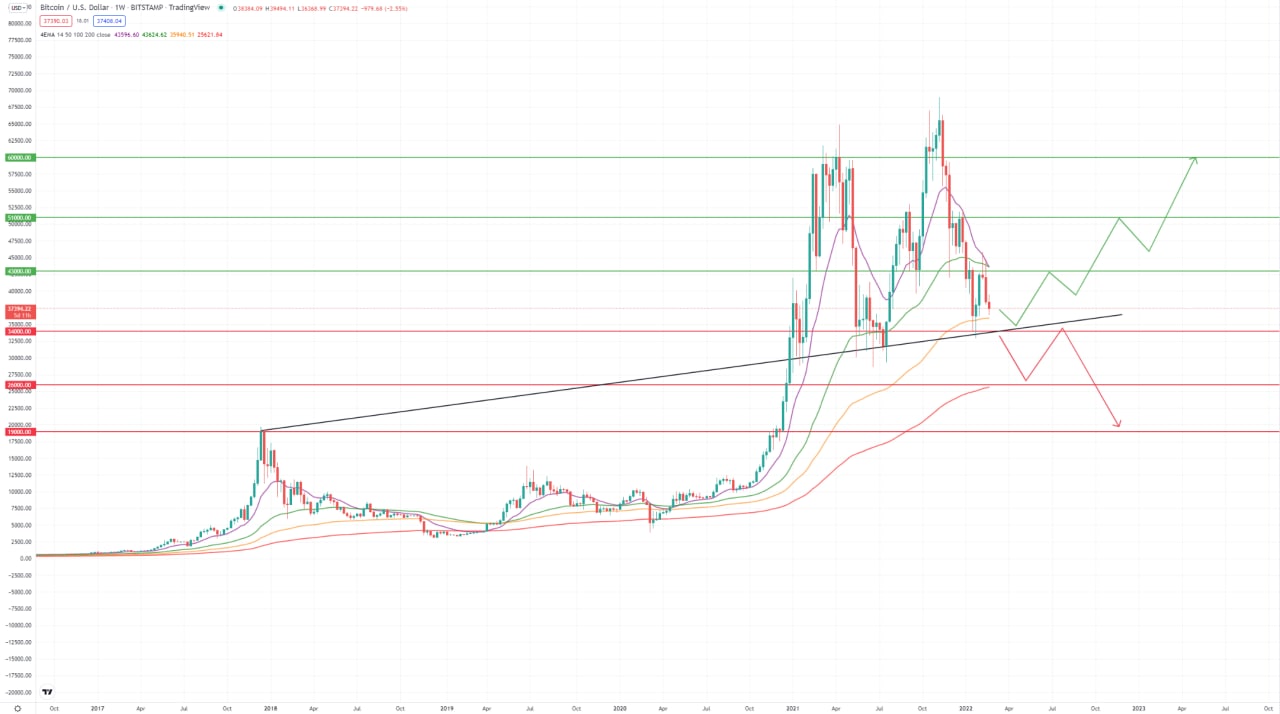
Bitcoin is consolidating above the global trend line (the black one) with pretty low RSI numbers on the weekly timeframe. We assume the potential reversal to happen around $34.000 level with the test of this line. In this case, the price will form a double bottom pattern, and the closest target will be $43.000. $51.000 and $60.000 are long-term targets.
Bitcoin dominance has formed the descending triangle, usually a bearish pattern. It looks like the dominance might reverse out of the channel's upper border, and at this particular moment, the crypto spring will begin. (Usually, when domination falls, Bitcoin rises, and alt-coins rise two times faster). Moreover, as soon as the dominance breaks through the lower border of the triangle, the crypto market will fly vertically.
If we compare Bitcoin's chart with US500 in the 2000s, we can notice prices movements look pretty similar, and you can see how far the US index has gone ten years after. Many traders believe a double top pattern appeared on Bitcoin's chart, but it might be a long consolidation ahead of the upcoming massive pump.
Conclusion
✅We suggest traders consider looking for Bitcoin buy trades at $33.000-$35.000, follow the green line scenario and wait for big profits.
🆘P.S. If Bitcoin closes weekly candle below $32.000, it will fall to $26.000. Sell Bitcoin and follow the red line scenario.
Fundamental
Bitcoin is a risky asset despite its limited supply. The correlation between Bitcoin and the US 500 reached the highest values in recent months. As you know, during recent months, the problem of rising inflation has been pressing markets and Bitcoins as well. In February, geopolitical risks dumped markets even deeper.
We believe the current correction is close to culmination, and markets will turn green after the FOMC meeting in March 2022.
Investors are pricing FOMC to increase the key rate by 50 basis points in March 2022. These expectations are very bold, especially with the huge US debt.
"Buy are rumors, sell the news," the famous saying might work this time as well. After the key rate increase in March, traders and investors might become brave again and turn their view to risk assets as inflation will not go away.
Geopolitical conflict in Eastern Europe is also fading away, as the president of Russia, Vladimir Putin, has signed the decree recognizing the independence of the Donetsk People's Republic and the Luhansk People's Republic without any hostilities.
Technical analysis
First scenario
Bitcoin is consolidating above the global trend line (the black one) with pretty low RSI numbers on the weekly timeframe. We assume the potential reversal to happen around $34.000 level with the test of this line. In this case, the price will form a double bottom pattern, and the closest target will be $43.000. $51.000 and $60.000 are long-term targets.
Bitcoin dominance has formed the descending triangle, usually a bearish pattern. It looks like the dominance might reverse out of the channel's upper border, and at this particular moment, the crypto spring will begin. (Usually, when domination falls, Bitcoin rises, and alt-coins rise two times faster). Moreover, as soon as the dominance breaks through the lower border of the triangle, the crypto market will fly vertically.
If we compare Bitcoin's chart with US500 in the 2000s, we can notice prices movements look pretty similar, and you can see how far the US index has gone ten years after. Many traders believe a double top pattern appeared on Bitcoin's chart, but it might be a long consolidation ahead of the upcoming massive pump.
Conclusion
✅We suggest traders consider looking for Bitcoin buy trades at $33.000-$35.000, follow the green line scenario and wait for big profits.
🆘P.S. If Bitcoin closes weekly candle below $32.000, it will fall to $26.000. Sell Bitcoin and follow the red line scenario.
👍22🔥5👏5❤2🤬2
☀️Morning traders! Bitcoin trade idea!
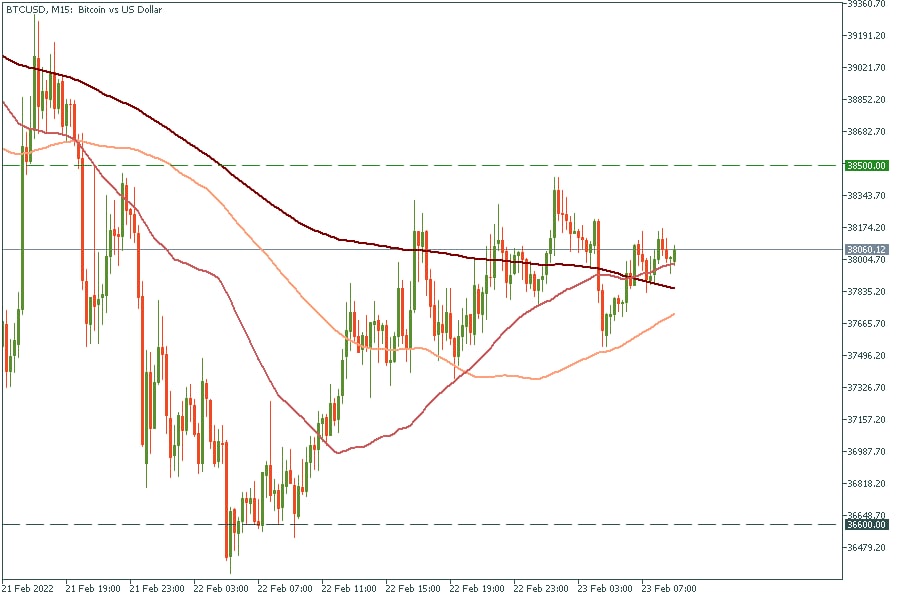
Trade: SELL
SL: 38500
TP: 36600
Risk/reward ratio: 1/3
✅Start trading - https://bit.ly/2NH9X88
Trade: SELL
SL: 38500
TP: 36600
Risk/reward ratio: 1/3
✅Start trading - https://bit.ly/2NH9X88
👍7💩4❤1

FBS Analytics
🥇Gold gets under pressure as tension eases. Wait for the breakout of blue trend line and consider opening sell trade with a target at $1880. ✅Also, you might consider selling the yellow metal, if it reaches the previous high at $1915. ✅Start trading…
Breakout happened! Trade is active!
👏14💩8👍5❤1🤔1