
🇺🇸💸💰💵#USD
🔥😱The US dollar is about to strengthen against other assets!
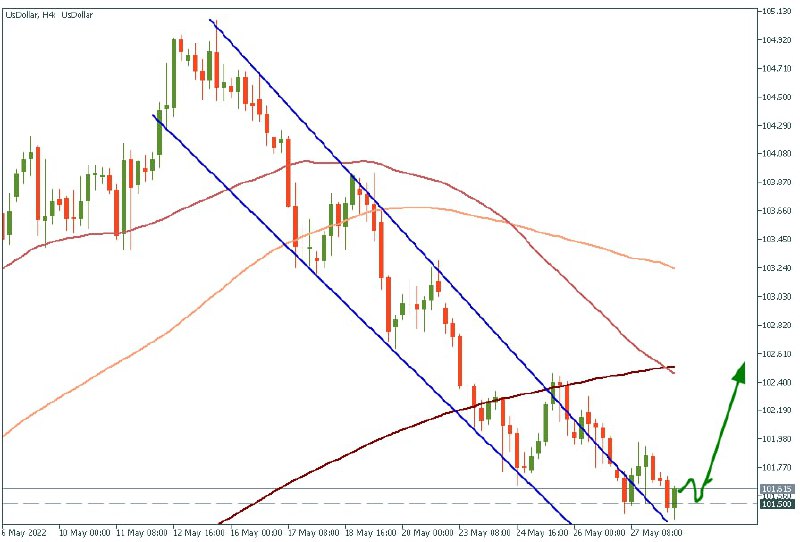
The US dollar index (DXY) broke out of the descending channel and found the local support at 101.50! The price might explode at any time. Be careful!
Traders might consider looking for BUY USD/*** trades and SELL risk assets (EURUSD, stock market, crypto) trades!
❗️Usually, if the US dollar rises, risk assets fall! ❗️
✅START TRADING✅
🔥😱The US dollar is about to strengthen against other assets!
The US dollar index (DXY) broke out of the descending channel and found the local support at 101.50! The price might explode at any time. Be careful!
Traders might consider looking for BUY USD/*** trades and SELL risk assets (EURUSD, stock market, crypto) trades!
❗️Usually, if the US dollar rises, risk assets fall! ❗️
✅START TRADING✅
👍35😁12🎉6❤4🔥3
📆calendar
KEY EVENTS FOR THE COMING WEEK:
Monday, 30 May
🇺🇸USA - no auction - Memorial Day
🇪🇺On May 30-31, the EU will discuss the issue of legalizing the confiscation of Russian assets in the jurisdiction of the European Union
Tuesday, 31 May
🇨🇳China - Composite/Manufacturing/Non-Manufacturing PMI (May)
🇪🇺EU - Consumer Inflation CPI (May) - 12:00 GMT+3
🇪🇺EU leaders summit
🇨🇦Canada - GDP (Q1) - 15:30 GMT+3
🇺🇸USA - Chicago PMI (May) - 16:45 GMT+3
🇺🇸USA - Consumer Confidence (May) - 17:00 GMT+3
Wednesday, 1 June
🇨🇳China -Caixin Manufacturing PMI (May) - 4:45 GMT+3
🇩🇪Germany -Manufacturing PMI (May) - 10:55 GMT+3
🇪🇺EU - Manufacturing PMI (May) - 11:00 GMT+3
🇪🇺EU - Unemployment (Apr) -12:00 GMT+3
🇪🇺Lagarde -14:00 GMT+3
🇺🇸USA -Manufacturing PMI (May) - 16:45 GMT+3
🇺🇸USA - Construction Spending (Apr) - 17:00 GMT+3
🇺🇸USA - ISM Manufacturing PMI (May) - 17:00 GMT+3
🇨🇦Canada - Central Bank rate - 17:00 GMT+3
Thursday, 2 June
🇬🇧Britain - no trades - Bank Holiday
🇨🇭Switzerland - consumer inflation CPI (May) -09:30 GMT+3
🇺🇸USA - ADP Nonfarm Employment (May) - 15:15 GMT+3
🇺🇸USA - Initial Jobless Claims - 15:30 GMT+3
🇺🇸USA -Factory Orders (Apr) - 17:00 GMT+3
🛢Natural gas USA - EIA reserves - 17:30 GMT+3
🛢 US oil - EIA reserves - 18:00 GMT+3
Friday, 3 June
🇬🇧Britain - no trades - Bank Holiday
🇹🇷Turkey --consumption inflation CPI (May) -10:00 GMT+3
🇩🇪Germany - Composite/Services PMI (May) - 10:55 GMT+3
🇪🇺EU -Retail Sales/Final Services PMI (May) - 11:00 GMT+3
🇺🇸USA -Nonfarm Payrolls (May) -15:30 GMT+3
🇺🇸USA - Composite/Services PMI (May) - 16:45 GMT+3
🇺🇸USA -ISM Non-Manufacturing PMI (May) -17:00 GMT+3
😈What events are you going to trade this week?
KEY EVENTS FOR THE COMING WEEK:
Monday, 30 May
🇺🇸USA - no auction - Memorial Day
🇪🇺On May 30-31, the EU will discuss the issue of legalizing the confiscation of Russian assets in the jurisdiction of the European Union
Tuesday, 31 May
🇨🇳China - Composite/Manufacturing/Non-Manufacturing PMI (May)
🇪🇺EU - Consumer Inflation CPI (May) - 12:00 GMT+3
🇪🇺EU leaders summit
🇨🇦Canada - GDP (Q1) - 15:30 GMT+3
🇺🇸USA - Chicago PMI (May) - 16:45 GMT+3
🇺🇸USA - Consumer Confidence (May) - 17:00 GMT+3
Wednesday, 1 June
🇨🇳China -Caixin Manufacturing PMI (May) - 4:45 GMT+3
🇩🇪Germany -Manufacturing PMI (May) - 10:55 GMT+3
🇪🇺EU - Manufacturing PMI (May) - 11:00 GMT+3
🇪🇺EU - Unemployment (Apr) -12:00 GMT+3
🇪🇺Lagarde -14:00 GMT+3
🇺🇸USA -Manufacturing PMI (May) - 16:45 GMT+3
🇺🇸USA - Construction Spending (Apr) - 17:00 GMT+3
🇺🇸USA - ISM Manufacturing PMI (May) - 17:00 GMT+3
🇨🇦Canada - Central Bank rate - 17:00 GMT+3
Thursday, 2 June
🇬🇧Britain - no trades - Bank Holiday
🇨🇭Switzerland - consumer inflation CPI (May) -09:30 GMT+3
🇺🇸USA - ADP Nonfarm Employment (May) - 15:15 GMT+3
🇺🇸USA - Initial Jobless Claims - 15:30 GMT+3
🇺🇸USA -Factory Orders (Apr) - 17:00 GMT+3
🛢Natural gas USA - EIA reserves - 17:30 GMT+3
🛢 US oil - EIA reserves - 18:00 GMT+3
Friday, 3 June
🇬🇧Britain - no trades - Bank Holiday
🇹🇷Turkey --consumption inflation CPI (May) -10:00 GMT+3
🇩🇪Germany - Composite/Services PMI (May) - 10:55 GMT+3
🇪🇺EU -Retail Sales/Final Services PMI (May) - 11:00 GMT+3
🇺🇸USA -Nonfarm Payrolls (May) -15:30 GMT+3
🇺🇸USA - Composite/Services PMI (May) - 16:45 GMT+3
🇺🇸USA -ISM Non-Manufacturing PMI (May) -17:00 GMT+3
😈What events are you going to trade this week?
Forex Broker Online
Forex Economic Calendar: Analyze Financial Markets | FBS
Follow news and financial changes with the FBS Economic Calendar. Analyze economic news and build a trading strategy using our calendar for currencies, stocks, and dividends.
👍33❤11🔥5
#tradingstatistics
💰Do you remember how we gave you statistics on every signal in April? Here is the link. Now it’s time to collect the data from May and share it with you!
✅TP – take profit. ❌ SL – stop loss.
✅BUY XBRUSD – TP 450 points
✅BUY XNGUSD – 850 points profit
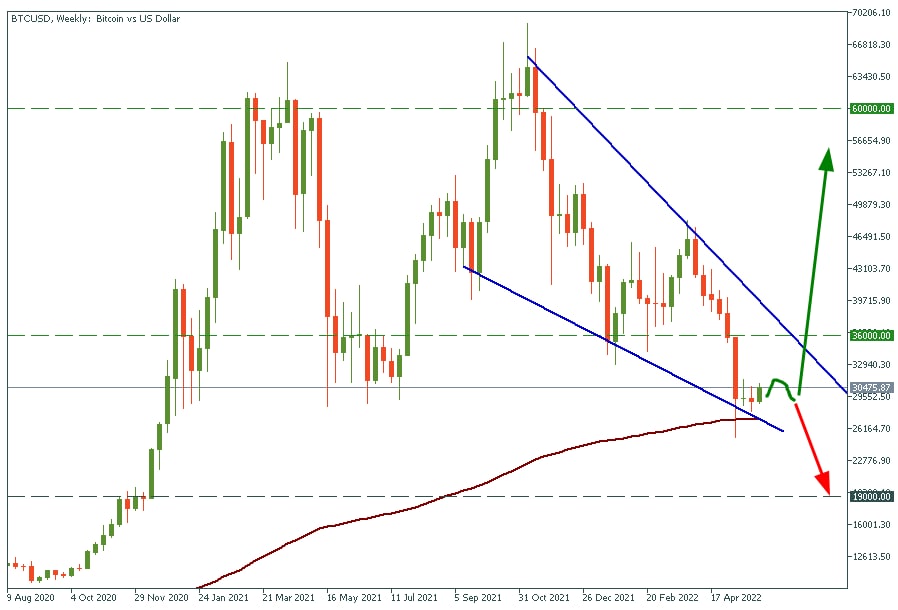
✅SELL BTCUSD – TP 350K points (a 9.68% move)
✅SELL XBRUSD – TP 450 points
✅SELL US500 – 33.5K points profit (an 8% move)
❌BUY EURUSD – SL 700 points
✅SELL XBRUSD – TP 150 points
✅BUY XAUUSD – 500 points profit, still in play (a long-term trade)
✅SELL BTCUSD – TP 35K points (a 4.5% move)
✅SELL US100 – 63K points profit (a 5% move)
✅BUY US500 – TP 38K points (a 10% move)
❌SELL USDJPY – 750 points loss, still in play (a long-term trade)
✅SELL BTCUSD – 200K points profit, didn’t reach the target
✅BUY XAUUSD – TP 4500 points
✅SELL BTCUSD – 200K profit (a 6.5% move)
❌SELL XNGUSD – 500 points loss, still in play (a long-term trade)
✅BUY XBRUSD – 350 points profit, still in play (a long-term trade)
✅SELL US100 – TP 63K points (a 5.1% move)
✅BUY USDTRY – 18K points profit, still going up
✅BUY US500 – TP 21K points (a 5% move)
✅US100 – TP 77K points (a 6.6% move)
✅BUY XAUUSD – TP 3300 points
✅SELL BTCUSD – TP 30K points (a 3% move)
❌SELL EURUSD – SL 450 points
✅SELL BTCUSD – TP 100K points (a 3.4% move)
❌BUY USDJPY - SL 350 points
❌SELL USDJPY – SL 300 points
✅BUY EURUSD – TP 600 points
❌SELL EURUSD – 250 points loss, still in play
❌SELL XNGUSD – 100 points loss, still in play
This time we tried to set more Stop Loss levels for you to trade easier. And in the result, we got:
🔥 25 750 points of profit on Forex, Gold, and Oil!
🔥 1 228 000 points of profit in Indices and Crypto!
(points in these two categories are calculated differently, so we decided to give the result separately because we don’t want to confuse you with wrong numbers)
📊 In May, we had 30 trade ideas, 74% of trades are profitable, and some trades are still in play, meaning they can go green later. Some other channels give hundreds of trade ideas every month and delete bad ones in the end. We want to be honest with you, and all our trades are real; we don’t delete anything.
An excellent risk-reward ratio and consistent (and profitable) trading strategy are what we need to show such results.
Once again, you are the best clients, and we do our best to deliver you the best analytical and educational content. Thank you for everything! Don’t stop learning, and trade with FBS 💚
💰Do you remember how we gave you statistics on every signal in April? Here is the link. Now it’s time to collect the data from May and share it with you!
✅TP – take profit. ❌ SL – stop loss.
✅BUY XBRUSD – TP 450 points
✅BUY XNGUSD – 850 points profit
✅SELL BTCUSD – TP 350K points (a 9.68% move)
✅SELL XBRUSD – TP 450 points
✅SELL US500 – 33.5K points profit (an 8% move)
❌BUY EURUSD – SL 700 points
✅SELL XBRUSD – TP 150 points
✅BUY XAUUSD – 500 points profit, still in play (a long-term trade)
✅SELL BTCUSD – TP 35K points (a 4.5% move)
✅SELL US100 – 63K points profit (a 5% move)
✅BUY US500 – TP 38K points (a 10% move)
❌SELL USDJPY – 750 points loss, still in play (a long-term trade)
✅SELL BTCUSD – 200K points profit, didn’t reach the target
✅BUY XAUUSD – TP 4500 points
✅SELL BTCUSD – 200K profit (a 6.5% move)
❌SELL XNGUSD – 500 points loss, still in play (a long-term trade)
✅BUY XBRUSD – 350 points profit, still in play (a long-term trade)
✅SELL US100 – TP 63K points (a 5.1% move)
✅BUY USDTRY – 18K points profit, still going up
✅BUY US500 – TP 21K points (a 5% move)
✅US100 – TP 77K points (a 6.6% move)
✅BUY XAUUSD – TP 3300 points
✅SELL BTCUSD – TP 30K points (a 3% move)
❌SELL EURUSD – SL 450 points
✅SELL BTCUSD – TP 100K points (a 3.4% move)
❌BUY USDJPY - SL 350 points
❌SELL USDJPY – SL 300 points
✅BUY EURUSD – TP 600 points
❌SELL EURUSD – 250 points loss, still in play
❌SELL XNGUSD – 100 points loss, still in play
This time we tried to set more Stop Loss levels for you to trade easier. And in the result, we got:
🔥 25 750 points of profit on Forex, Gold, and Oil!
🔥 1 228 000 points of profit in Indices and Crypto!
(points in these two categories are calculated differently, so we decided to give the result separately because we don’t want to confuse you with wrong numbers)
📊 In May, we had 30 trade ideas, 74% of trades are profitable, and some trades are still in play, meaning they can go green later. Some other channels give hundreds of trade ideas every month and delete bad ones in the end. We want to be honest with you, and all our trades are real; we don’t delete anything.
An excellent risk-reward ratio and consistent (and profitable) trading strategy are what we need to show such results.
Once again, you are the best clients, and we do our best to deliver you the best analytical and educational content. Thank you for everything! Don’t stop learning, and trade with FBS 💚
👍77❤20🔥14👏7
#MarketNews
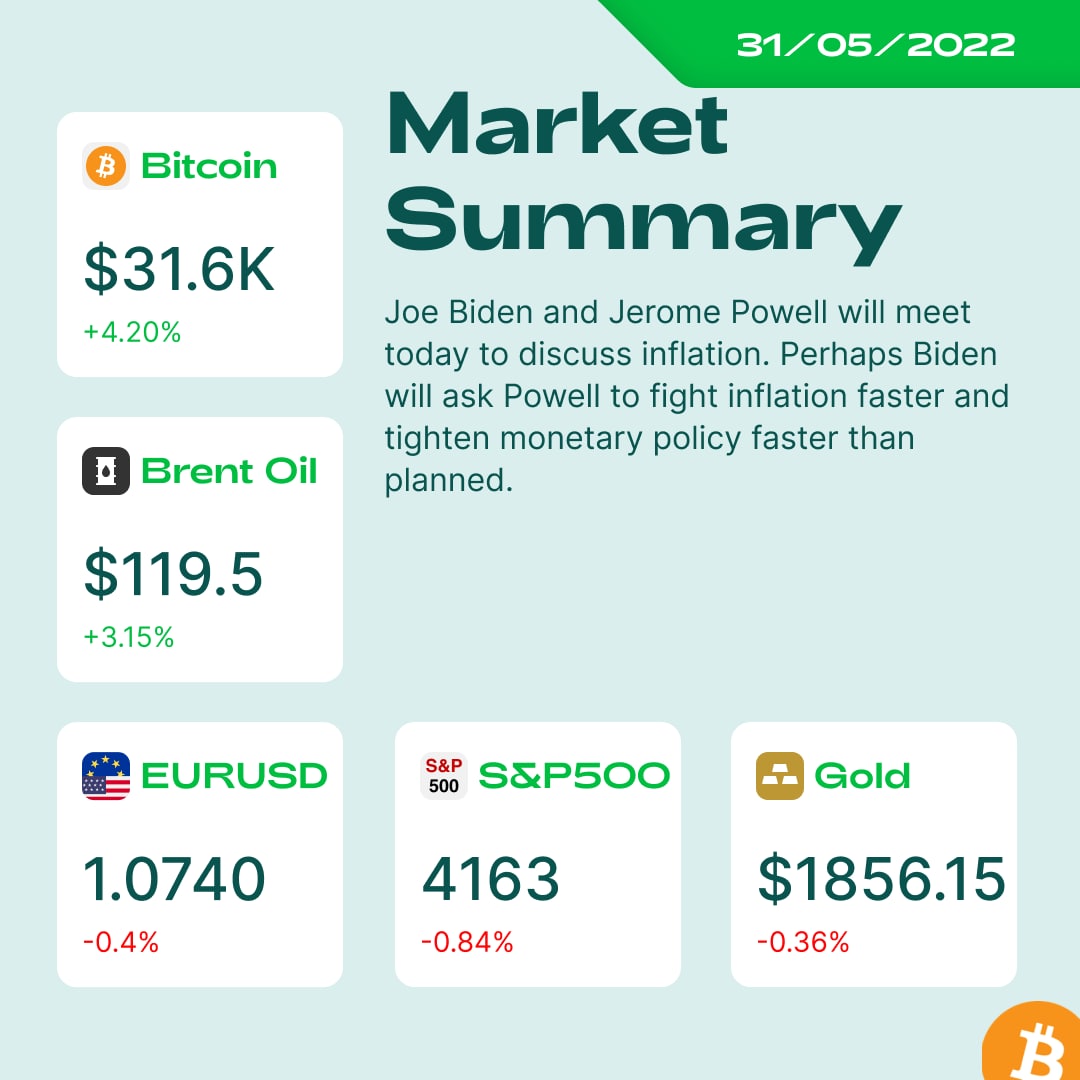
☀️ Morning, traders! Here’s what will move the market today:
🇨🇳 The decline in factory activity in China started to slow as Covid-19 curbs ease
🇯🇵 Weak industrial data for Japan, hawkish comments from the Fed’s Waller, and increased appetite for risk: are the reasons for USDJPY to rise and aim for the 129.00 resistance level
🇬🇧 The GBP/USD pair continued its bullish trend as it rose to the highest point since April 26th. The pair is trading at 1.2655, which is about 4.13% above the lowest level this month
💸 Bitcoin rose by 8% yesterday, promising that this will be the first green week in two months
🛢 The oil market rises in anticipation of the OPEC meeting that will come up tomorrow. XBRUSD may touch $120.00 today
🇫🇷 French inflation accelerated to another all-time high. Prices jumped 5.8% from a year ago in May
🕸 Venture capitalists have gone all-in on Web3, plowing more than $40 billion into crypto start-ups in the past 18 months
🥇 Gold is gaining power for another movement, oscillating between $1860 and $1840
💭Gold buy or sell? Share your views in the comments!
☀️ Morning, traders! Here’s what will move the market today:
🇨🇳 The decline in factory activity in China started to slow as Covid-19 curbs ease
🇯🇵 Weak industrial data for Japan, hawkish comments from the Fed’s Waller, and increased appetite for risk: are the reasons for USDJPY to rise and aim for the 129.00 resistance level
🇬🇧 The GBP/USD pair continued its bullish trend as it rose to the highest point since April 26th. The pair is trading at 1.2655, which is about 4.13% above the lowest level this month
💸 Bitcoin rose by 8% yesterday, promising that this will be the first green week in two months
🛢 The oil market rises in anticipation of the OPEC meeting that will come up tomorrow. XBRUSD may touch $120.00 today
🇫🇷 French inflation accelerated to another all-time high. Prices jumped 5.8% from a year ago in May
🕸 Venture capitalists have gone all-in on Web3, plowing more than $40 billion into crypto start-ups in the past 18 months
🥇 Gold is gaining power for another movement, oscillating between $1860 and $1840
💭Gold buy or sell? Share your views in the comments!
👍37❤16😁6🔥5
#Education
ABC of Сhart Patterns🎓
Now it’s time again for our weekly ABC section! Let’s talk about patterns today! ✨
Chart patterns are the combination of support and resistance lines that help determine whether the trend will reverse or continue. As a result, there are reversal and continuation patterns.
1) A reversal pattern is when a price pattern signals a change in trend direction. These patterns represent periods when bulls or bears have run out of steam. An established trend will pause and then head in a new direction as new energy emerges from the other side (bullish or bearish). For example, an uptrend supported by the bulls’ enthusiasm may pause, which means equal pressure from both bulls and bears, and then eventually give way to the bears. This leads to a downward trend change. Examples of common reversal patterns include Head and Shoulders, double tops, double bottom, wedges. Watch this video to learn about these patterns.
2) A continuation pattern occurs when a trend continues in its present direction after a short pause. The pattern can change during a pause in the current trend - the time when the bulls take a break in an uptrend or when the bears relax momentarily in a downtrend. Once a price pattern is formed, it’s impossible to tell if a trend is found or reversed. Therefore, it’s necessary to model the trend line used to build the price system, and whether the price breaks above or below the continuation zone. Technical analysts generally recommend assuming that a trend will continue until it’s confirmed that it has reversed. Common continuation patterns include Pennants, Flags, Sloping wedges. Watch this video to learn about continuation patterns.
Price patterns are often found when the price "takes a break", indicating areas of consolidation that could lead to a continuation or reversal of the prevailing trend. Trendlines are important in identifying these price patterns, appearing in formations such as flags, pennants, and double tops. Be attentive and double check everything!👍🏻
ABC of Сhart Patterns🎓
Now it’s time again for our weekly ABC section! Let’s talk about patterns today! ✨
Chart patterns are the combination of support and resistance lines that help determine whether the trend will reverse or continue. As a result, there are reversal and continuation patterns.
1) A reversal pattern is when a price pattern signals a change in trend direction. These patterns represent periods when bulls or bears have run out of steam. An established trend will pause and then head in a new direction as new energy emerges from the other side (bullish or bearish). For example, an uptrend supported by the bulls’ enthusiasm may pause, which means equal pressure from both bulls and bears, and then eventually give way to the bears. This leads to a downward trend change. Examples of common reversal patterns include Head and Shoulders, double tops, double bottom, wedges. Watch this video to learn about these patterns.
2) A continuation pattern occurs when a trend continues in its present direction after a short pause. The pattern can change during a pause in the current trend - the time when the bulls take a break in an uptrend or when the bears relax momentarily in a downtrend. Once a price pattern is formed, it’s impossible to tell if a trend is found or reversed. Therefore, it’s necessary to model the trend line used to build the price system, and whether the price breaks above or below the continuation zone. Technical analysts generally recommend assuming that a trend will continue until it’s confirmed that it has reversed. Common continuation patterns include Pennants, Flags, Sloping wedges. Watch this video to learn about continuation patterns.
Price patterns are often found when the price "takes a break", indicating areas of consolidation that could lead to a continuation or reversal of the prevailing trend. Trendlines are important in identifying these price patterns, appearing in formations such as flags, pennants, and double tops. Be attentive and double check everything!👍🏻
Forex Broker Online
Chart Patterns for Advanced Traders
Grab the tree patterns that will give you an edge in trading!
👍40🔥7❤1
🔥🔥🔥Our Weekly Telegram Stream will start in 5 minutes! Join Live and ask your questions! 🔥🔥🔥

👍31❤9👏5🥰4
🇺🇸#US100
🔥The US stock market is sliding ahead of the US trading session!
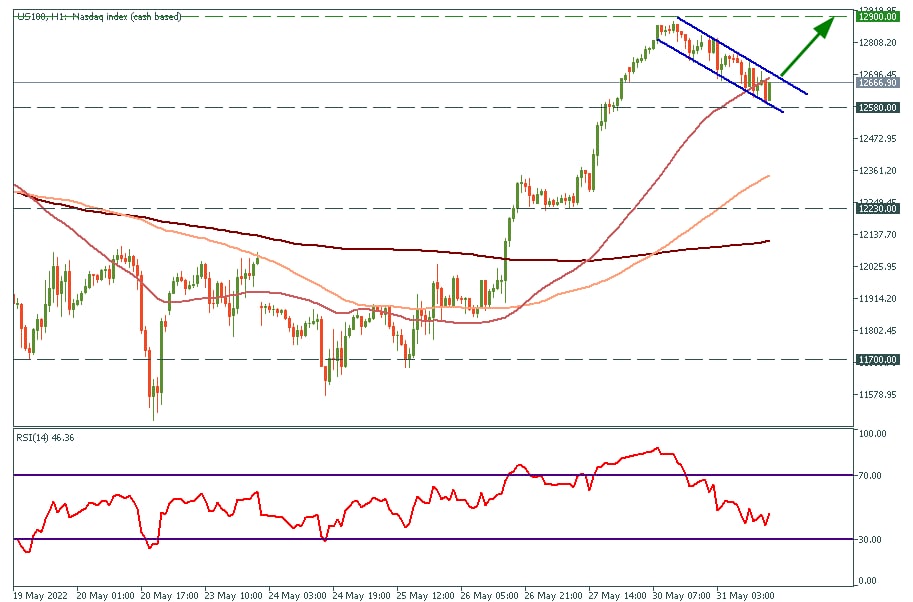
The price is moving in the descending channel. Currently, US100 is trading right above the support level of 12 580. Consider buying US100 after the breakout of the upper channel's border with the target at 12 900.
✅START TRADING✅
🔥The US stock market is sliding ahead of the US trading session!
The price is moving in the descending channel. Currently, US100 is trading right above the support level of 12 580. Consider buying US100 after the breakout of the upper channel's border with the target at 12 900.
✅START TRADING✅
👍18❤6👏1
FBS Analytics
🇺🇸#US100 🔥The US stock market is sliding ahead of the US trading session! The price is moving in the descending channel. Currently, US100 is trading right above the support level of 12 580. Consider buying US100 after the breakout of the upper channel's…
The price broke the support trendline. The trade idea has not been activated. ✅
👍30🔥7🎉3
🥈#XAGUSD
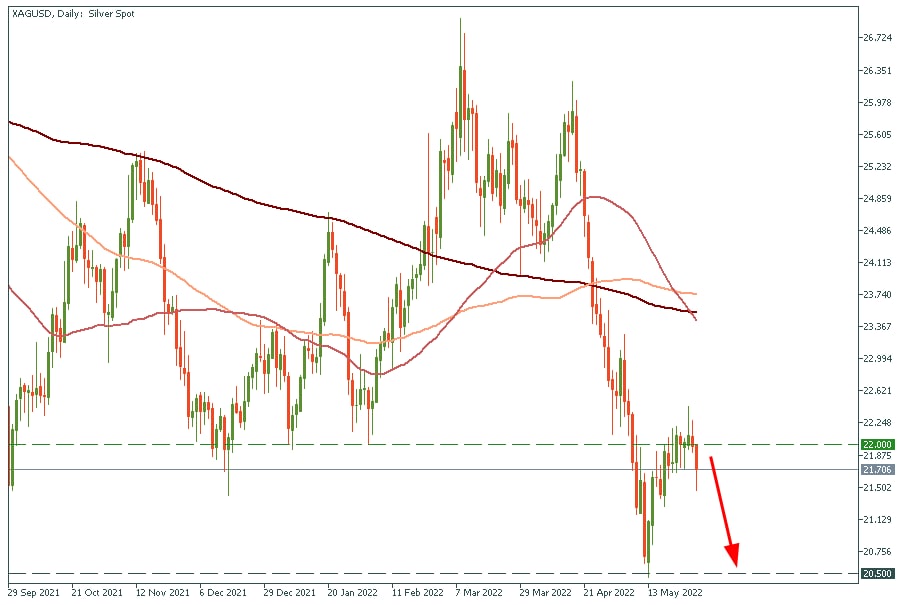
🔥Silver will go down!
The price retested the $22.00 resistance level from below after the breakout! We expect XAGUSD to plunge to $20.50 support level by the end of this week!
✅START TRADING✅
🔥Silver will go down!
The price retested the $22.00 resistance level from below after the breakout! We expect XAGUSD to plunge to $20.50 support level by the end of this week!
✅START TRADING✅
👍31🔥19🎉5👏4👎1
FBS Analytics
⛽️ #XNGUSD 💵 🔥US natural gas touched the major Fibonacci resistance twice. Moreover, the chart printed a double divergence on the RSI. We expect XBGUSD to plunge hard, so consider opening a sell trade with three targets ✅8.20 ✅7.10 ✅6.50 🟥 Stop Loss is…
✅ First target hit 🔥
Move your stop loss to breakeven and enjoy a risk-free trade
Move your stop loss to breakeven and enjoy a risk-free trade
👍24🔥4👎2👏1
🥇#GOLD #XAUUSD
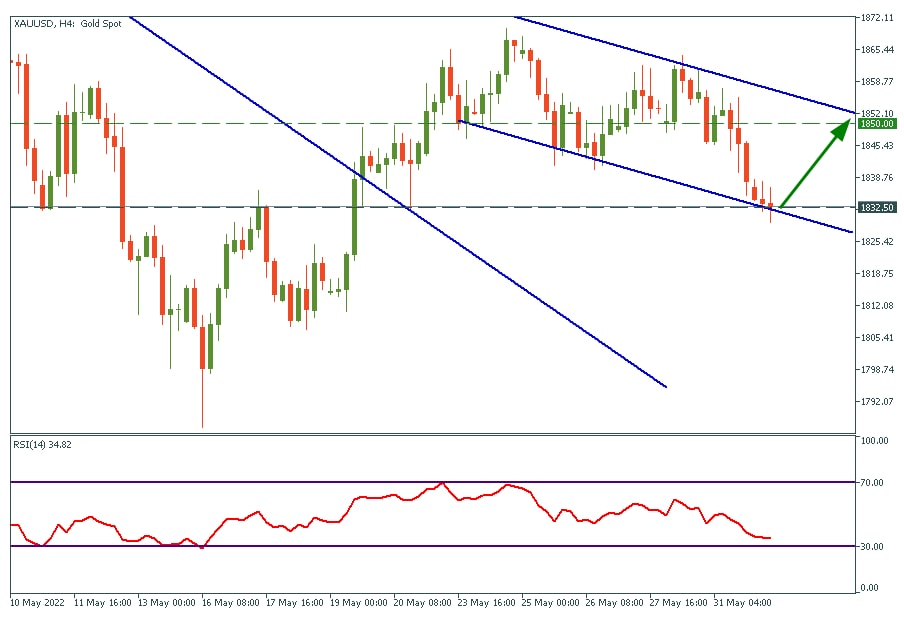
🔥The pump is coming for XAUUSD!
The price declined to 1832.50 and at the moment it is retesting the cross point of the support level and the lower border of the descending channel. It is a pretty significant level, that's why we expect to see a pump really soon!
Target is $1850!
🧐Are you in?
✅START TRADING✅
🔥The pump is coming for XAUUSD!
The price declined to 1832.50 and at the moment it is retesting the cross point of the support level and the lower border of the descending channel. It is a pretty significant level, that's why we expect to see a pump really soon!
Target is $1850!
🧐Are you in?
✅START TRADING✅
👍61🔥23👏7
FBS Analytics
🥇#GOLD #XAUUSD 🔥The pump is coming for XAUUSD! The price declined to 1832.50 and at the moment it is retesting the cross point of the support level and the lower border of the descending channel. It is a pretty significant level, that's why we expect to…
❗️If the price breaks through the lower border of the channel and plunges below $1830, it will go down to $1810 and $1800. Be accurate! ❗️
👍28🔥14🥰7😱7
🔥Bank of Canada can surprise us!
Canada is about to announce its Interest rate update! CAD performs significantly better than other commodity-pegged currencies this year, despite the unfavorable market sentiment. However, inflation hasn’t bypassed this country.
The previous result was on April 13 with 1.00%, now 1.50% is expected! Be ready to trade CAD pairs on its release today, June 1 at 17:00 GMT+3.
✅START TRADING✅
Canada is about to announce its Interest rate update! CAD performs significantly better than other commodity-pegged currencies this year, despite the unfavorable market sentiment. However, inflation hasn’t bypassed this country.
The previous result was on April 13 with 1.00%, now 1.50% is expected! Be ready to trade CAD pairs on its release today, June 1 at 17:00 GMT+3.
✅START TRADING✅

👍23❤6🥰4👏2
#MarketNews
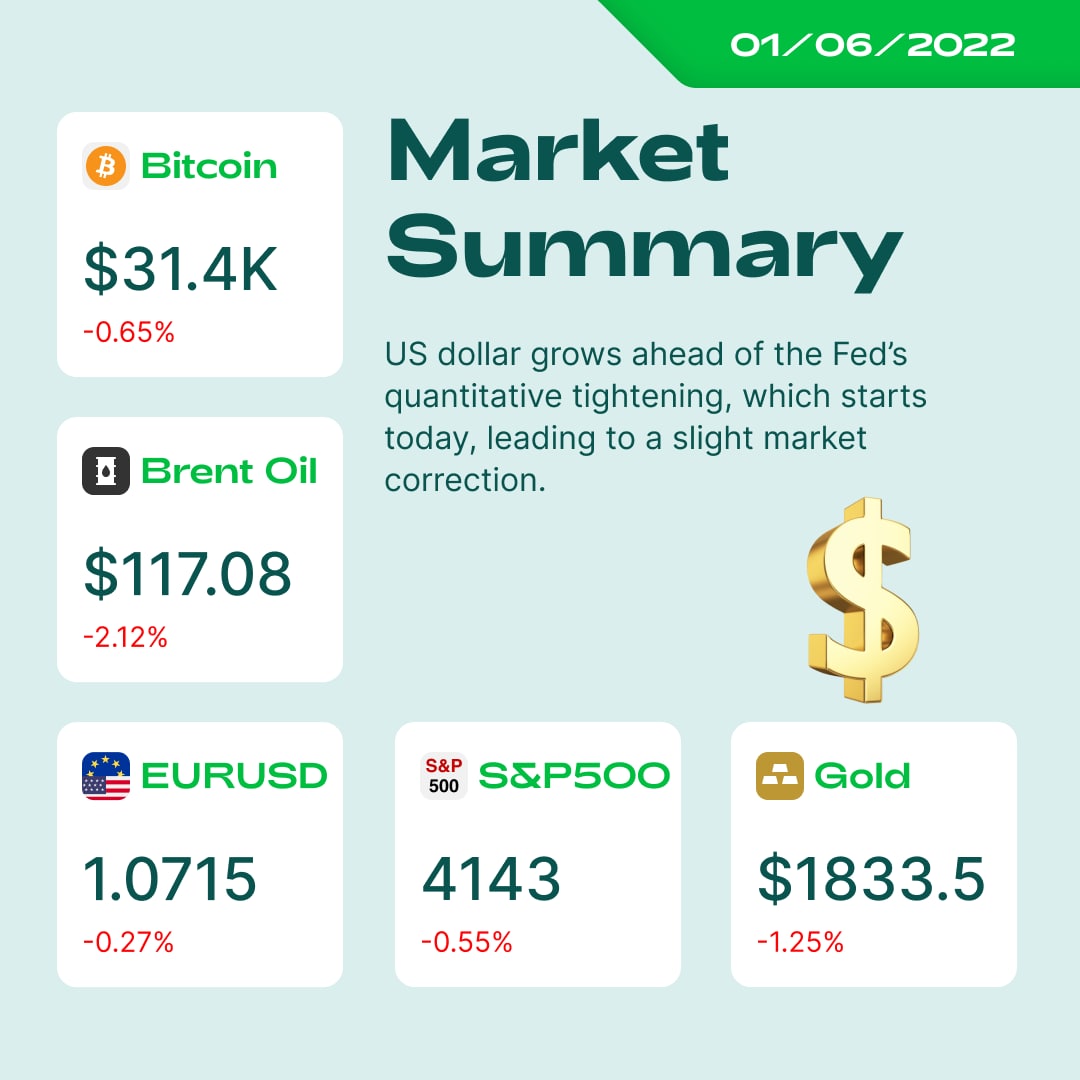
🤩Happy first day of summer! Are you ready for fresh great trades? Check the news beforehand to stay updated!
🤔US Treasury Secretary Janet Yellen admitted Tuesday that she had failed to anticipate how long high inflation would continue to plague American consumers as the Biden administration works to contain a mounting political liability.
🙌The US dollar awaits the release of ISM Manufacturing PMI at 17:00 GMT+3. According to the forecasts, the indicator will fall to 54.4. If the actual level is higher, EURUSD will return back to the 200-period SMA on H4. Otherwise, expect a breakout of the descending trend line and a rise to 1.0900.
🗣In the middle of the American trading session we expect even more volatility for the American dollar and gold, as two Fed representatives, Williams and Bullard, will speak at 18:30 GMT+3 and 20:00 GMT+3, respectively.
💣According to experts, an embargo on Russian oil supplies will not result in an immediate surge of oil prices, as the banning process will be extended for a half of the year. The supplies have already been limited, so the process will be smooth.
📉The Federal Reserve has started to shrink its balance sheet this week. At the same time, CryptoWhale noted that BTC was never seen in a bullish cycle when the Fed tightened its policy.
🔥The Canadian dollar awaits the BOC Rate Statement today at 17:00 GMT+3. Traders widely expect the bank to raise its interest rate from 1% to 1.5%. If it happens, USDCAD will plunge to 1.2500.
Key events:
ISM Manufacturing PMI – 17:00 GMT+3
JOLTS Job Openings – 17:00 GMT+3
BOC Rate Statement – 17:00 GMT+3
FOMC Member Williams Speaks – 18:30 GMT+3
FOMC Member Bullard Speaks – 20:00 GMT+3
Let’s exchange our thoughts on the markets today in the comments!
🤩Happy first day of summer! Are you ready for fresh great trades? Check the news beforehand to stay updated!
🤔US Treasury Secretary Janet Yellen admitted Tuesday that she had failed to anticipate how long high inflation would continue to plague American consumers as the Biden administration works to contain a mounting political liability.
🙌The US dollar awaits the release of ISM Manufacturing PMI at 17:00 GMT+3. According to the forecasts, the indicator will fall to 54.4. If the actual level is higher, EURUSD will return back to the 200-period SMA on H4. Otherwise, expect a breakout of the descending trend line and a rise to 1.0900.
🗣In the middle of the American trading session we expect even more volatility for the American dollar and gold, as two Fed representatives, Williams and Bullard, will speak at 18:30 GMT+3 and 20:00 GMT+3, respectively.
💣According to experts, an embargo on Russian oil supplies will not result in an immediate surge of oil prices, as the banning process will be extended for a half of the year. The supplies have already been limited, so the process will be smooth.
📉The Federal Reserve has started to shrink its balance sheet this week. At the same time, CryptoWhale noted that BTC was never seen in a bullish cycle when the Fed tightened its policy.
🔥The Canadian dollar awaits the BOC Rate Statement today at 17:00 GMT+3. Traders widely expect the bank to raise its interest rate from 1% to 1.5%. If it happens, USDCAD will plunge to 1.2500.
Key events:
ISM Manufacturing PMI – 17:00 GMT+3
JOLTS Job Openings – 17:00 GMT+3
BOC Rate Statement – 17:00 GMT+3
FOMC Member Williams Speaks – 18:30 GMT+3
FOMC Member Bullard Speaks – 20:00 GMT+3
Let’s exchange our thoughts on the markets today in the comments!
👍31❤8🔥4👏3
🛢#XTIUSD
XTIUSD broke above $113.50 and retested it from above on the daily timeframe! The price is heading towards $122.00!
✅START TRADING✅
XTIUSD broke above $113.50 and retested it from above on the daily timeframe! The price is heading towards $122.00!
✅START TRADING✅

👍22
🇺🇸💶#EURUSD #USD
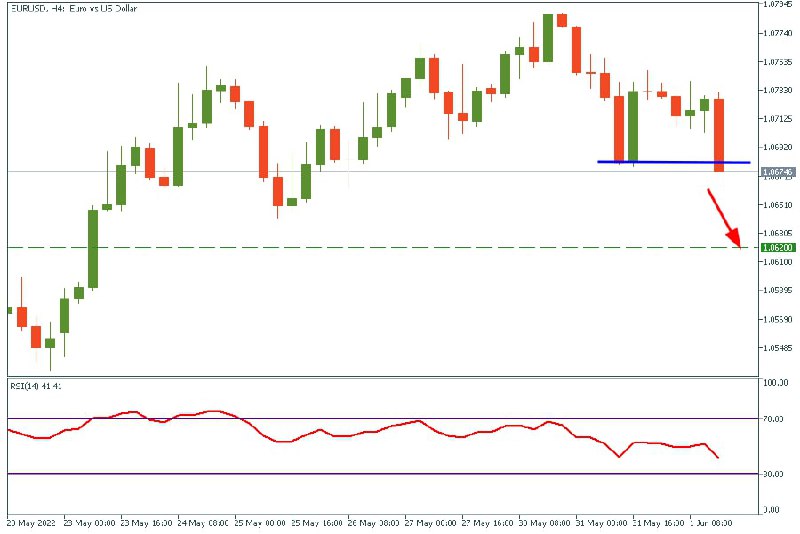
🔥US dollar index reverses!
At the same time, EURUSD breaks below the latest low! The pair is heading towards 1.0620!
Consider opening a SELL trade after the breakout confirmation!
✅START TRADING✅
🔥US dollar index reverses!
At the same time, EURUSD breaks below the latest low! The pair is heading towards 1.0620!
Consider opening a SELL trade after the breakout confirmation!
✅START TRADING✅
🔥22👍15❤5👏3
FBS Analytics
🥇#GOLD #XAUUSD 🔥The pump is coming for XAUUSD! The price declined to 1832.50 and at the moment it is retesting the cross point of the support level and the lower border of the descending channel. It is a pretty significant level, that's why we expect to…
✅Target is reached. Now we go down to $1830. If breakout happens, the target will be $1810.
🔥28👍6❤5🥰4👏4