
🤔Volume Indicators In Trading For Beginners
🔊What Does Volume Mean in the Market?
In trading, the term "volume" represents the amount of money that has been spent for buying or selling a particular asset over a specific period. Traders rely on it as a key metric because it lets them know what an asset's liquidity level is.
Volume analysis is a technique used to determine the trades you will make by discovering the relationships between volume and prices.
🐂Bullish signals from trading volume!
👆Upside breakout with above-average volume
At some point, a price meets a resistance level during uptrends and in sideways markets. The trend stops and starts to fizzle as selling pressure overcomes buying pressure. When a price breaks through that level, the breakout will be more significant if the volume is high or above average. A breakout accompanied by low volume suggests enthusiasm for the move may be lacking.
🐻Bearish signals from trading volume!
👇Downside breakout accompanied by heavy volume
At some point, a price meets a support level during downtrends and in sideways markets. The trend stops and starts to fizzle as buying pressure overcomes selling pressure. When a price breaks through that level, the breakout will be more significant if the volume is high or above average. A breakout accompanied by low volume suggests low enthusiasm for the move.
🔥Volume indicators can provide even more signals!
🔥Would you like to learn them all? Read the article: https://bit.ly/3H0Uura
🔊What Does Volume Mean in the Market?
In trading, the term "volume" represents the amount of money that has been spent for buying or selling a particular asset over a specific period. Traders rely on it as a key metric because it lets them know what an asset's liquidity level is.
Volume analysis is a technique used to determine the trades you will make by discovering the relationships between volume and prices.
🐂Bullish signals from trading volume!
👆Upside breakout with above-average volume
At some point, a price meets a resistance level during uptrends and in sideways markets. The trend stops and starts to fizzle as selling pressure overcomes buying pressure. When a price breaks through that level, the breakout will be more significant if the volume is high or above average. A breakout accompanied by low volume suggests enthusiasm for the move may be lacking.
🐻Bearish signals from trading volume!
👇Downside breakout accompanied by heavy volume
At some point, a price meets a support level during downtrends and in sideways markets. The trend stops and starts to fizzle as buying pressure overcomes selling pressure. When a price breaks through that level, the breakout will be more significant if the volume is high or above average. A breakout accompanied by low volume suggests low enthusiasm for the move.
🔥Volume indicators can provide even more signals!
🔥Would you like to learn them all? Read the article: https://bit.ly/3H0Uura
👍32🔥6❤4👏4
🔥Today is the first day of Amazon stock trading after the 1:20 split!
The US trading session starts at 16:30 GMT+3!
High volatility is expected! Do not miss it!
✅START TRADING✅
The US trading session starts at 16:30 GMT+3!
High volatility is expected! Do not miss it!
✅START TRADING✅

👍11❤9🔥3💩1
🇨🇦 Recently, the Bank of Canada hiked the interest rates by 50 basis points. It is now 1.5%, and it’s only the beginning
We prepared two trade ideas for the Canadian dollar. Read the article and use them in your favor! 💚
⬇️
https://bit.ly/3aEyYwd
⬆️
We prepared two trade ideas for the Canadian dollar. Read the article and use them in your favor! 💚
⬇️
https://bit.ly/3aEyYwd
⬆️
FBS
Canadian dollar outlook and forecast
Recently, the Bank of Canada hiked the interest rates by 50 basis points. It is now 1.5%, and it’s only the beginning.
❤16👍6🔥5🥰4😁3❤🔥1👏1
🇺🇸🇯🇵#USDJPY
🔥The Japanese Yen keeps weakening!
The head of the Japanese central bank stated that the aggressive monetary easing will be continued.
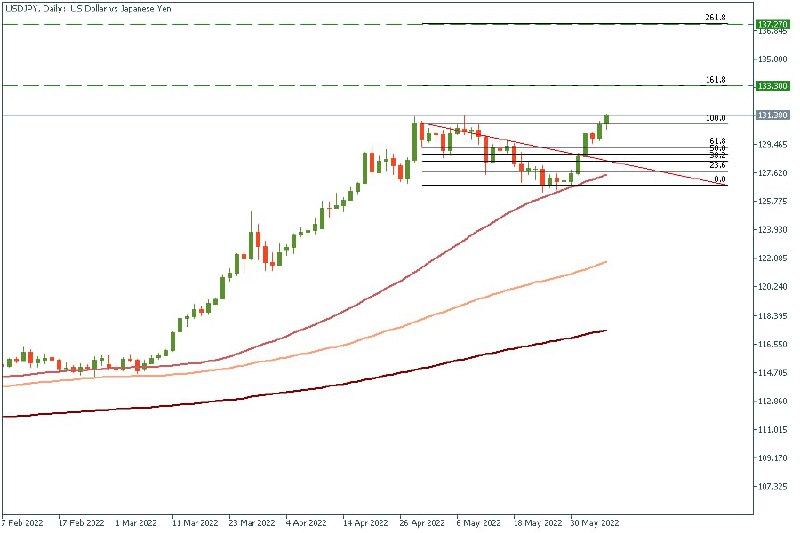
USDJPY broke the recent high! According to the Fibonacci retracement, the price is heading towards 133.30 and 137.27.
✅START TRADING✅
🔥The Japanese Yen keeps weakening!
The head of the Japanese central bank stated that the aggressive monetary easing will be continued.
USDJPY broke the recent high! According to the Fibonacci retracement, the price is heading towards 133.30 and 137.27.
✅START TRADING✅
🔥14👍11🎉3❤2👎2🥰2
🤔Will Australian Cash Rate surprise tomorrow?
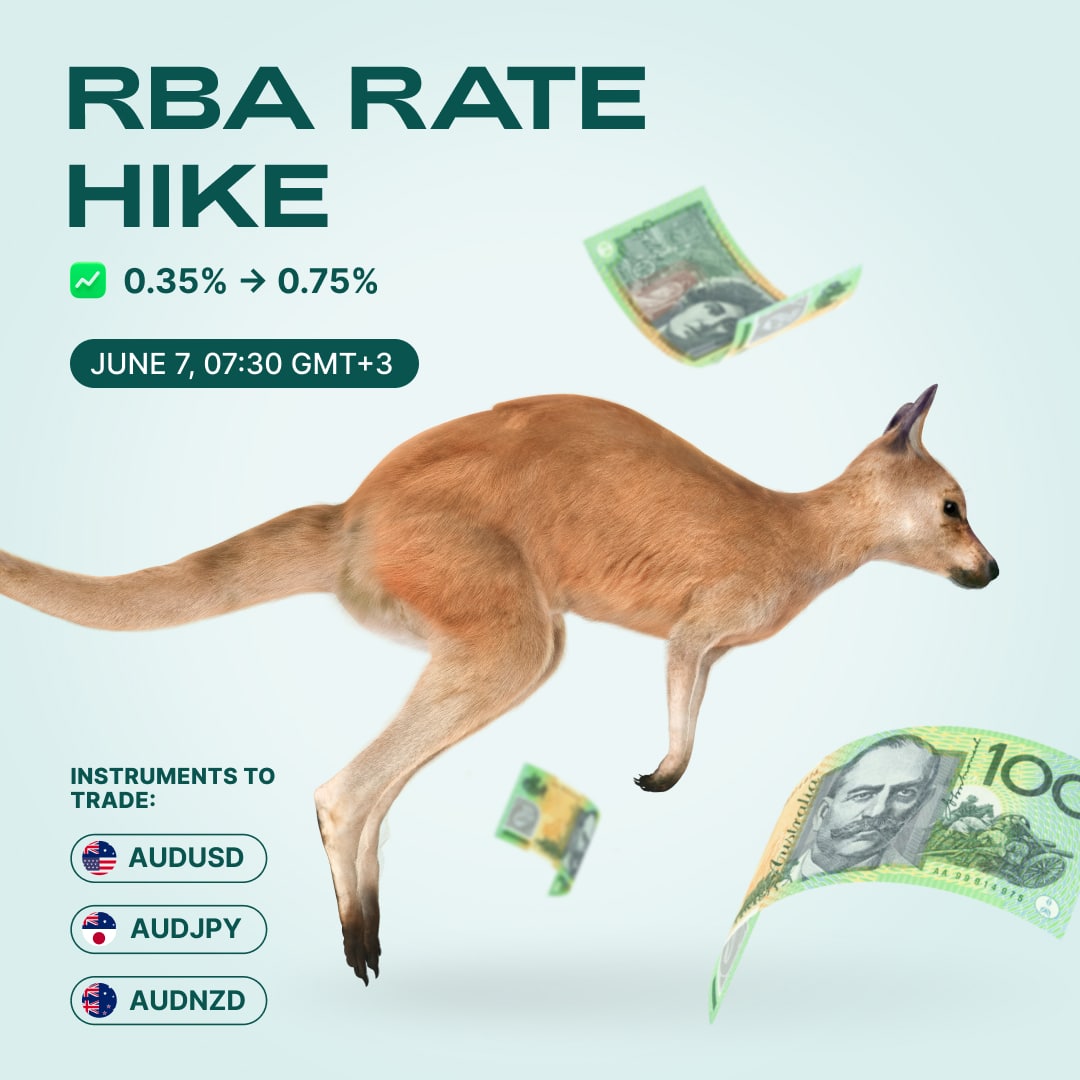
🔥The Reserve Bank of Australia will announce its cash rate and make a statement about future rate policy on Tuesday, June 7, at 07:30 MT. The major event for AUD!
Last time, the RBA said it would raise interest rates by 25 basis points to 0.35%, the first time since November 2010! Due to RBA sentiment, another raise from 40 basis points to 0.75% seems very likely at this board meeting!
If the actual reading is bigger than forecasted, it’s good for the currency. Therefore, a surprise rate hike will propel AUDUSD. Moreover, the AUD will get higher if the RBA is optimistic about the national economy.
❗️Be ready to trade AUDUSD, AUDCHF, AUDNZD and AUDJPY!❗️
🔥The Reserve Bank of Australia will announce its cash rate and make a statement about future rate policy on Tuesday, June 7, at 07:30 MT. The major event for AUD!
Last time, the RBA said it would raise interest rates by 25 basis points to 0.35%, the first time since November 2010! Due to RBA sentiment, another raise from 40 basis points to 0.75% seems very likely at this board meeting!
If the actual reading is bigger than forecasted, it’s good for the currency. Therefore, a surprise rate hike will propel AUDUSD. Moreover, the AUD will get higher if the RBA is optimistic about the national economy.
❗️Be ready to trade AUDUSD, AUDCHF, AUDNZD and AUDJPY!❗️
👍34❤14👏4😁3
#MarketNews
Rise and shine! Another great trading day is here!
⬆ Australia’s central bank surprised investors by raising interest rates more than expected: from 0.35% to 0.85%. The RBA justified its actions by the high inflation. The move will be a test for Australian consumers who are already struggling with rising living costs and tepid wage growth. Actually, consumer confidence in Australia dropped 4.1% last week to its lowest level since mid-August 2020. AUDUSD initially rose to 0.7246 but then slipped to 0.7180.
🇪🇺 The European Central Bank’s meeting is next! It will take place on Thursday, June 9. The ECB is set to announce an end to bond purchases and formally begin the countdown to an increase in interest rates in July. EURUSD may drift lower ahead of the decision. The pair slid below 1.0700, so focus on the 1.0640/00 area.
📈 USDJPY rose close to 133 on a widening interest-rate gap between the US and Japan. Five- and 10-year US Treasury yields went over 3% for the first time since mid-May. The 10-year Treasury yield jumped more than 10 basis points. Higher yields in America make investors prefer the USD.
🤔 BTCUSD is back below 30,000: risk assets are once again out of favour. Gold is also losing to the USD: XAUUSD closed below 1850 yesterday, so keep an eye on the support at 1835. Brent oil (XBRUSD) got below 120. There’s some speculation that the US may relax sanctions on Iran and Venezuela, although so far these are just rumours.
🍏 Apple announced a host of new features coming to the iPhone, iPad, Apple Watch, and Mac during its annual Worldwide Developers Conference (WWDC) on Monday. The stock traded at $146. In the meantime, Amazon costs only $125 after the split and may attract new buyers.
What are your trade ideas for today? Share in the comments! 💬
Rise and shine! Another great trading day is here!
⬆ Australia’s central bank surprised investors by raising interest rates more than expected: from 0.35% to 0.85%. The RBA justified its actions by the high inflation. The move will be a test for Australian consumers who are already struggling with rising living costs and tepid wage growth. Actually, consumer confidence in Australia dropped 4.1% last week to its lowest level since mid-August 2020. AUDUSD initially rose to 0.7246 but then slipped to 0.7180.
🇪🇺 The European Central Bank’s meeting is next! It will take place on Thursday, June 9. The ECB is set to announce an end to bond purchases and formally begin the countdown to an increase in interest rates in July. EURUSD may drift lower ahead of the decision. The pair slid below 1.0700, so focus on the 1.0640/00 area.
📈 USDJPY rose close to 133 on a widening interest-rate gap between the US and Japan. Five- and 10-year US Treasury yields went over 3% for the first time since mid-May. The 10-year Treasury yield jumped more than 10 basis points. Higher yields in America make investors prefer the USD.
🤔 BTCUSD is back below 30,000: risk assets are once again out of favour. Gold is also losing to the USD: XAUUSD closed below 1850 yesterday, so keep an eye on the support at 1835. Brent oil (XBRUSD) got below 120. There’s some speculation that the US may relax sanctions on Iran and Venezuela, although so far these are just rumours.
🍏 Apple announced a host of new features coming to the iPhone, iPad, Apple Watch, and Mac during its annual Worldwide Developers Conference (WWDC) on Monday. The stock traded at $146. In the meantime, Amazon costs only $125 after the split and may attract new buyers.
What are your trade ideas for today? Share in the comments! 💬

👍21🥰6🔥2
🇦🇺🇯🇵#AUDJPY #KeyRate
🔥Buy The Rumors - Sell The News!🔥
🏦Today, the Australian Central Bank increased the key rate by 50 basis points versus the 25 expected. As the result, the Australian dollar skyrocketed versus the bucket of currencies.
🤌For example, it gained almost 1% versus the Japanese Yen. However, the correction happened two hours after the announcement and it looks like the market has been pricing such a result.
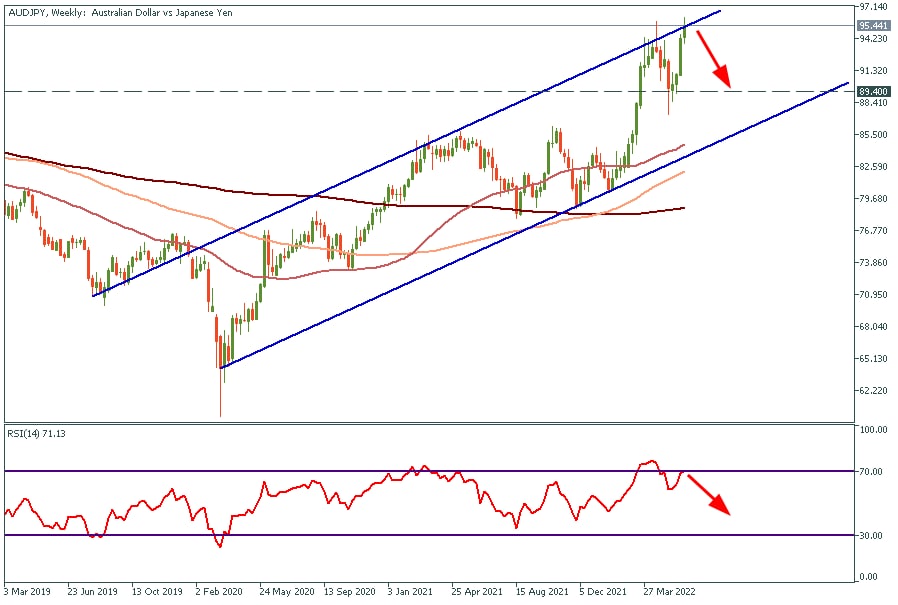
Let's look at the AUDJPY currency pair on the weekly timeframe. The price has reached the upper border of the ascending channel and bounced back. The RSI oscillator reached the overbought zone.
✅We expect to see a correction in the middle term to the 89.40 support level.
✅START TRADING✅
🔥Buy The Rumors - Sell The News!🔥
🏦Today, the Australian Central Bank increased the key rate by 50 basis points versus the 25 expected. As the result, the Australian dollar skyrocketed versus the bucket of currencies.
🤌For example, it gained almost 1% versus the Japanese Yen. However, the correction happened two hours after the announcement and it looks like the market has been pricing such a result.
Let's look at the AUDJPY currency pair on the weekly timeframe. The price has reached the upper border of the ascending channel and bounced back. The RSI oscillator reached the overbought zone.
✅We expect to see a correction in the middle term to the 89.40 support level.
✅START TRADING✅
👍35🔥8👎3
#Education🎓
Hello, dear traders!
In today’s education section, we’ll talk about divergence! 🎓
Divergence generally refers to a discrepancy in the direction between the price and the indicator. Normally, an oscillator like RSI is measured against the chart. There are two types of divergence: a regular and a hidden one. Each may be either bullish or bearish.
Regular bullish divergence occurs in a downtrend; the price forms a lower low, and the indicator forms a higher low. If you draw a line through each pair of lows for the price and the indicator, the two lines will appear to be pinched together towards the end. This may be a signal of a market reversal in the upward direction.
Regular bearish divergence occurs in an uptrend; the price forms a higher high, and the indicator forms a lower high. The two lines fall apart towards the end. This may be a signal of a downward market reversal.
Hidden bullish divergence occurs in an uptrend; the price forms a higher low, and the indicator forms a lower low. The two lines fall apart towards the end. This would signal the market’s intention to rise later on.
Hidden bearish divergence occurs in a downtrend; the price forms a lower high, and the indicator forms a higher high. The two lines get pinched together towards the end. This would mean that the market is preparing to drop further.
Divergences are normally used for forecasting price corrections and reversals. They are likely to occur before the actual price action. That makes them so effective and allows traders to enter a trade right at the very beginning of the new emerging price move. Click here to see the visual example.
❓How often do you notice divergence during your trading? Do you try to benefit from it? Share your experience below! ⬇️
Hello, dear traders!
In today’s education section, we’ll talk about divergence! 🎓
Divergence generally refers to a discrepancy in the direction between the price and the indicator. Normally, an oscillator like RSI is measured against the chart. There are two types of divergence: a regular and a hidden one. Each may be either bullish or bearish.
Regular bullish divergence occurs in a downtrend; the price forms a lower low, and the indicator forms a higher low. If you draw a line through each pair of lows for the price and the indicator, the two lines will appear to be pinched together towards the end. This may be a signal of a market reversal in the upward direction.
Regular bearish divergence occurs in an uptrend; the price forms a higher high, and the indicator forms a lower high. The two lines fall apart towards the end. This may be a signal of a downward market reversal.
Hidden bullish divergence occurs in an uptrend; the price forms a higher low, and the indicator forms a lower low. The two lines fall apart towards the end. This would signal the market’s intention to rise later on.
Hidden bearish divergence occurs in a downtrend; the price forms a lower high, and the indicator forms a higher high. The two lines get pinched together towards the end. This would mean that the market is preparing to drop further.
Divergences are normally used for forecasting price corrections and reversals. They are likely to occur before the actual price action. That makes them so effective and allows traders to enter a trade right at the very beginning of the new emerging price move. Click here to see the visual example.
❓How often do you notice divergence during your trading? Do you try to benefit from it? Share your experience below! ⬇️

👍21❤16😁2
🛢#XBRUSD
Brent oil broke through the significant resistance on the daily timeframe. On the 30 minutes timeframe, the price is testing the breakout trading in the bullish flag pattern.
✅Consider opening a BUY trade after the breakout of the bullish flag. It looks like big news is coming for the oil market this week.
✅START TRADING✅
Brent oil broke through the significant resistance on the daily timeframe. On the 30 minutes timeframe, the price is testing the breakout trading in the bullish flag pattern.
✅Consider opening a BUY trade after the breakout of the bullish flag. It looks like big news is coming for the oil market this week.
✅START TRADING✅
🔥29👍18❤8
#MarketNews
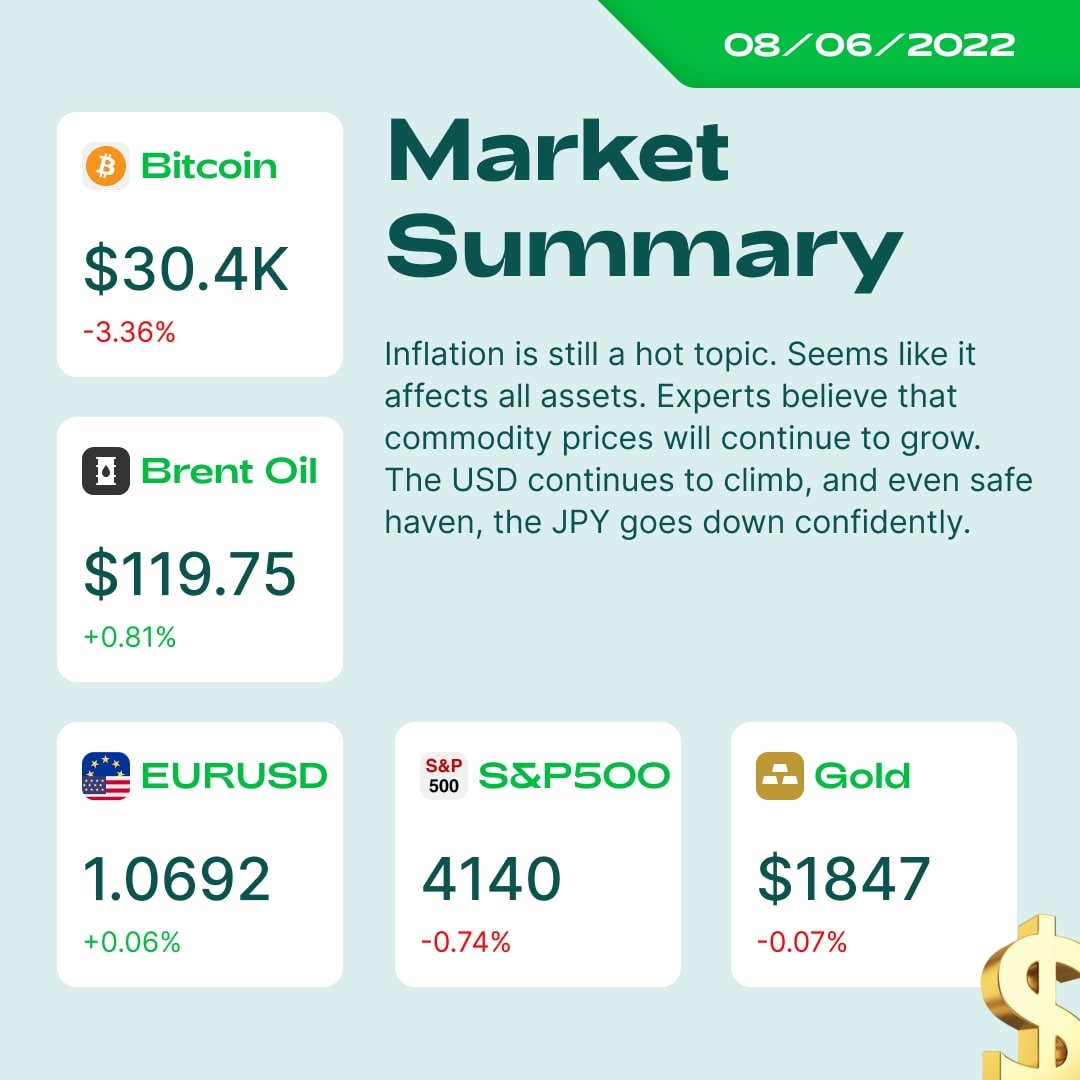
Good morning, dear traders! Are you ready for this Wednesday? Let’s see what’s new:
☢️Cryptocurrencies have lagged, with Bitcoin losing about 2.5% and falling to around $30,500.
🛢Persistently high crude oil prices could lead to a recession in the economy, DataTrek researchers warned in a new note on Tuesday. They continue to believe that $140 per barrel is the level to watch as an indicator of a recession.
😱The World Bank again cut its global growth forecast for 2022, warning several years of above-average inflation and below-average growth.
🇺🇸US stocks closed higher on Tuesday, gaining momentum in the afternoon and shaking off early weakness after earnings warning from retail giant Target Corp. heightened concerns about the retail sector. All three major stock indices posted solid gains as 10-year Treasury yields hovered around 3%.
🇮🇳India's central bank raised its key interest rate for the second month in a row to rein in prices that have been above their target range since the beginning of this year.
💉The FDA Vaccine Advisory Committee voted in favor of the Novavax COVID-19 vaccine for adults’ use, paving the way for the company to approve its first product in the US. NVAX is now $48.18.
🎉Happy trading day! 🎉
Good morning, dear traders! Are you ready for this Wednesday? Let’s see what’s new:
☢️Cryptocurrencies have lagged, with Bitcoin losing about 2.5% and falling to around $30,500.
🛢Persistently high crude oil prices could lead to a recession in the economy, DataTrek researchers warned in a new note on Tuesday. They continue to believe that $140 per barrel is the level to watch as an indicator of a recession.
😱The World Bank again cut its global growth forecast for 2022, warning several years of above-average inflation and below-average growth.
🇺🇸US stocks closed higher on Tuesday, gaining momentum in the afternoon and shaking off early weakness after earnings warning from retail giant Target Corp. heightened concerns about the retail sector. All three major stock indices posted solid gains as 10-year Treasury yields hovered around 3%.
🇮🇳India's central bank raised its key interest rate for the second month in a row to rein in prices that have been above their target range since the beginning of this year.
💉The FDA Vaccine Advisory Committee voted in favor of the Novavax COVID-19 vaccine for adults’ use, paving the way for the company to approve its first product in the US. NVAX is now $48.18.
🎉Happy trading day! 🎉
👍30🔥6❤4👏1
👍14🔥5❤1🤩1
🇺🇸🇯🇵#USDJPY
😈Is USDJPY unstoppable?
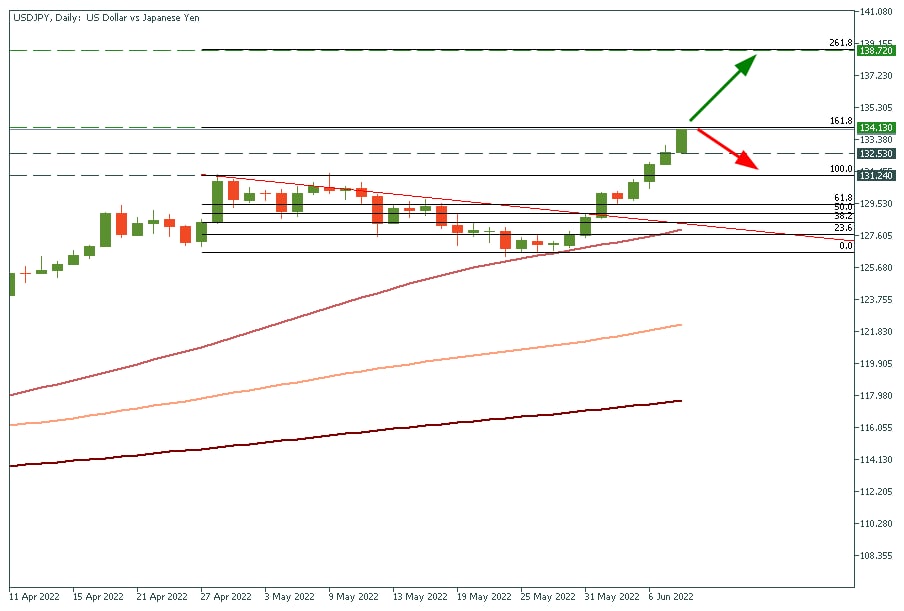
The currency pair gained 2.4% in the last three days, and we believe the correction might happen soon. If you still hold the long position, consider closing it at around 134.13, the 161.8 Fibonacci level.
However, if the price breaks through this resistance and successfully retests it from the above, the trend might continue. In this case, USDJPY will head towards the next target at 138.72!
✅START TRADING✅
😈Is USDJPY unstoppable?
The currency pair gained 2.4% in the last three days, and we believe the correction might happen soon. If you still hold the long position, consider closing it at around 134.13, the 161.8 Fibonacci level.
However, if the price breaks through this resistance and successfully retests it from the above, the trend might continue. In this case, USDJPY will head towards the next target at 138.72!
✅START TRADING✅
👍46🔥15❤6👎4😁2
🇪🇺🇺🇸#EURUSD
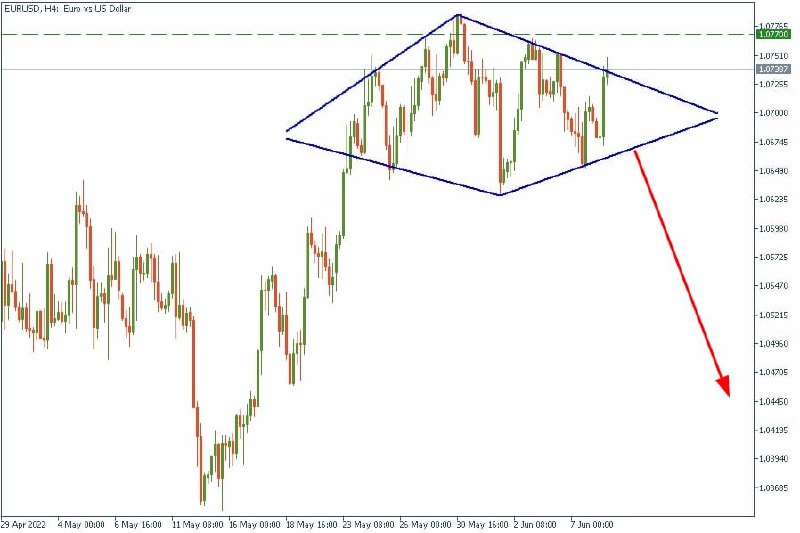
💎How often do you find a diamond pattern?
It seems like the EURUSD currency pair has formed this reversal formation. If the price breaks through the lower border it might plunge to 1.0570 and even 1.0480!
✅START TRADING✅
💎How often do you find a diamond pattern?
It seems like the EURUSD currency pair has formed this reversal formation. If the price breaks through the lower border it might plunge to 1.0570 and even 1.0480!
✅START TRADING✅
👍54🔥22😁8🤔5🎉5
#Events
🇪🇺🔥The EUR pairs are about to shake!
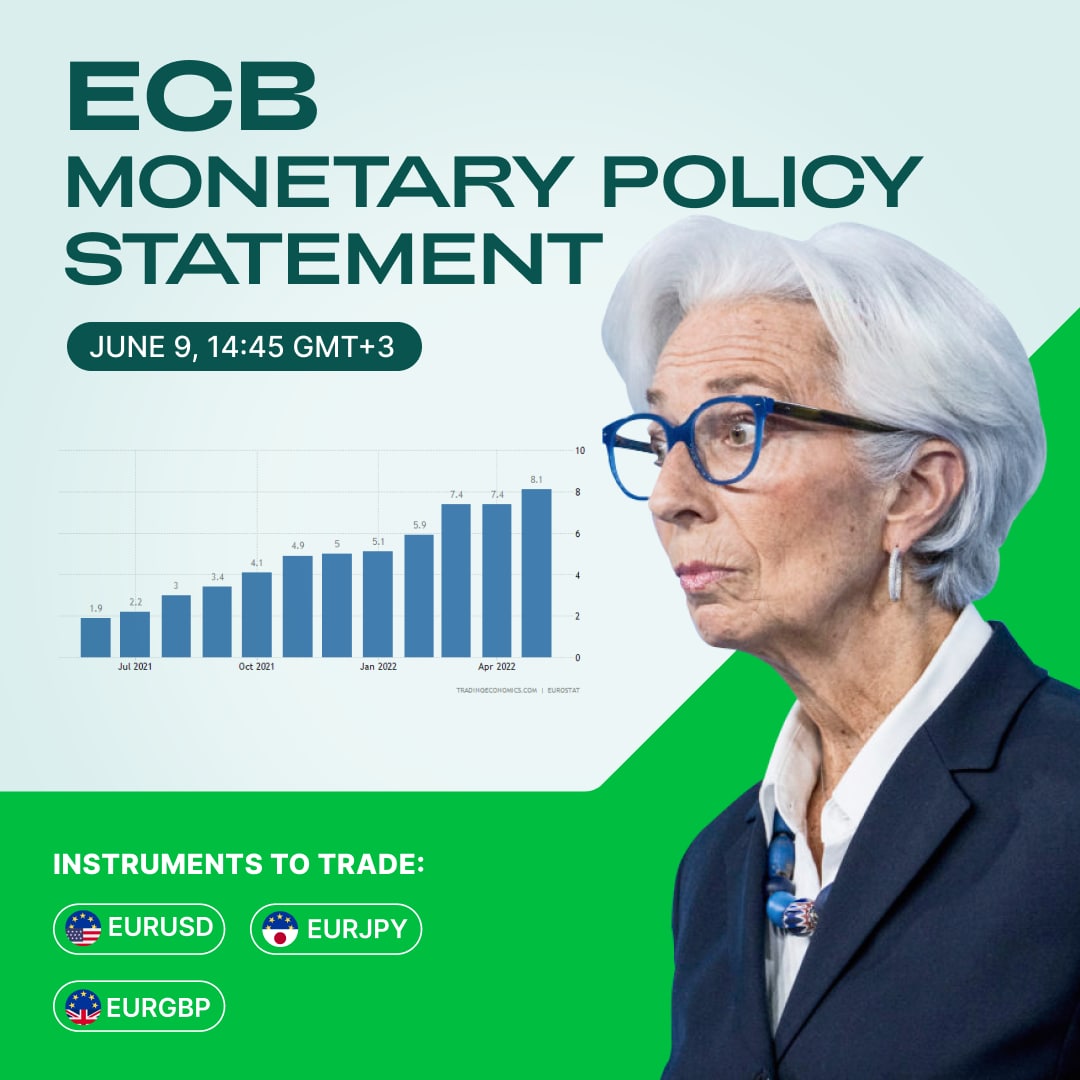
The ECB will announce the main refinancing rate and make a monetary policy statement at the ECB press conference on Thursday, June 9, at 14:45 MT. The central bank will share the current interest rate details and give the overall economic outlook and inflation forecasts.
At the last meeting, Christine Lagarde claimed that the ECB can’t guarantee growth in the eurozone due to geopolitical situation. Thus, it isn’t clear if the faster risk hikes are coming.
The previous meeting brought volatility to the EUR. This time, if the ECB statement is more hawkish than forecasted, EURUSD will likely rise. In a more dovish situation, EURUSD will likely fall.
😎Be ready to trade the EUR pairs!
✅START TRADING✅
🇪🇺🔥The EUR pairs are about to shake!
The ECB will announce the main refinancing rate and make a monetary policy statement at the ECB press conference on Thursday, June 9, at 14:45 MT. The central bank will share the current interest rate details and give the overall economic outlook and inflation forecasts.
At the last meeting, Christine Lagarde claimed that the ECB can’t guarantee growth in the eurozone due to geopolitical situation. Thus, it isn’t clear if the faster risk hikes are coming.
The previous meeting brought volatility to the EUR. This time, if the ECB statement is more hawkish than forecasted, EURUSD will likely rise. In a more dovish situation, EURUSD will likely fall.
😎Be ready to trade the EUR pairs!
✅START TRADING✅
👍38🔥8❤3👏3😁3
#MarketNews
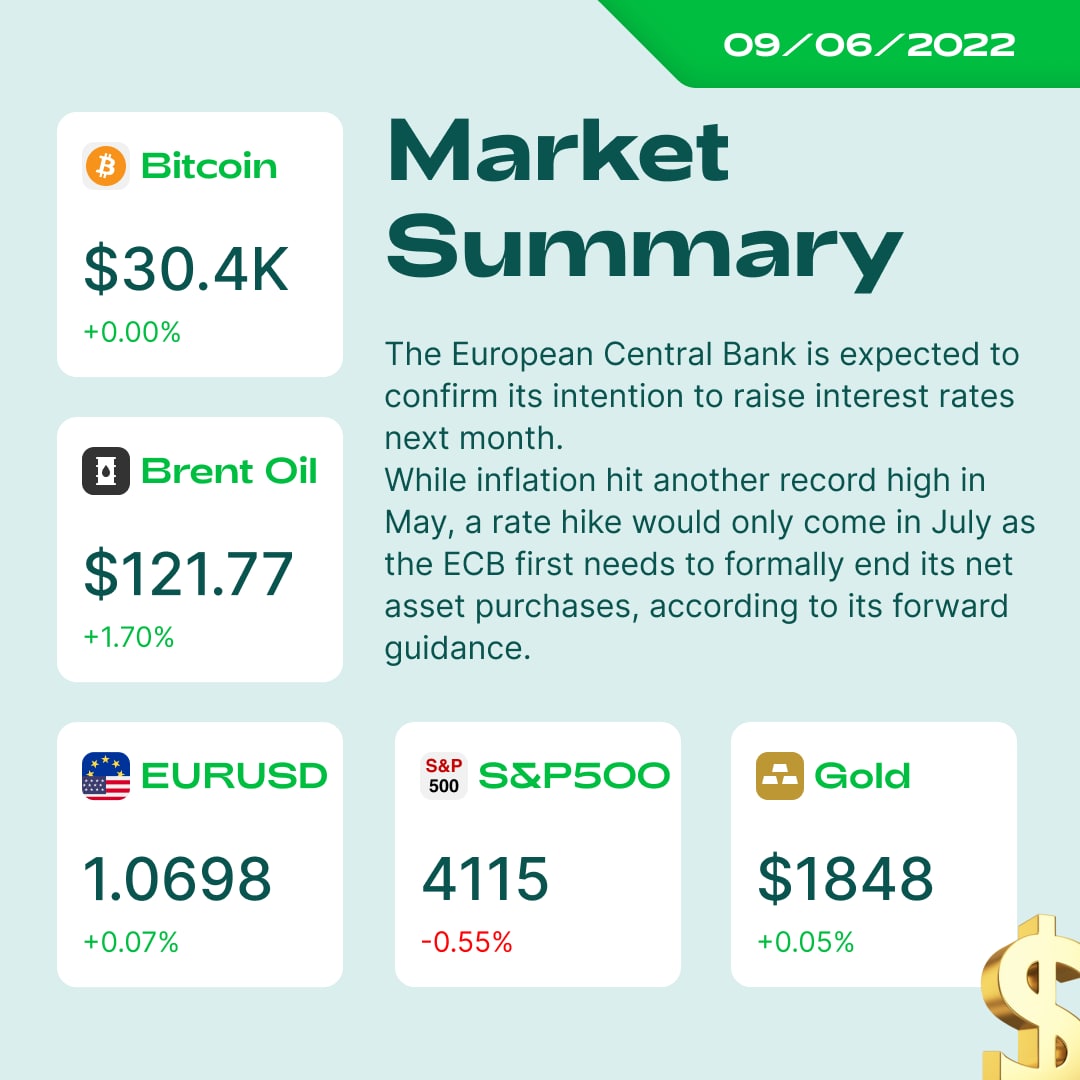
☀️Great day for trading! Here is news which moves the market today! Enjoy!
🇳🇿The Central Bank of New Zealand will begin to reduce the balance sheet in July. It plans to sell off all bonds that were bought during the pandemic over a 5-year period.
🇯🇵Over 80% of Japanese business managers expect USDJPY to stay below 135😐
🚘Tesla continues to hire staff in China despite the Elon Musk's announcement about termination of employment in other regions. Tesla China produced 33 544 vehicles in May, 212% M/M.
☢️Submitted bill to regulate cryptocurrencies in the US classifies most altcoins as "securities" (the competence of the SEC).
🇺🇸The American market is facing energy problems once again. The LNG terminal where the accident occurred was exporting about 30% of all US LNG exports. Also, the market today will react to data on the labor market. Recently, an increasing number of companies have announced the need to reduce the number of employees.
🇨🇳Asian markets are going down. The positive from the easing of COVID restrictions did not last long. Local Chinese media report on the introduction of new restrictions in some regions of China.
😉What are your trading today?
☀️Great day for trading! Here is news which moves the market today! Enjoy!
🇳🇿The Central Bank of New Zealand will begin to reduce the balance sheet in July. It plans to sell off all bonds that were bought during the pandemic over a 5-year period.
🇯🇵Over 80% of Japanese business managers expect USDJPY to stay below 135😐
🚘Tesla continues to hire staff in China despite the Elon Musk's announcement about termination of employment in other regions. Tesla China produced 33 544 vehicles in May, 212% M/M.
☢️Submitted bill to regulate cryptocurrencies in the US classifies most altcoins as "securities" (the competence of the SEC).
🇺🇸The American market is facing energy problems once again. The LNG terminal where the accident occurred was exporting about 30% of all US LNG exports. Also, the market today will react to data on the labor market. Recently, an increasing number of companies have announced the need to reduce the number of employees.
🇨🇳Asian markets are going down. The positive from the easing of COVID restrictions did not last long. Local Chinese media report on the introduction of new restrictions in some regions of China.
😉What are your trading today?
👍29❤4🔥3
#Education
🔥This week’s best indicator is Parabolic SAR🔥
😊This indicator is not only cute, but informative as well!
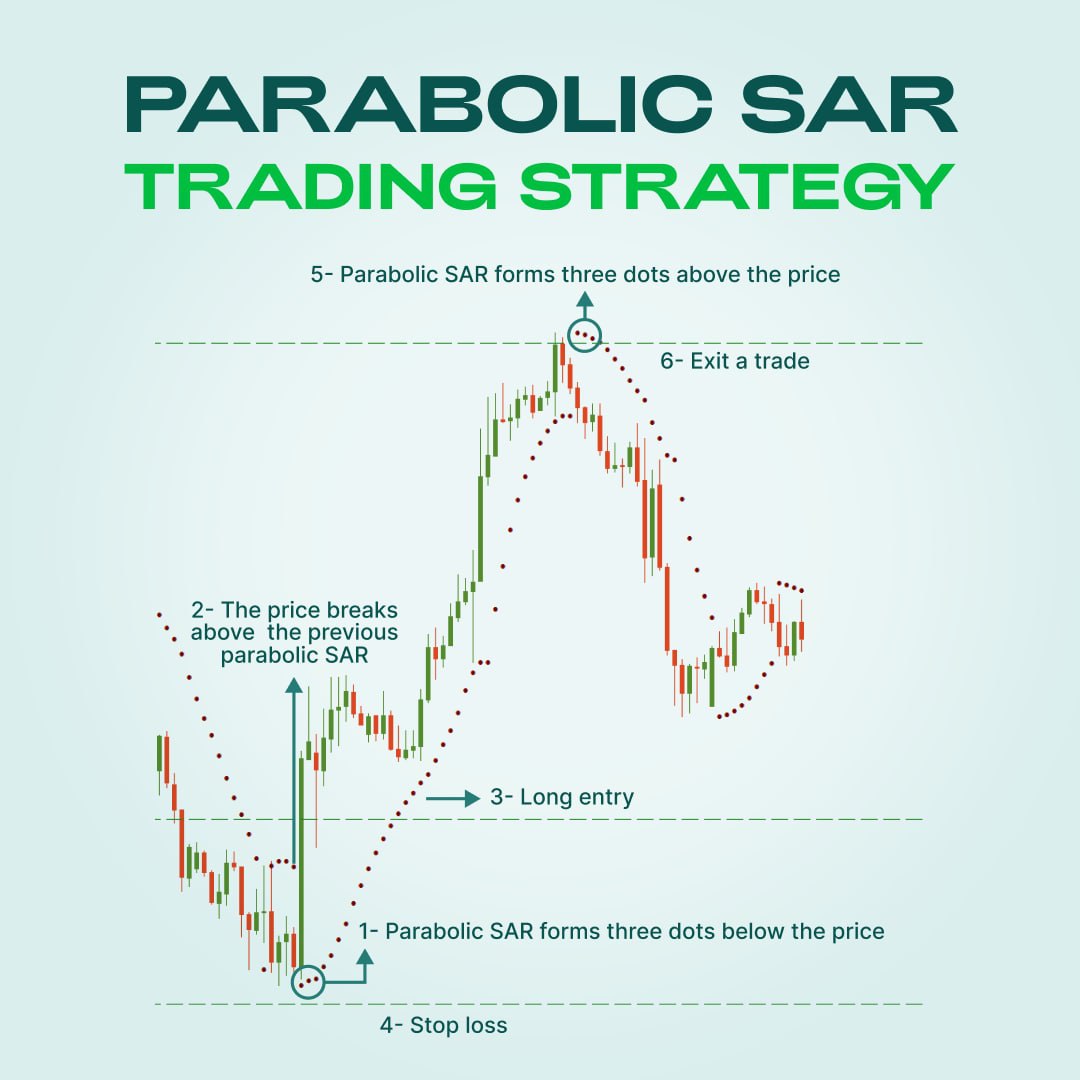
Parabolic SAR is an indicator that is used to determine the end of the latest trends. It’s an abbreviation for Stop And Reverse and shows the current trend’s direction.
The parabolic SAR indicator works by placing a dot above or below the candlestick. The mathematical formula of this indicator is based on the price acceleration factor and the extreme value of the price.
The trend is bullish if the dot is below the bar according to the PSAR indicator. If the PSAR indicator puts a dot above the bar, the trend is bearish.
How to trade with Parabolic SAR?
✅Make sure that the Parabolic SAR has formed at least the dots below the price.
✅Check the price breaks above the previous Parabolic SAR.
✅Now it’s time to go long! Open the order at this moment.
✅Set Stop Loss slightly below the trend indicator.
✅As soon as the Parabolic SAR forms three dots above the price, exit the trade!
❗️Read more about Parabolic SAR here❗️
🧐Do you use Parabolic SAR? Share in the comments!
🔥This week’s best indicator is Parabolic SAR🔥
😊This indicator is not only cute, but informative as well!
Parabolic SAR is an indicator that is used to determine the end of the latest trends. It’s an abbreviation for Stop And Reverse and shows the current trend’s direction.
The parabolic SAR indicator works by placing a dot above or below the candlestick. The mathematical formula of this indicator is based on the price acceleration factor and the extreme value of the price.
The trend is bullish if the dot is below the bar according to the PSAR indicator. If the PSAR indicator puts a dot above the bar, the trend is bearish.
How to trade with Parabolic SAR?
✅Make sure that the Parabolic SAR has formed at least the dots below the price.
✅Check the price breaks above the previous Parabolic SAR.
✅Now it’s time to go long! Open the order at this moment.
✅Set Stop Loss slightly below the trend indicator.
✅As soon as the Parabolic SAR forms three dots above the price, exit the trade!
❗️Read more about Parabolic SAR here❗️
🧐Do you use Parabolic SAR? Share in the comments!
👍26❤7🎉5🔥3😁3👎1