
👋Dear friends! We would like to remind you the FBS analytics' chat rules!
🙏Users can:
- Share opinions
- Share trading results (if not an advertisement)
- Share news
- Share technical analysis
- Share trade ideas
❌Users can't:
- post any advertising messages
- insult other users, including the group administration
- Directly or indirectly invite to private messages (we are trying to protect users from scammers)
❗️If someone from the group texted you privately with any advertising, be aware that this user might be a scammer.
🆘If you see someone breaking chat rules, reply to their message and tag "@Amnetrix". FBS chat administrator will delete the prohibited message and ban the user.
❗️Violation of the rules leads to the complete blocking on the channel and the deletion of all messages❗️
👌Let's make our community better together!
🙏Users can:
- Share opinions
- Share trading results (if not an advertisement)
- Share news
- Share technical analysis
- Share trade ideas
❌Users can't:
- post any advertising messages
- insult other users, including the group administration
- Directly or indirectly invite to private messages (we are trying to protect users from scammers)
❗️If someone from the group texted you privately with any advertising, be aware that this user might be a scammer.
🆘If you see someone breaking chat rules, reply to their message and tag "@Amnetrix". FBS chat administrator will delete the prohibited message and ban the user.
❗️Violation of the rules leads to the complete blocking on the channel and the deletion of all messages❗️
👌Let's make our community better together!

👍185❤41🔥17👏13🥰4⚡3💩2🍌2✍1🤩1🤪1
FBS Analytics pinned «👋Dear friends! We would like to remind you the FBS analytics' chat rules! 🙏Users can: - Share opinions - Share trading results (if not an advertisement) - Share news - Share technical analysis - Share trade ideas ❌Users can't: - post any advertising…»
🇪🇺🇺🇸 #EURUSD
🔥EURUSD is trading inside the support range!
As you can see on the chart, the price usually reacts to the 1.0112 - 1.0150 range. We believe this time will not be an exception as EURUSD needs a correction after the 3-day strong downtrend.
✅Traders might consider looking for a buy trade opportunity at the level of 1.0120 with the target at 1.0210. (most likely to happen)
❗️The trade will not be active if the H4 candle closes below 1.0112. In this case, traders might sell EURUSD with the target at 0.9993. (less likely to happen)
🟩START TRADING🟩
🔥EURUSD is trading inside the support range!
As you can see on the chart, the price usually reacts to the 1.0112 - 1.0150 range. We believe this time will not be an exception as EURUSD needs a correction after the 3-day strong downtrend.
✅Traders might consider looking for a buy trade opportunity at the level of 1.0120 with the target at 1.0210. (most likely to happen)
❗️The trade will not be active if the H4 candle closes below 1.0112. In this case, traders might sell EURUSD with the target at 0.9993. (less likely to happen)
🟩START TRADING🟩

👍45❤11🔥8👏5🥰4
🔥🇨🇦Canada inflation rate:
CPI m/m
Actual: 0.1%
Forecast: 0.1%
Previous: 0.7%
CPI m/m
Actual: 0.1%
Forecast: 0.1%
Previous: 0.7%
❤35👍10🔥1
🇦🇺🇺🇸#AUDUSD
🔥AUDUSD is consolidating above the support trendline!
As you can see on the H4 timeframe chart, the price has reached the trendline. At the same time on the H1 timeframe, we noticed the trend is rounding, meaning buyers might reverse it soon.
Consider looking for buy trades around 0.6990 with the first target at 0.7050. When the price breaks above 0.7050, you might increase your position with the second target at 0.7130.
❗️Trade will be not active if the price plunges below the trendline.
❗️Today, at 15:30 GMT+3, Core Retail Sales will be released. Prepare for high volatility.
🟩START TRADING🟩
🔥AUDUSD is consolidating above the support trendline!
As you can see on the H4 timeframe chart, the price has reached the trendline. At the same time on the H1 timeframe, we noticed the trend is rounding, meaning buyers might reverse it soon.
Consider looking for buy trades around 0.6990 with the first target at 0.7050. When the price breaks above 0.7050, you might increase your position with the second target at 0.7130.
❗️Trade will be not active if the price plunges below the trendline.
❗️Today, at 15:30 GMT+3, Core Retail Sales will be released. Prepare for high volatility.
🟩START TRADING🟩
🔥23👍22❤10
🇺🇸#US500
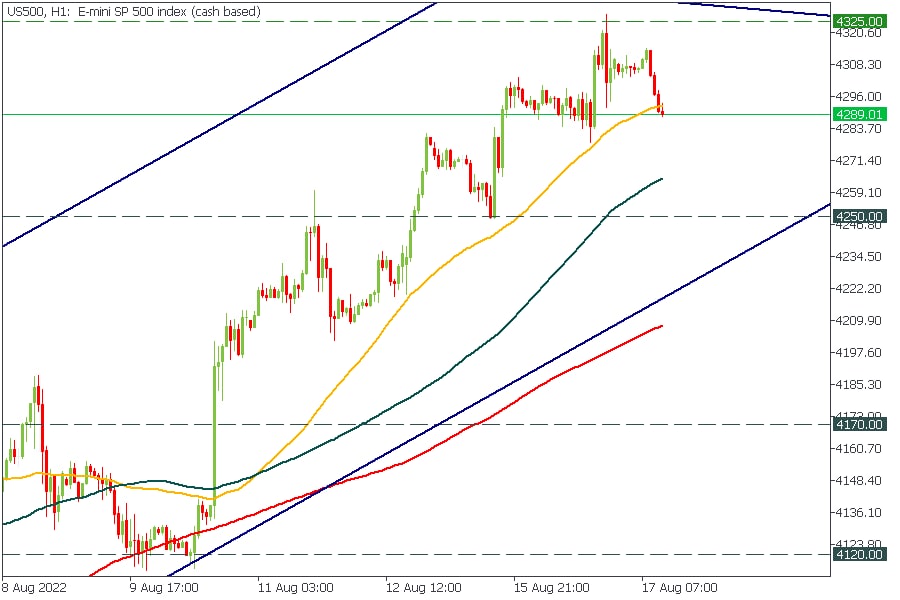
🔥US500 might decline further!
📈The index bounced off the global descending trendline on the H4 timeframe at the level of 4325. Moreover, it broke below the 50-hour moving average, which has been supporting the price since August 9th.
We expect the price to decline to 4250. Moreover, if the index breaks below the support trendline of the ascending channel on the H1 timeframe, the price might decline to 4170.
🟩START TRADING🟩
🔥US500 might decline further!
📈The index bounced off the global descending trendline on the H4 timeframe at the level of 4325. Moreover, it broke below the 50-hour moving average, which has been supporting the price since August 9th.
We expect the price to decline to 4250. Moreover, if the index breaks below the support trendline of the ascending channel on the H1 timeframe, the price might decline to 4170.
🟩START TRADING🟩
👍19🔥6🥰3
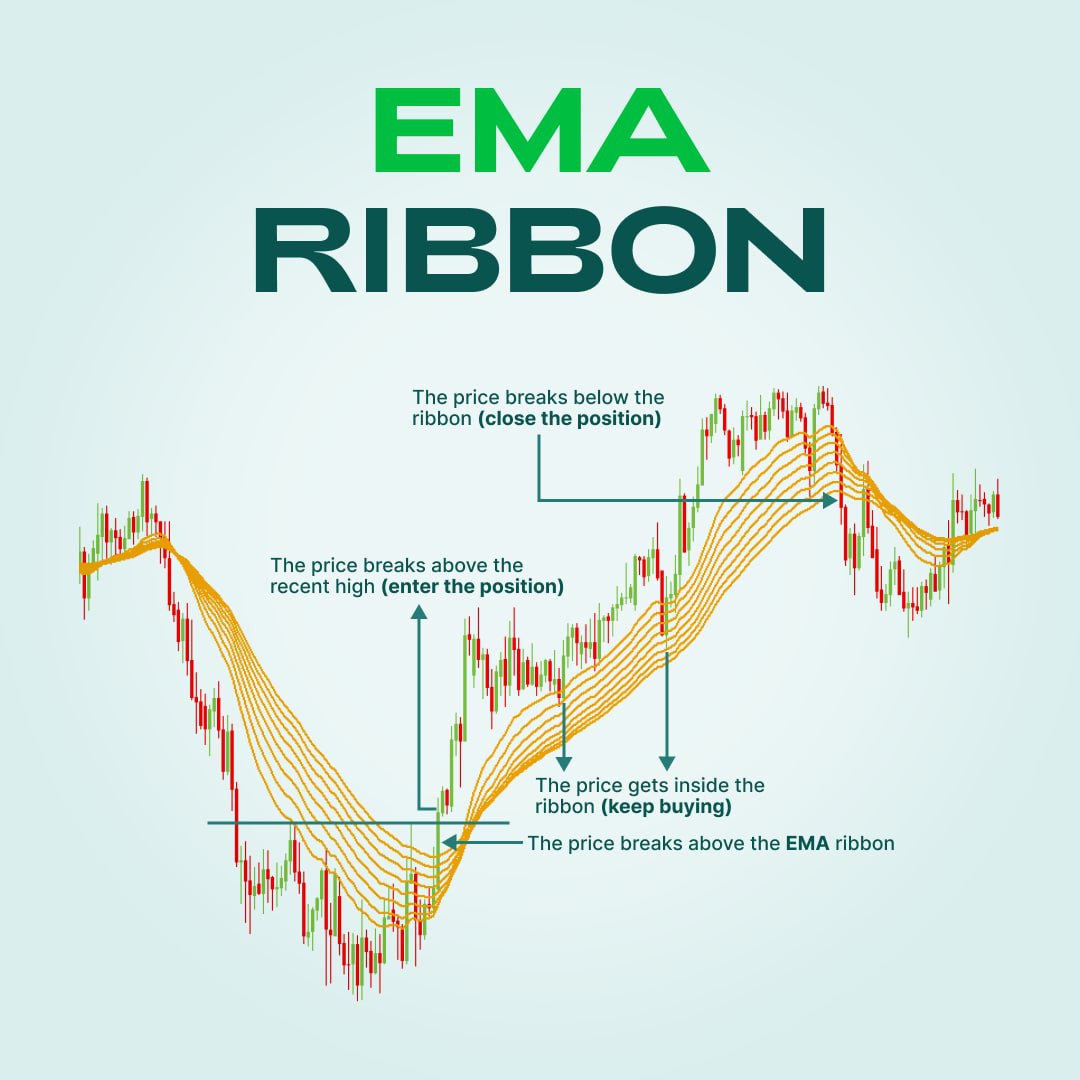
⚖️EMA ribbon - a perfect tool for defining the trend and finding a perfect entry!
Traders and analysts rely on Exponential Moving Average Ribbon to identify turning points, continuations, and overbought/oversold conditions, define support and resistance areas, and measure price trend strengths.
To construct a moving average ribbon, plot many Exponential Moving Averages of varying period lengths on a price chart. Standard parameters include eight or more moving averages and intervals that range from a 2 to 400-period moving average. The most popular EMA ribbon consists of eight lines from the 20 to 55-period EMAs.
How to set the EMA ribbon?
To apply the Exponential Moving Average to your chart in MetaTrader 4 and MetaTrader 5, you need to choose Insert – Indicators – Trend. Then you need to click on the “Moving Average” button and change the MA method to Exponential.
Set eight EMAs from the 20 to 55 period.
How to interpret the EMA ribbon?
The trend strength weakens when all the EMAs converge into one point on the chart. The opposite is true if the EMAs are fanning and moving apart, suggesting that prices range and that a trend is strong or strengthening.
In downtrends, shorter EMAs cross below longer EMAs. Conversely, uptrends show shorter EMAs crossing above longer EMAs.
How to open the position with the EMA ribbon?
Traders usually use EMA Ribbon as support and resistance.
✅Wait for the price to break above the EMA ribbon
✅Get confirmation of the entry (it might be a breakout of a recent high)
✅Enter a BUY trade
✅You can gain your position every time the price gets inside the ribbon
✅Take profit when the short EMA crosses all other lines from above or when the price breaks below the ribbon
Share your experience if you ever traded with the EMA ribbon!
Traders and analysts rely on Exponential Moving Average Ribbon to identify turning points, continuations, and overbought/oversold conditions, define support and resistance areas, and measure price trend strengths.
To construct a moving average ribbon, plot many Exponential Moving Averages of varying period lengths on a price chart. Standard parameters include eight or more moving averages and intervals that range from a 2 to 400-period moving average. The most popular EMA ribbon consists of eight lines from the 20 to 55-period EMAs.
How to set the EMA ribbon?
To apply the Exponential Moving Average to your chart in MetaTrader 4 and MetaTrader 5, you need to choose Insert – Indicators – Trend. Then you need to click on the “Moving Average” button and change the MA method to Exponential.
Set eight EMAs from the 20 to 55 period.
How to interpret the EMA ribbon?
The trend strength weakens when all the EMAs converge into one point on the chart. The opposite is true if the EMAs are fanning and moving apart, suggesting that prices range and that a trend is strong or strengthening.
In downtrends, shorter EMAs cross below longer EMAs. Conversely, uptrends show shorter EMAs crossing above longer EMAs.
How to open the position with the EMA ribbon?
Traders usually use EMA Ribbon as support and resistance.
✅Wait for the price to break above the EMA ribbon
✅Get confirmation of the entry (it might be a breakout of a recent high)
✅Enter a BUY trade
✅You can gain your position every time the price gets inside the ribbon
✅Take profit when the short EMA crosses all other lines from above or when the price breaks below the ribbon
Share your experience if you ever traded with the EMA ribbon!
👍52🔥13❤10
#MarketNews
Good morning, our dear traders! Let’s see what news can move the market today:
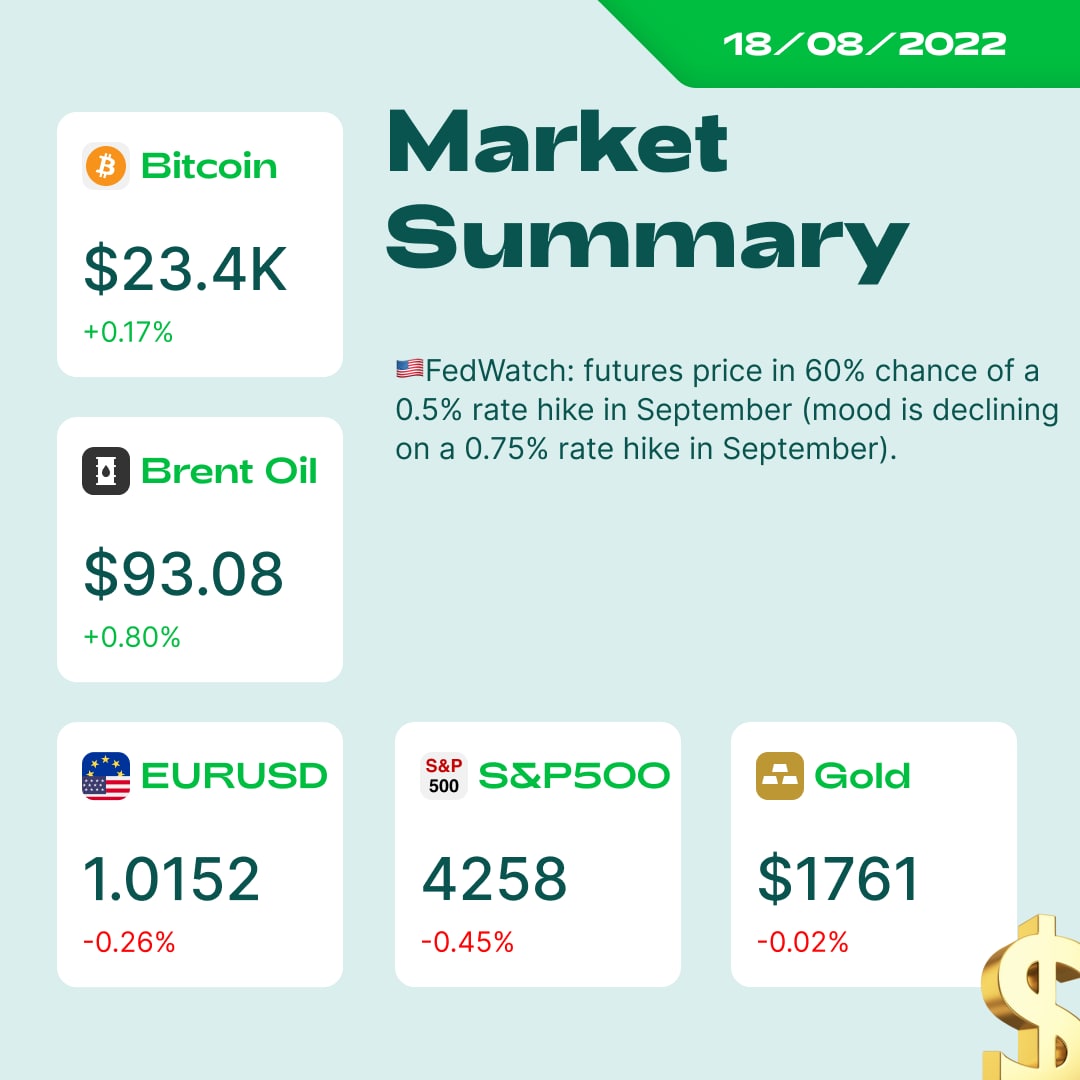
🇺🇸US500 has approached the 200-day moving average, which is now a key resistance level.
🇩🇪Uniper, one of the largest German gas companies, is on the verge of bankruptcy after a 12 billion euros loss due to a gas supplies reduction from Russia.
🍏Apple plans to unveil the new iPhone on September 7th.
⚠️🛢🇪🇺Rising energy and electricity prices in Europe are breaking records. According to Eurostat, energy inflation reached 41.1% YoY in July.
☢️$22 700- $23 400 is an important zone for BTC. In this area 1.36 million wallets bought more than 1 million BTC.
🛢US crude exports rise to record as Europe replaces Russian oil.
What are you trading today?
Good morning, our dear traders! Let’s see what news can move the market today:
🇺🇸US500 has approached the 200-day moving average, which is now a key resistance level.
🇩🇪Uniper, one of the largest German gas companies, is on the verge of bankruptcy after a 12 billion euros loss due to a gas supplies reduction from Russia.
🍏Apple plans to unveil the new iPhone on September 7th.
⚠️🛢🇪🇺Rising energy and electricity prices in Europe are breaking records. According to Eurostat, energy inflation reached 41.1% YoY in July.
☢️$22 700- $23 400 is an important zone for BTC. In this area 1.36 million wallets bought more than 1 million BTC.
🛢US crude exports rise to record as Europe replaces Russian oil.
What are you trading today?
👍23🔥17🥰5❤4
🥇#XAUUSD
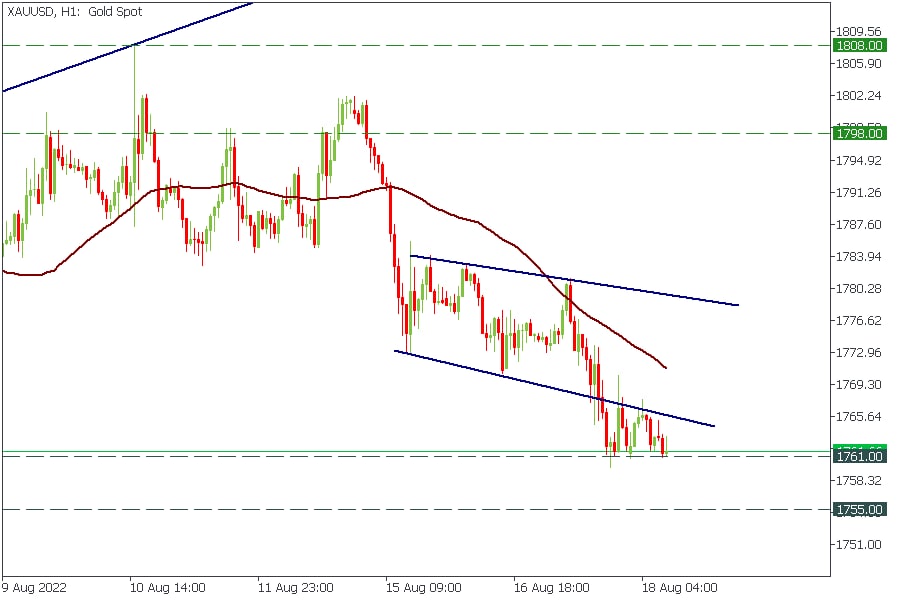
💥Sellers press XAUUSD closer and closer the 1761 support!
Consider selling on the breakout of this level with the target at 1755!
🟩START TRADING🟩
💥Sellers press XAUUSD closer and closer the 1761 support!
Consider selling on the breakout of this level with the target at 1755!
🟩START TRADING🟩
🔥28👍14
🇺🇸🇨🇭#USDCHF
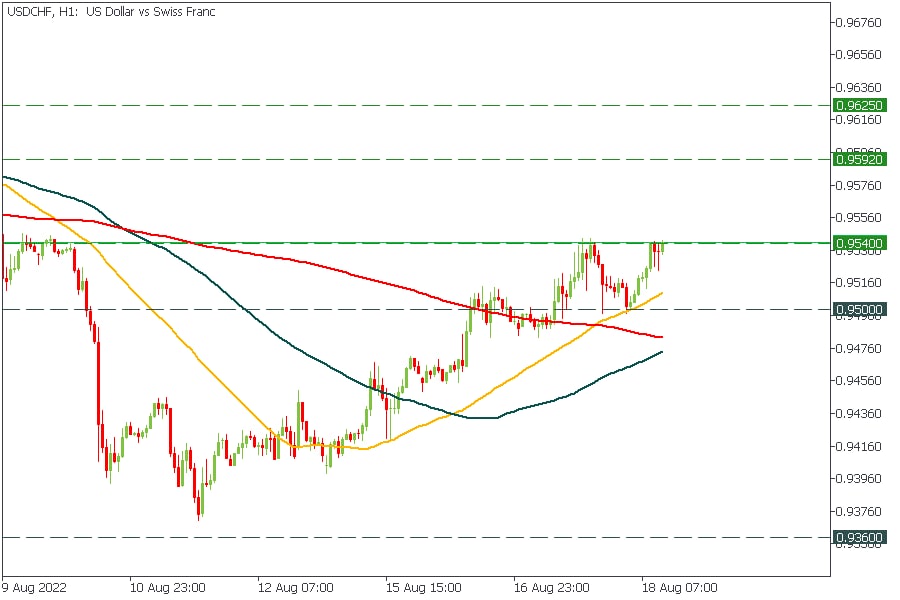
🔥USDCHF is consolidating under the resistance level!
If the price breaks above 0.9540, you might buy with targets at 0.9592 and 0.9625!
On the other hand, the price will decline to 0.9500.
🟩START TRADING🟩
🔥USDCHF is consolidating under the resistance level!
If the price breaks above 0.9540, you might buy with targets at 0.9592 and 0.9625!
On the other hand, the price will decline to 0.9500.
🟩START TRADING🟩
👍27🔥9✍1🆒1
🇨🇦🇯🇵#CADJPY
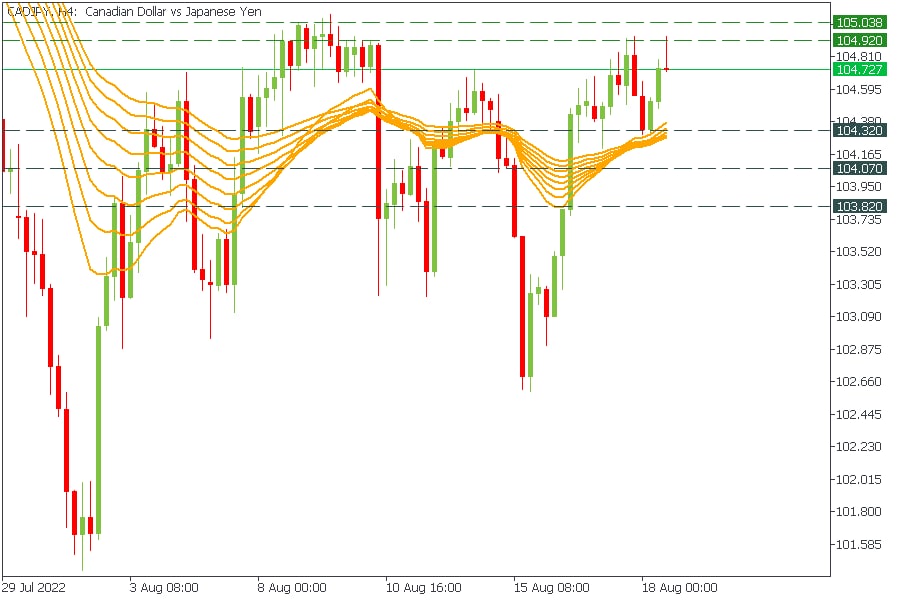
🔥The pair fails to break the resistance range!
The price is declining. You might sell the pair with targets at 104.32, 104.07, 103.82.
🟩START TRADING🟩
🔥The pair fails to break the resistance range!
The price is declining. You might sell the pair with targets at 104.32, 104.07, 103.82.
🟩START TRADING🟩
🔥25👍18
FBS Analytics
🥇#XAUUSD 💥Sellers press XAUUSD closer and closer the 1761 support! Consider selling on the breakout of this level with the target at 1755! 🟩START TRADING🟩
🔥Gold reached $1755 level after the breakout of $1761 support level! What is next?
$1755.00 is a critical support level on the H4 timeframe! If the price breaks the recent low and keeps going, you might sell XAUUSD with the target at $1745!
However, if buyers manage to close H1 and H4 candles above $1755, we might see a pullback to $1761!
Watch the price movement carefully! It is a key moment for gold! Do not forget about SL!
🟩START TRADING🟩
$1755.00 is a critical support level on the H4 timeframe! If the price breaks the recent low and keeps going, you might sell XAUUSD with the target at $1745!
However, if buyers manage to close H1 and H4 candles above $1755, we might see a pullback to $1761!
Watch the price movement carefully! It is a key moment for gold! Do not forget about SL!
🟩START TRADING🟩
👍41🔥12❤5👏4👎3
🇪🇺🇺🇸#EURUSD
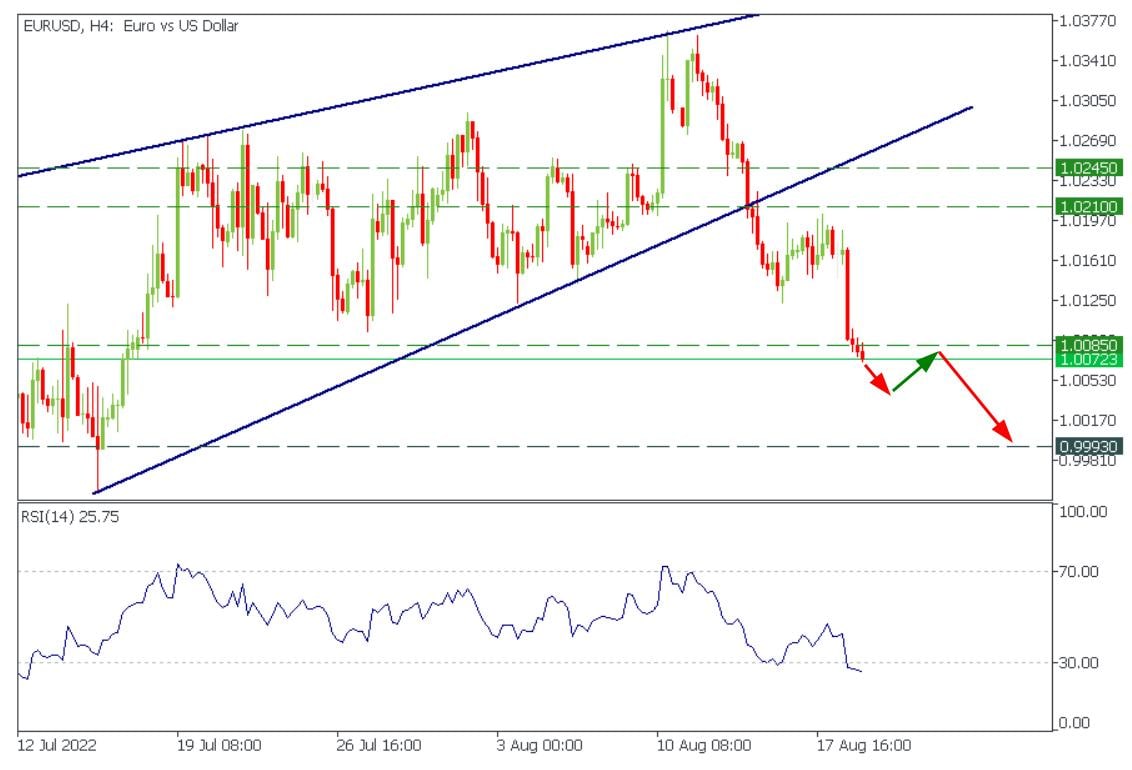
🔥EURUSD is breaking through the main support!
EURUSD is trading below the critical support of 1.00850. If the price keeps momentum, it will quickly decline to 0.99930.
Stop-losses should be placed above 1.0090.
🟩START TRADING🟩
🔥EURUSD is breaking through the main support!
EURUSD is trading below the critical support of 1.00850. If the price keeps momentum, it will quickly decline to 0.99930.
Stop-losses should be placed above 1.0090.
🟩START TRADING🟩
👍22🔥10👏1
FBS Analytics
🇪🇺🇺🇸#EURUSD 🔥EURUSD is breaking through the main support! EURUSD is trading below the critical support of 1.00850. If the price keeps momentum, it will quickly decline to 0.99930. Stop-losses should be placed above 1.0090. 🟩START TRADING🟩
💥Additional information!
EURUSD has formed a bullish falling wedge on the M15 timeframe! However, it might be a bulls' trap.
If the price breaks the upper border, you might consider buying to trade a pullback with the target at 1.0118.
However, if the price breaks through the lower border, it will confirm the trend's strengthens. In this case, you should keep selling the pair.
✅If you enter only after a breakout of either side, it will make your trade much safer!
EURUSD has formed a bullish falling wedge on the M15 timeframe! However, it might be a bulls' trap.
If the price breaks the upper border, you might consider buying to trade a pullback with the target at 1.0118.
However, if the price breaks through the lower border, it will confirm the trend's strengthens. In this case, you should keep selling the pair.
✅If you enter only after a breakout of either side, it will make your trade much safer!
👍32🔥18❤5😁5
#MarketNews
🤩Happy Friday! On the last day of the trading week, we would like to share the most recent market updates! Are you ready?
🔥Reportedly, China’s President Xi Jinping and Russia’s Vladimir Putin will visit the G20 summit in Bali, Indonesia. The Indonesian authorities said they were ready to organize the meeting of Putin and US President Joe Biden during the conference.
🤔According to the Bank of America’s “The rule of 20”, the stock market has not yet reached the bottom. “The rule of 20” indicator goes below 20 every time the market goes down. However, during the correction this year, it has only fallen to 27.
😳Germany’s PPI rose by 5.3% over the previous month from +0.6% in June versus +0.7% expected.
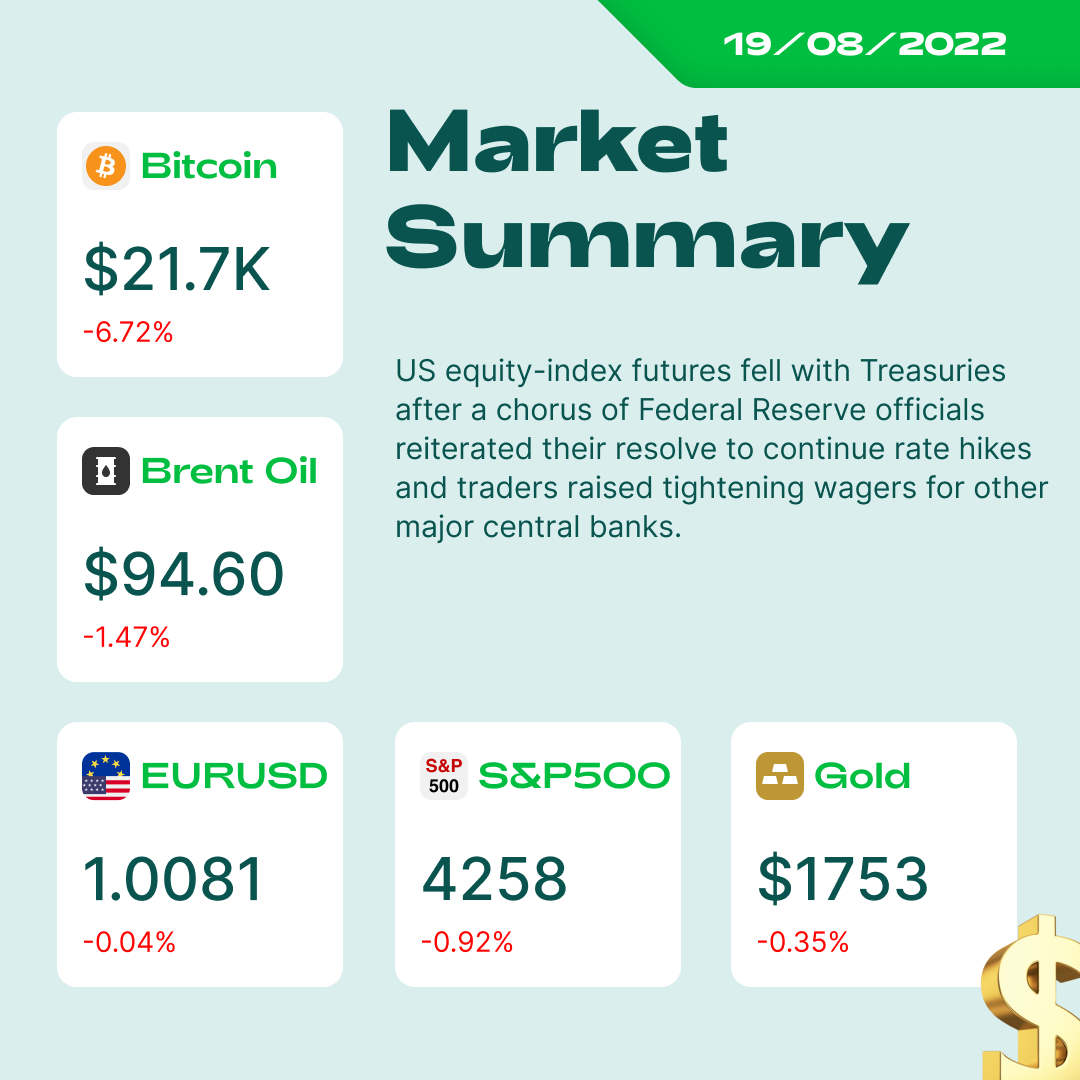
🌚The price of Bitcoin has slipped below $22 000 and now is trading near the crucial level of $21 000.
🛢The price of Brent (XBRUSD) stabilized yesterday above the $95 level but started today in red, inching lower to $92.30.
📈The price of gas (XNGUSD) almost retested the high of June this week, spiking above the 9.62 level.
Key events:
Canada’s Retail Sales & Core Retail Sales – 15:30 GMT+3.
Are you ready for trades before the weekend? Smash that like button if you do!
🤩Happy Friday! On the last day of the trading week, we would like to share the most recent market updates! Are you ready?
🔥Reportedly, China’s President Xi Jinping and Russia’s Vladimir Putin will visit the G20 summit in Bali, Indonesia. The Indonesian authorities said they were ready to organize the meeting of Putin and US President Joe Biden during the conference.
🤔According to the Bank of America’s “The rule of 20”, the stock market has not yet reached the bottom. “The rule of 20” indicator goes below 20 every time the market goes down. However, during the correction this year, it has only fallen to 27.
😳Germany’s PPI rose by 5.3% over the previous month from +0.6% in June versus +0.7% expected.
🌚The price of Bitcoin has slipped below $22 000 and now is trading near the crucial level of $21 000.
🛢The price of Brent (XBRUSD) stabilized yesterday above the $95 level but started today in red, inching lower to $92.30.
📈The price of gas (XNGUSD) almost retested the high of June this week, spiking above the 9.62 level.
Key events:
Canada’s Retail Sales & Core Retail Sales – 15:30 GMT+3.
Are you ready for trades before the weekend? Smash that like button if you do!
👍64❤3🔥3😁3👏2🤩2
We often share ideas to uou how to trade on economic releases, but what market event is your top 1? 🏆
Anonymous Poll
61%
NFP🫰🏻
15%
CPI💪🏻
4%
OPEC meetings🤘🏻
4%
GDP👍🏻
16%
Interest rate 👏🏻
🔥25👍16❤3😁2
#crypto #ETH #ETC
⛓Do you follow the crypto market? If you do, you've probably heard about a huge upcoming update in the Ethereum blockchain. Meet "The Merge!" Analysts see a lot of potential and risks in this change. Sounds complicated?
Check the article below and learn how to trade on this event! ➡️
https://bit.ly/3catfiU
⛓Do you follow the crypto market? If you do, you've probably heard about a huge upcoming update in the Ethereum blockchain. Meet "The Merge!" Analysts see a lot of potential and risks in this change. Sounds complicated?
Check the article below and learn how to trade on this event! ➡️
https://bit.ly/3catfiU
FBS
How to trade ETH, ETC, and other crypto on the Merge
Find out the details about the upcoming merge of the Ethereum Mainnet with the Beacon Chain, the pros and cons of switching from PoW to PoS, and other details
👍28🔥5❤4
Alligator’s helper🐊
Combinations of two indicators can work perfectly during your trading sessions. Let’s look through the indicator that can help Alligator to make an analysis more certain!
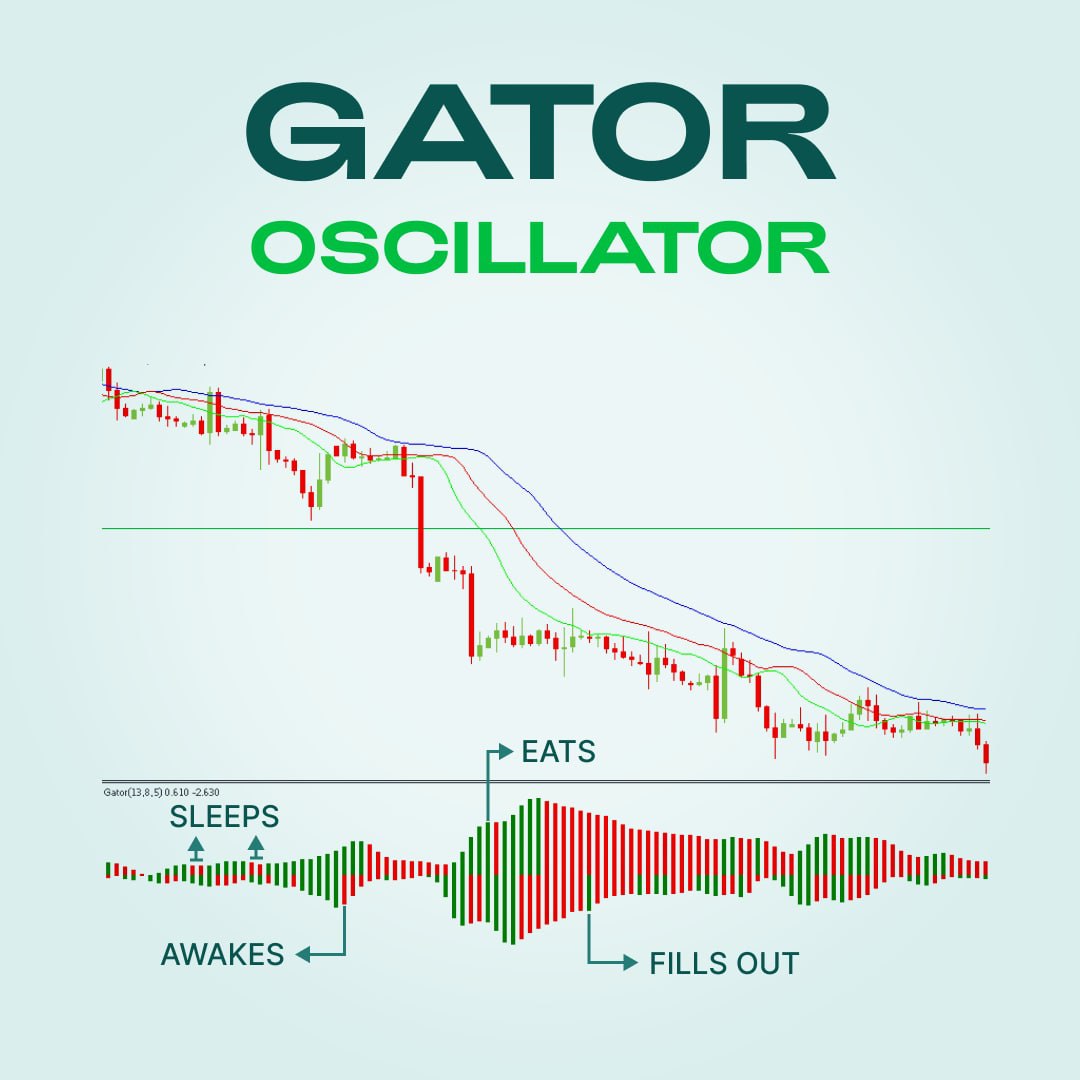
🔸The Gator Oscillator shows when the market is trending and in a range. It helps to recognize and confirm information from the Alligator indicator, so they work well together.
🔸Gator looks as a double histogram with bars above and below the zero line at the same time. A column on the histogram is green if it’s larger than the previous one, and red if it’s smaller.
🔸Moreover, with Gator there is no need to analyze the distance and divergence between indicator lines: this is done automatically.
Gator Oscillator trading strategy
Like the Alligator that opens its mouth and tries to eat the price, the Gator behaves like a living creature. It has 4 states:
1️⃣It sleeps – Both bars are red. It means that there’s no trend in the market. This corresponds to the time when the lines of the Alligator Indicator are intertwined.
2️⃣It awakes – After sleeping, one bar is green and one bar is red. A trend forms. It’s time to look for the opportunities to enter the market.
3️⃣It eats – Both bars are green. The trend continues. Keep your trade open and let your profit increase.
4️⃣It is sated and fills out – After eating, one of the bars is red. It’s a sign that the trend may be approaching its end, so think about taking profit.
❗️Notice that the Gator Oscillator shows only the presence of a trend and not its direction. As a result, it’s better to use it together with the Alligator Indicator or other tools of technical analysis.
Combinations of two indicators can work perfectly during your trading sessions. Let’s look through the indicator that can help Alligator to make an analysis more certain!
🔸The Gator Oscillator shows when the market is trending and in a range. It helps to recognize and confirm information from the Alligator indicator, so they work well together.
🔸Gator looks as a double histogram with bars above and below the zero line at the same time. A column on the histogram is green if it’s larger than the previous one, and red if it’s smaller.
🔸Moreover, with Gator there is no need to analyze the distance and divergence between indicator lines: this is done automatically.
Gator Oscillator trading strategy
Like the Alligator that opens its mouth and tries to eat the price, the Gator behaves like a living creature. It has 4 states:
1️⃣It sleeps – Both bars are red. It means that there’s no trend in the market. This corresponds to the time when the lines of the Alligator Indicator are intertwined.
2️⃣It awakes – After sleeping, one bar is green and one bar is red. A trend forms. It’s time to look for the opportunities to enter the market.
3️⃣It eats – Both bars are green. The trend continues. Keep your trade open and let your profit increase.
4️⃣It is sated and fills out – After eating, one of the bars is red. It’s a sign that the trend may be approaching its end, so think about taking profit.
❗️Notice that the Gator Oscillator shows only the presence of a trend and not its direction. As a result, it’s better to use it together with the Alligator Indicator or other tools of technical analysis.
👍56❤10🔥8😁4🥰2
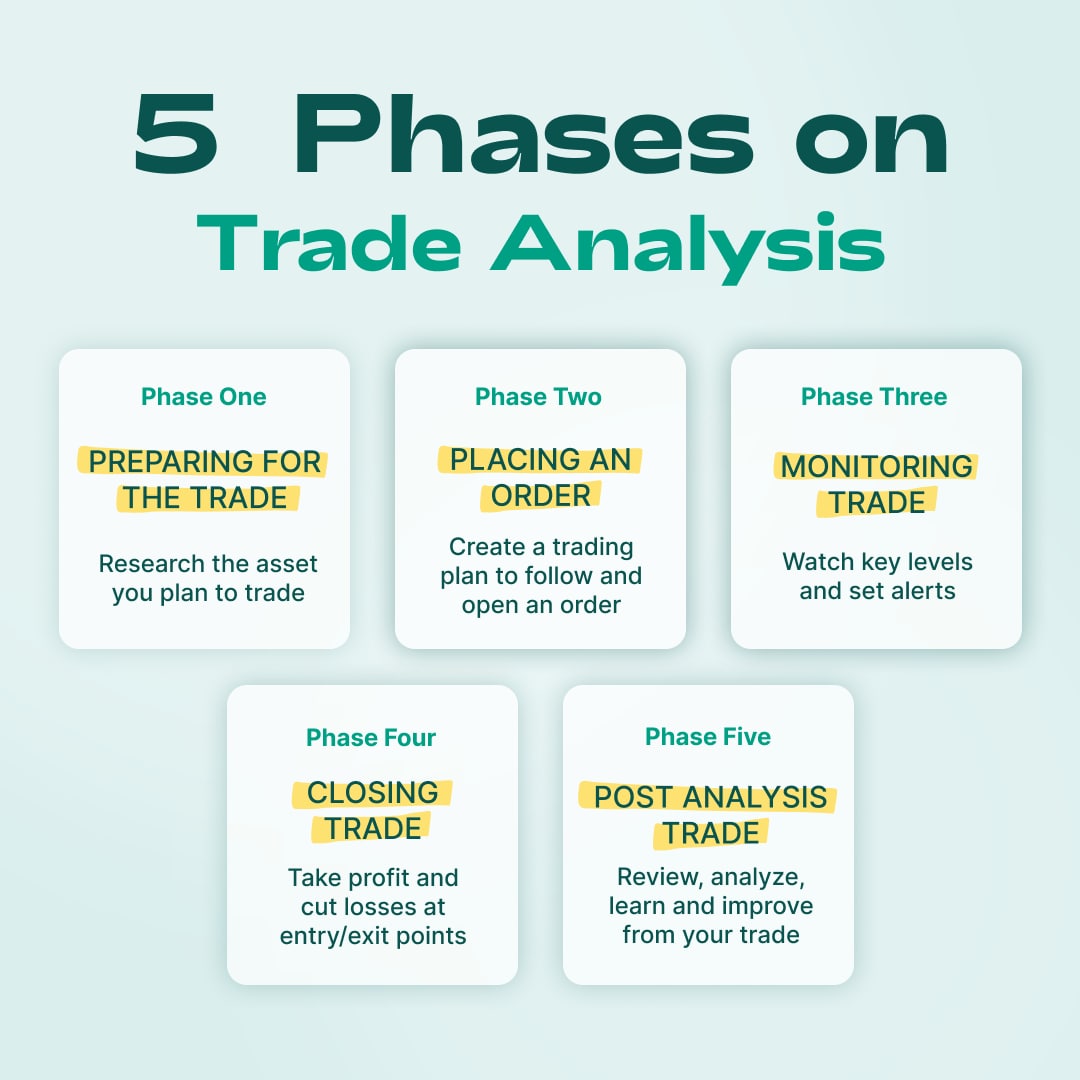
Five phases of trade analysis
🙈When you just start trading, you are often confused about what to do. What are the steps? What did I forget to do? Keep calm, save this post in order not to forget all the actions!
Phase 1️⃣: Preparing for the trade
Before opening the trade, do a little research about the asset! Are there any market events that can move it, or what are the key support and resistance levels on the chart?
Phase 2️⃣: Placing a trade
After the research, you’ll create a trading plan easily! Try to follow it strictly, and place the order accordingly!
Phase 3️⃣: Monitoring trade
Watch how the price moves when the trade is opened. Don’t forget to set the alerts that can notify you if you don’t want to watch the chart nonstop.
Phase 4️⃣: Closing trade
Exit the trade when your targets are achieved! Using Stop Loss and Take Profit can really help you to control money in your trade!
Phase 5️⃣: Post-analysis of trade
Learning from your mistakes is crucial in trading, so after exiting, spend time reviewing and analyzing your actions postpartum. Next time you’ll make it even better!
👌🏻Trading is very systematic, so doing everything step by step and success will reach you on your way! Good luck!
🙈When you just start trading, you are often confused about what to do. What are the steps? What did I forget to do? Keep calm, save this post in order not to forget all the actions!
Phase 1️⃣: Preparing for the trade
Before opening the trade, do a little research about the asset! Are there any market events that can move it, or what are the key support and resistance levels on the chart?
Phase 2️⃣: Placing a trade
After the research, you’ll create a trading plan easily! Try to follow it strictly, and place the order accordingly!
Phase 3️⃣: Monitoring trade
Watch how the price moves when the trade is opened. Don’t forget to set the alerts that can notify you if you don’t want to watch the chart nonstop.
Phase 4️⃣: Closing trade
Exit the trade when your targets are achieved! Using Stop Loss and Take Profit can really help you to control money in your trade!
Phase 5️⃣: Post-analysis of trade
Learning from your mistakes is crucial in trading, so after exiting, spend time reviewing and analyzing your actions postpartum. Next time you’ll make it even better!
👌🏻Trading is very systematic, so doing everything step by step and success will reach you on your way! Good luck!
👍106❤41👎9🥰5👏3😁2