
🇺🇸📈#US100
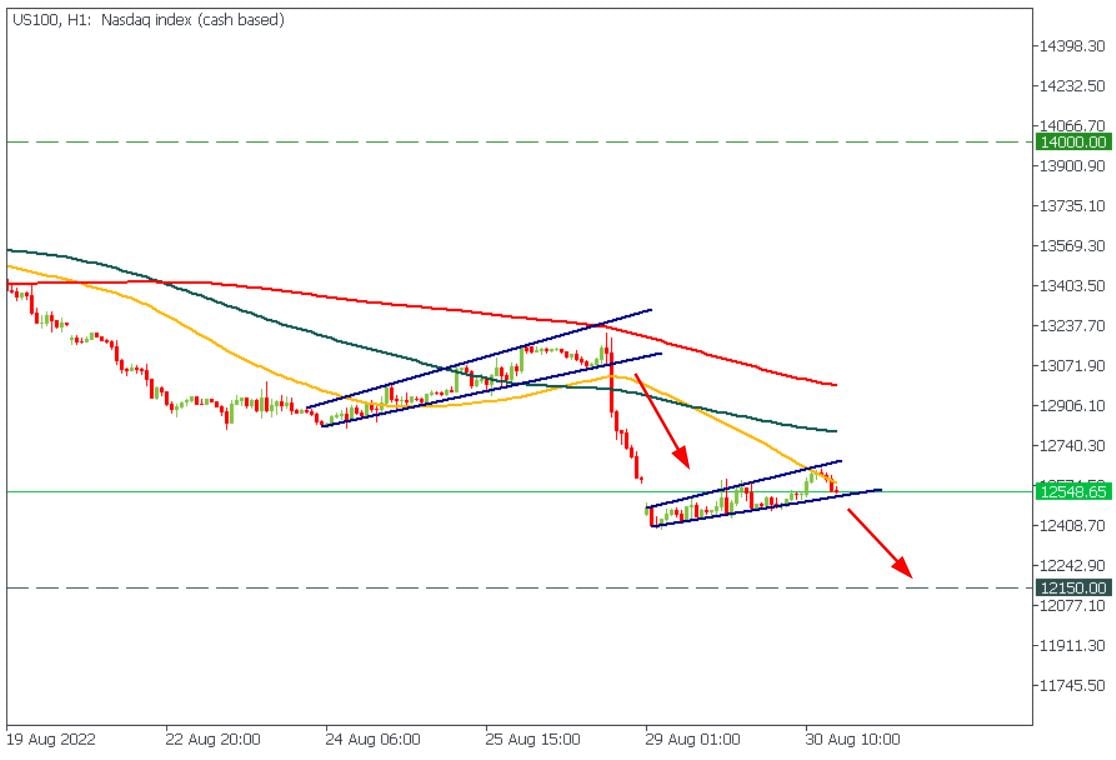
💥The US stock market is ahead of the 3rd wave of correction!
The price has formed an invented rising wedge, which usually works as a bearish pattern. You can consider selling US100 after the lower border breakout!
TP: 12 150
Potential profit: 40 000 points
💚 START TRADING 💚
💥The US stock market is ahead of the 3rd wave of correction!
The price has formed an invented rising wedge, which usually works as a bearish pattern. You can consider selling US100 after the lower border breakout!
TP: 12 150
Potential profit: 40 000 points
💚 START TRADING 💚
🔥19👍13❤3
🇬🇧🏦#GBPUSD
💥Goldman Sachs:
Inflation in the UK could exceed 22% in 2023 if gas prices remain at the same high level.
Meanwhile GBPUSD is breaking below the recent low. The next target is 1.1454 (March 2020 low).
❗️Make sure you enter the trade only after the breakout confirmation!
💚 START TRADING 💚
💥Goldman Sachs:
Inflation in the UK could exceed 22% in 2023 if gas prices remain at the same high level.
Meanwhile GBPUSD is breaking below the recent low. The next target is 1.1454 (March 2020 low).
❗️Make sure you enter the trade only after the breakout confirmation!
💚 START TRADING 💚

❤40👍13🥰3👏3😱3
⚡️We collected everything from Jackson Hole Symposium you need to know! And included four amazing trade ideas on gold, euro, JPY, and US500
Check our fresh analytics and tell us, what do you think 😉
https://bit.ly/3TxY6GL
⬆️
Check our fresh analytics and tell us, what do you think 😉
https://bit.ly/3TxY6GL
⬆️

👍38❤11👎5😍4🔥3👏3
#MarketNews
☀️Good morning, dear traders! Here are the news moving markets right now! We wish you a great day.
🇫🇷Inflation in France is declining. Consumer inflation amounted to 6.5% against 6.8% in July and the forecast of 6.7%. Pressure on the ECB may be eased.
☢️BTC mining difficulty = record (up 9.26% in 3 weeks = strongest increase since Jan 2022). BTC price has a strong lagging correlation with mining difficulty.
🇨🇳Chinese economy recovers despite virus restrictions. China's Manufacturing PMI rose to 49.4 from an expected 49.2. In the non-manufacturing sector, the index amounted to 52.6 points, while the forecast was 52.3.
🇹🇼🇨🇳Taiwan fired a Chinese drone near Kinmen Island for the first time. According to the Financial Times, Taiwan is starting to act more confidently.
🇺🇸A greater-than-expected JOLTS Job Openings sent the US stock market down. The growth in the number of vacancies means a strong labor market. Consequently, the Fed will be able to keep high rates longer.
🇺🇸Biden has filed documents to participate in the 2024 elections. Meanwhile, according to the poll, 43% of Americans believe a civil war in the states is more or less likely in the next 10 years.
What are you trading today?
☀️Good morning, dear traders! Here are the news moving markets right now! We wish you a great day.
🇫🇷Inflation in France is declining. Consumer inflation amounted to 6.5% against 6.8% in July and the forecast of 6.7%. Pressure on the ECB may be eased.
☢️BTC mining difficulty = record (up 9.26% in 3 weeks = strongest increase since Jan 2022). BTC price has a strong lagging correlation with mining difficulty.
🇨🇳Chinese economy recovers despite virus restrictions. China's Manufacturing PMI rose to 49.4 from an expected 49.2. In the non-manufacturing sector, the index amounted to 52.6 points, while the forecast was 52.3.
🇹🇼🇨🇳Taiwan fired a Chinese drone near Kinmen Island for the first time. According to the Financial Times, Taiwan is starting to act more confidently.
🇺🇸A greater-than-expected JOLTS Job Openings sent the US stock market down. The growth in the number of vacancies means a strong labor market. Consequently, the Fed will be able to keep high rates longer.
🇺🇸Biden has filed documents to participate in the 2024 elections. Meanwhile, according to the poll, 43% of Americans believe a civil war in the states is more or less likely in the next 10 years.
What are you trading today?

👍19🔥7👏2
FBS Analytics
🥇The price has reached 1730! What is next? XAUUSD is trading right above the support level of 1730, however it is still moving under the 50-hour MA. You might start gaining your buy position around 1730 with the target at 1743 - 1745. When the price breaks…
🥇#XAUUSD
🔥Gold update!
The price broke below the 1718 - 1720 range, which now acts as the strongest resistance.
The current support range is between 1711 and 1713, where buyers might attempt to stop this dump.
👍We might trade inside this horizontal range until a breakout:
1) Pack a BUY position inside this support range with the target at 1718 - 1720.
2) Pack a SELL position inside the resistance range of 1718 - 1720 with the target at 1713.
✅If XAUUSD breaks above the upper block, it will head towards 1730.
❗️If XAUUSD breaks below the lower block, it will fall to 1700 - 1703.
💚 START TRADING 💚
🔥Gold update!
The price broke below the 1718 - 1720 range, which now acts as the strongest resistance.
The current support range is between 1711 and 1713, where buyers might attempt to stop this dump.
👍We might trade inside this horizontal range until a breakout:
1) Pack a BUY position inside this support range with the target at 1718 - 1720.
2) Pack a SELL position inside the resistance range of 1718 - 1720 with the target at 1713.
✅If XAUUSD breaks above the upper block, it will head towards 1730.
❗️If XAUUSD breaks below the lower block, it will fall to 1700 - 1703.
💚 START TRADING 💚
👍63🔥16❤8😁6🥰4👏3👎2
🇺🇸#USD #DXY
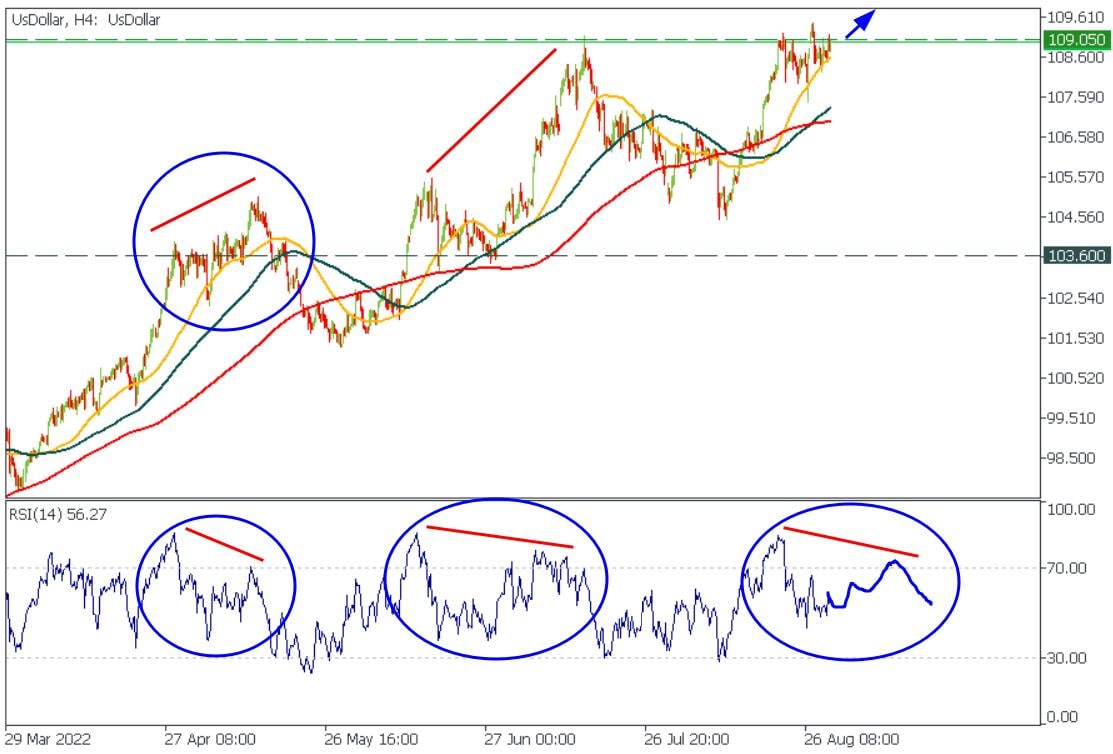
👆🔥US dollar index is looking up!
The RSI repeats the same pattern, which has also appeared twice in 5 previous months.
❗️The H4 RSI goes to 84 -> RSI declines, while the price stays at the same level -> Another pump when RSI reaches 70 - 75 -> divergence appears -> deeper correction happens.❗️
💥It seems like the US dollar is ready for the September final rally! But are you ready for that?
💚 START TRADING 💚
👆🔥US dollar index is looking up!
The RSI repeats the same pattern, which has also appeared twice in 5 previous months.
❗️The H4 RSI goes to 84 -> RSI declines, while the price stays at the same level -> Another pump when RSI reaches 70 - 75 -> divergence appears -> deeper correction happens.❗️
💥It seems like the US dollar is ready for the September final rally! But are you ready for that?
💚 START TRADING 💚
👍36🔥16❤9
FBS Analytics
🥇#XAUUSD 🔥Gold update! The price broke below the 1718 - 1720 range, which now acts as the strongest resistance. The current support range is between 1711 and 1713, where buyers might attempt to stop this dump. 👍We might trade inside this horizontal range…
🔥Daily XAUUSD update!
After a consolidation between two horizonal ranges the price broke through the lower one and reached our target at 1700 - 1704!
🎉Congratulations to everybody who followed our idea, cause it went extremely well!
🤔What is next?
Currently the price is trading right above the support descending trendline (connect August 5 and August 22 lows) and the 1700 - 1704 support block. We believe this range is quiet strong to be broken through right away. That's why we suggest you to gain a BUY position inside 1700 - 1704 range and hold it at least to 1711 - 1713.
Moreover, we expect the price to touch the 50-hour MA soon!
❗️If the price loses 1700 support, it will fall to 1685!❗️
Hit ❤️ if you like our analysis!
💚 START TRADING 💚
After a consolidation between two horizonal ranges the price broke through the lower one and reached our target at 1700 - 1704!
🎉Congratulations to everybody who followed our idea, cause it went extremely well!
🤔What is next?
Currently the price is trading right above the support descending trendline (connect August 5 and August 22 lows) and the 1700 - 1704 support block. We believe this range is quiet strong to be broken through right away. That's why we suggest you to gain a BUY position inside 1700 - 1704 range and hold it at least to 1711 - 1713.
Moreover, we expect the price to touch the 50-hour MA soon!
❗️If the price loses 1700 support, it will fall to 1685!❗️
Hit ❤️ if you like our analysis!
💚 START TRADING 💚
❤186👍32🔥14❤🔥6
#MarketNews
Happy September everyone!🍂
Hope you have a great day, and here is news you need to know:
📉The global stock index hit a six-week low as Nasdaq 100 futures tumbled more than 1%, partly on the back of chip maker Nvidia Corp. because of the sales warning.
🇨🇳The survey in China showed that factory activity dwindled in August due to power shortages and Covid-related restrictions.
🎀Disney stock rose after hours on reports that Disney was looking into a membership program. Disney's new program could include discounts or perks at its theme parks, merchandise, resorts, and streaming services to get consumers to spend more.
☢️Bitcoin traded above $20,000 again after breaking this resistance level overnight. Global macroeconomic headwinds continue to affect the crypto and capital markets.
🛢This week, the G7 finance ministers will discuss the possibility of buying Russian oil at a fixed price, which could lower world energy prices.
🇯🇵The yen fell to a new 24-year low due to a sharp rise in Treasuries.
Have a great trading day!
Happy September everyone!🍂
Hope you have a great day, and here is news you need to know:
📉The global stock index hit a six-week low as Nasdaq 100 futures tumbled more than 1%, partly on the back of chip maker Nvidia Corp. because of the sales warning.
🇨🇳The survey in China showed that factory activity dwindled in August due to power shortages and Covid-related restrictions.
🎀Disney stock rose after hours on reports that Disney was looking into a membership program. Disney's new program could include discounts or perks at its theme parks, merchandise, resorts, and streaming services to get consumers to spend more.
☢️Bitcoin traded above $20,000 again after breaking this resistance level overnight. Global macroeconomic headwinds continue to affect the crypto and capital markets.
🛢This week, the G7 finance ministers will discuss the possibility of buying Russian oil at a fixed price, which could lower world energy prices.
🇯🇵The yen fell to a new 24-year low due to a sharp rise in Treasuries.
Have a great trading day!

👍33🔥8❤4👎1
Standard indicator for unusual signals!👍🏻
Not all indicators are difficult, even if they look so! Consider using the Standard Deviation, as it’s extremely easy to understand💫
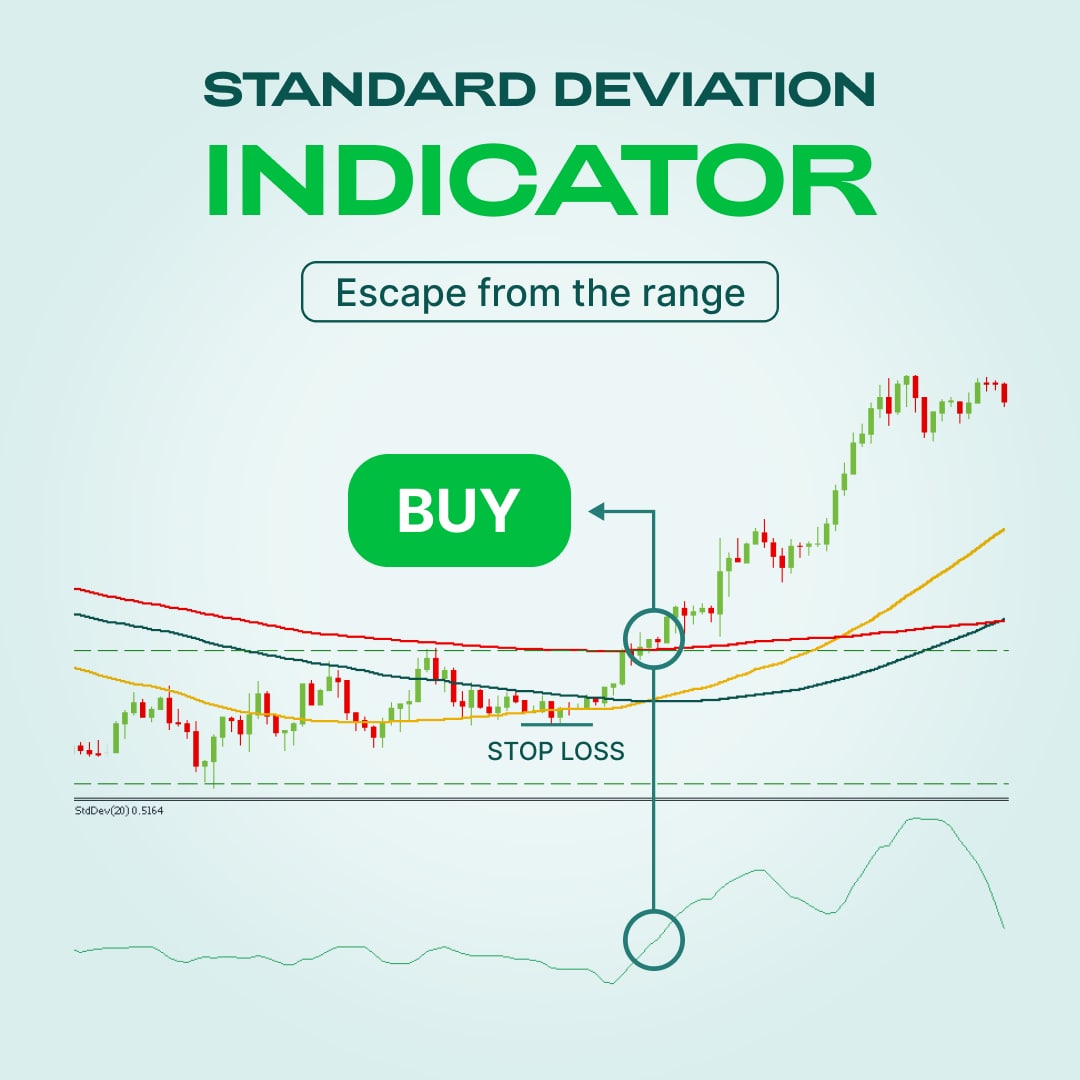
📈Standard deviation indicator measures deviations of the price from the Moving Average. It’s a statistical measure of market volatility that calculates how far prices deviate from the average price. If prices are trading in a narrow trading range, the Standard Deviation indicator will return a low value indicating low volatility. Conversely, if prices fluctuate sharply up and down, the Standard Deviation returns a high value, indicating high volatility.
👀Let’s look at the example, which is called “the escape from the range”. This signal appears after the quotes leave the range - the correction area before the start of a new movement. Before the price goes out of the range, the indicator line should be at its lows, and in the window you can draw a horizontal level through its nearest highs. When the price goes out of the range, the SD line also breaks its level up, confirming the entry signal.
In the picture we can see:
🔸On the hourly chart of the USDJPY pair, the price is coming out of a flat up.
🔸The line of the indicator confirms the signal rising above the level drawn through its nearest highs. You can open a buy position.
🔸 Stop loss is placed under the nearest minimum. Profits can be taken when the price reaches an important resistance level or after signs of a reversal appear.
Don’t be afraid to try new indicators and share you experience with us! ✨
Not all indicators are difficult, even if they look so! Consider using the Standard Deviation, as it’s extremely easy to understand💫
📈Standard deviation indicator measures deviations of the price from the Moving Average. It’s a statistical measure of market volatility that calculates how far prices deviate from the average price. If prices are trading in a narrow trading range, the Standard Deviation indicator will return a low value indicating low volatility. Conversely, if prices fluctuate sharply up and down, the Standard Deviation returns a high value, indicating high volatility.
👀Let’s look at the example, which is called “the escape from the range”. This signal appears after the quotes leave the range - the correction area before the start of a new movement. Before the price goes out of the range, the indicator line should be at its lows, and in the window you can draw a horizontal level through its nearest highs. When the price goes out of the range, the SD line also breaks its level up, confirming the entry signal.
In the picture we can see:
🔸On the hourly chart of the USDJPY pair, the price is coming out of a flat up.
🔸The line of the indicator confirms the signal rising above the level drawn through its nearest highs. You can open a buy position.
🔸 Stop loss is placed under the nearest minimum. Profits can be taken when the price reaches an important resistance level or after signs of a reversal appear.
Don’t be afraid to try new indicators and share you experience with us! ✨
👍41❤6🔥3
🇯🇵 #USDJPY
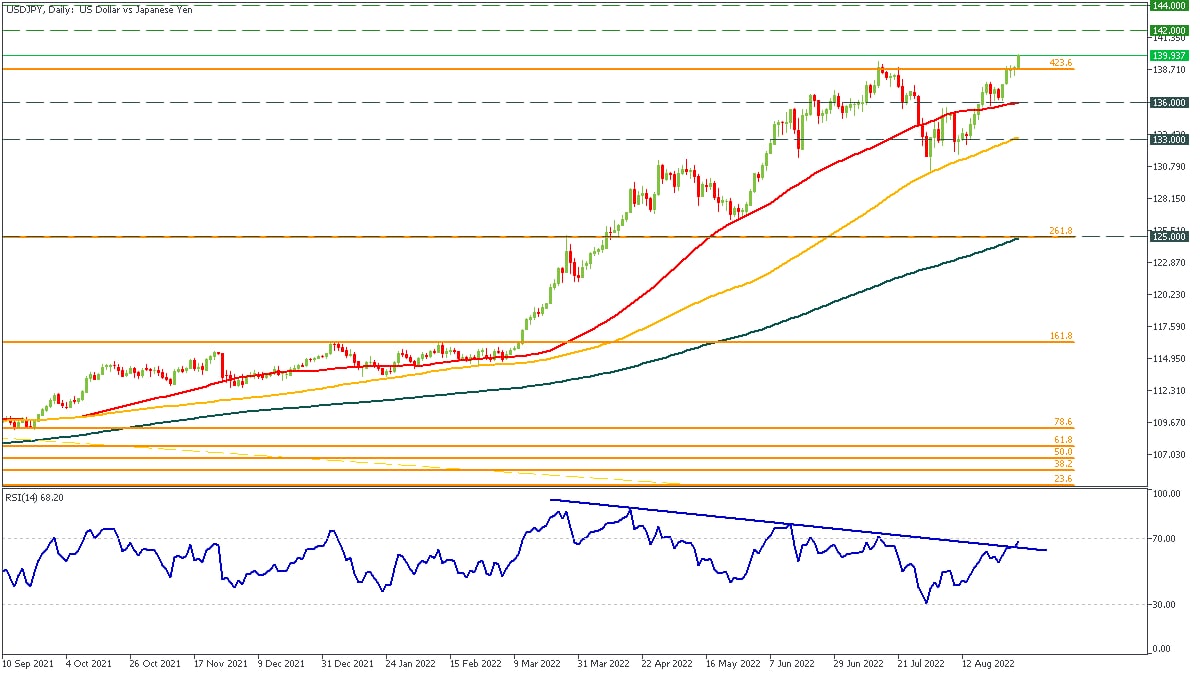
🚀 After several attempts, USDJPY finally broke through the resistance of 139.90, moving extremely close to the critical level of 140.00. It's widely believed that the Bank of Japan will start currency interventions on this level, trying to strengthen the currency by any means.
🤨 We agree with the BOJ and think it's time for the pair to slow down, print a divergence and a reversal pattern, and move lower to the 200-daily MA. However, change in the trend can take a lot of time.
📉 We suggest selling the pair at the 142.00 and 144.00 levels, with the stop loss above 145.50. Thus, your risk-reward ratio will be approximately 1:6.
❓ What are your thoughts on the JPY?
💚 START TRADING 💚
🚀 After several attempts, USDJPY finally broke through the resistance of 139.90, moving extremely close to the critical level of 140.00. It's widely believed that the Bank of Japan will start currency interventions on this level, trying to strengthen the currency by any means.
🤨 We agree with the BOJ and think it's time for the pair to slow down, print a divergence and a reversal pattern, and move lower to the 200-daily MA. However, change in the trend can take a lot of time.
📉 We suggest selling the pair at the 142.00 and 144.00 levels, with the stop loss above 145.50. Thus, your risk-reward ratio will be approximately 1:6.
❓ What are your thoughts on the JPY?
💚 START TRADING 💚
👍27❤8
FBS Analytics
🇬🇧🏦#GBPUSD 💥Goldman Sachs: Inflation in the UK could exceed 22% in 2023 if gas prices remain at the same high level. Meanwhile GBPUSD is breaking below the recent low. The next target is 1.1454 (March 2020 low). ❗️Make sure you enter the trade only after…
🇬🇧🇺🇸#GBPUSD
👇The pair is trading right above 1.1400, which is March 2020 low. Here buyers might enter the game and try to reverse the trend!
🟢Lower-than-expected NFP might help them to do that, in this case the pair might increase to 1.1600!
🔥❗️However, if the price drops below 1.1400, it will keep going down towards 1.0740, which is 1985 low!
🤔Do you think the pair will decline to 1.0740?
👇The pair is trading right above 1.1400, which is March 2020 low. Here buyers might enter the game and try to reverse the trend!
🟢Lower-than-expected NFP might help them to do that, in this case the pair might increase to 1.1600!
🔥❗️However, if the price drops below 1.1400, it will keep going down towards 1.0740, which is 1985 low!
🤔Do you think the pair will decline to 1.0740?
👍32🔥13🤔10😱10🥰5
🇺🇸#Stocks #Crypto
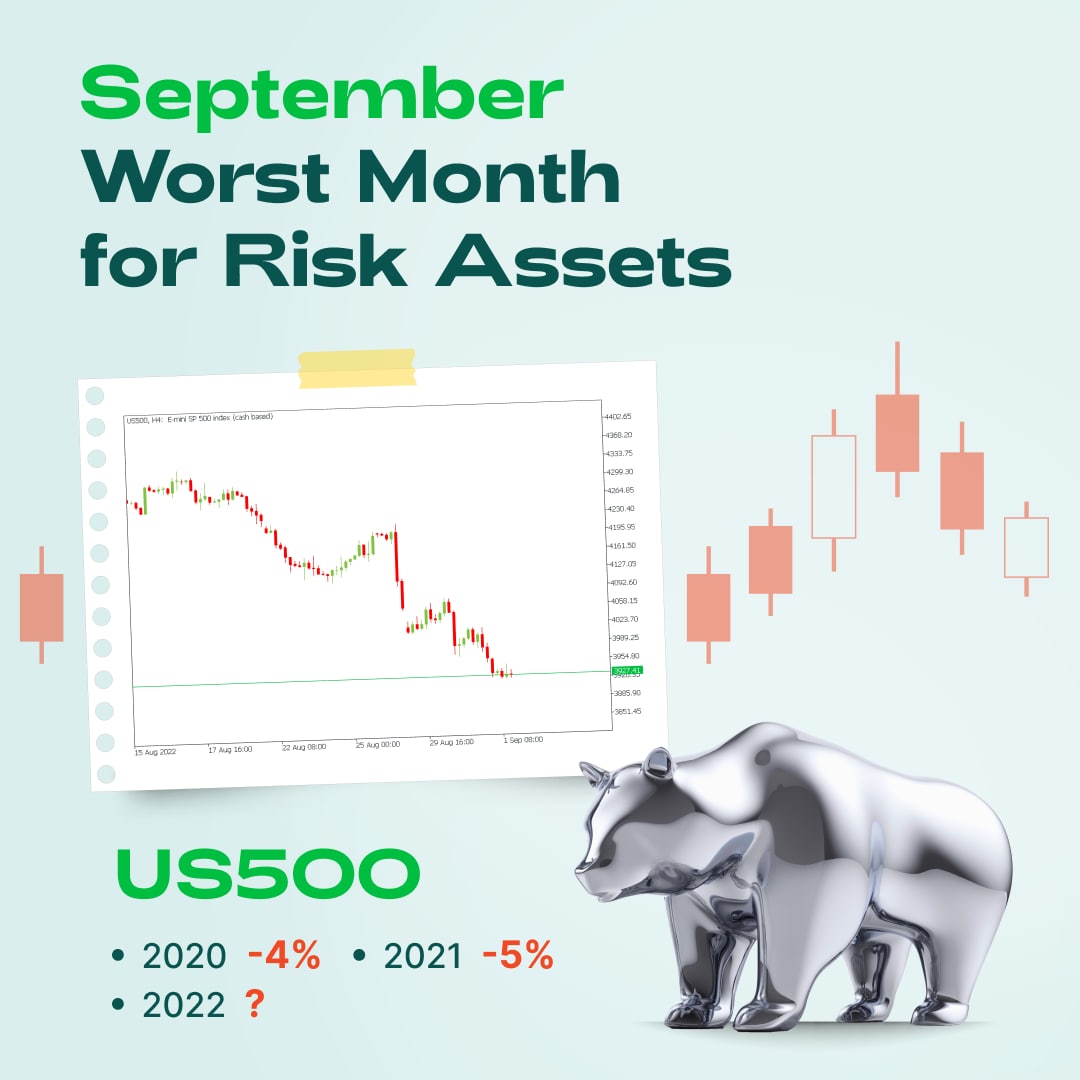
😱🔥Did you know that September is the worst month for the stocks and crypto markets?
✌️These two articles will explain why it usually happens and why this trend will repeat this month!
✅Read the articles:
Worst Awaits Risk Assets in September - https://bit.ly/3cEkVIc
Gurus Bet on Deeper Correction - https://bit.ly/3q2nFlT
😱🔥Did you know that September is the worst month for the stocks and crypto markets?
✌️These two articles will explain why it usually happens and why this trend will repeat this month!
✅Read the articles:
Worst Awaits Risk Assets in September - https://bit.ly/3cEkVIc
Gurus Bet on Deeper Correction - https://bit.ly/3q2nFlT
❤23👍10👏2
⭐️ The last day of the week will hopefully bring us volatility to trade on. Don’t forget that we will be live on YouTube at 15:15 GMT+3 to stream the US NFP release. As for me, gold is about to find its bottom, and September will be a fantastic month for XAUUSD bulls. But you will hear about that on the stream. And now, you can read the most important news of the day.
🇨🇳 The Chinese Yuan is set to close the third weekly candle in red against the dollar amid another huge lockdown on the mainland. Bank of China tries to fix the USDCNH rate but without success.
💹 Bad employment data in the US may lead to a more aggressive Fed despite the damage to households and businesses. The main target for the Federal Reserve is to stop price growth and stabilize the economy.
🛢 Pipeline operator data suggests Nord Stream flows to be back on Saturday as planned. The gas price in Europe is falling to $2200 per metric ton.
💸 The Crypto market is in extreme fear ahead of the NFP release. Total cryptocurrency market capitalization has been below the critical $1 trillion for more than a week.
💻 NVIDIA and AMD suffer due to the US limiting certain exports to China. Some of Nvidia’s business may be permanently impaired.
🤑 Imagine you have found a $100 bill. What STOCK would you buy (only stocks)?
🇨🇳 The Chinese Yuan is set to close the third weekly candle in red against the dollar amid another huge lockdown on the mainland. Bank of China tries to fix the USDCNH rate but without success.
💹 Bad employment data in the US may lead to a more aggressive Fed despite the damage to households and businesses. The main target for the Federal Reserve is to stop price growth and stabilize the economy.
🛢 Pipeline operator data suggests Nord Stream flows to be back on Saturday as planned. The gas price in Europe is falling to $2200 per metric ton.
💸 The Crypto market is in extreme fear ahead of the NFP release. Total cryptocurrency market capitalization has been below the critical $1 trillion for more than a week.
💻 NVIDIA and AMD suffer due to the US limiting certain exports to China. Some of Nvidia’s business may be permanently impaired.
🤑 Imagine you have found a $100 bill. What STOCK would you buy (only stocks)?

👍23🏆11❤4🤩3🔥1👏1
🥇#XAUUSD
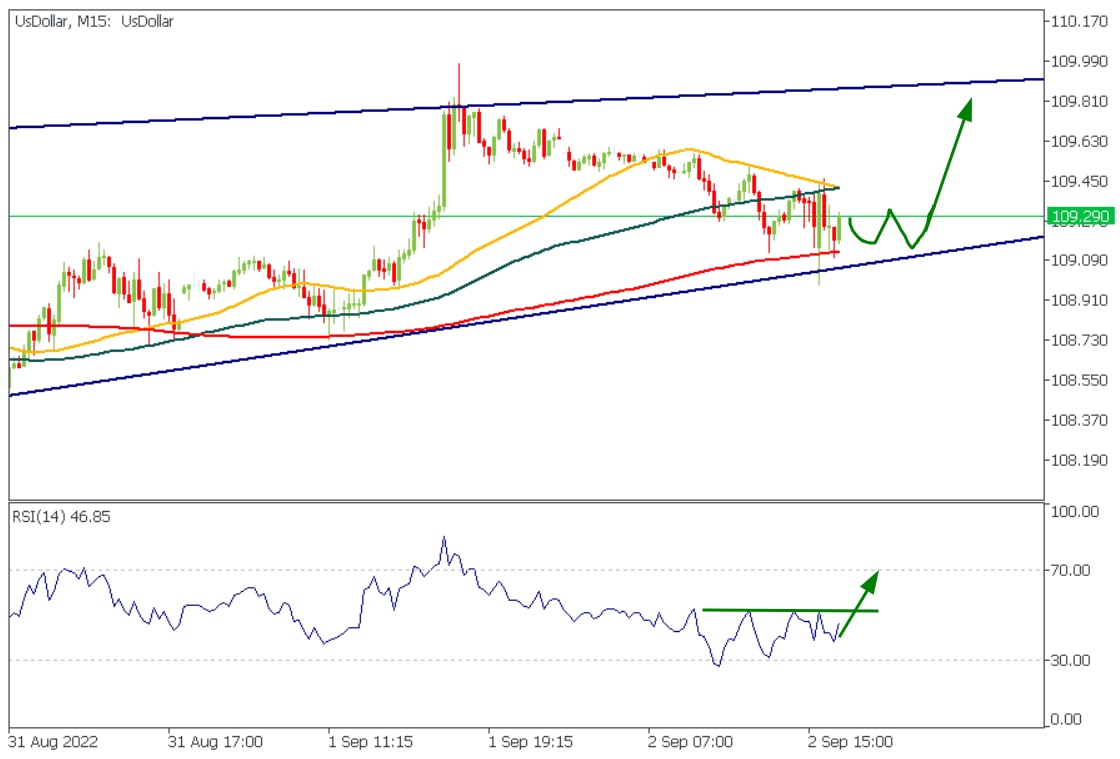
🔥Gold update!
The price is trading between two ranges.
Resistance range: 1714.00 - 1716.50
Support range: 1704.80 - 1707.50
You might use the 100-hour and 50-hour moving averages as a support and resistance levels during this consolidation as well!
After the breakout:
✅If the price breaks through the upper block + the 100-hour MA, consider buying with the target at 1730.
🟥If the price breaks through the lower block + the 50-hour MA, consider selling with the target at 1690.
💚 START TRADING 💚
🔥Gold update!
The price is trading between two ranges.
Resistance range: 1714.00 - 1716.50
Support range: 1704.80 - 1707.50
You might use the 100-hour and 50-hour moving averages as a support and resistance levels during this consolidation as well!
After the breakout:
✅If the price breaks through the upper block + the 100-hour MA, consider buying with the target at 1730.
🟥If the price breaks through the lower block + the 50-hour MA, consider selling with the target at 1690.
💚 START TRADING 💚

👍39❤13🔥1
Traders vs. FBS analysts
😱🔥Dear FBS traders! Let's compete!
🤔Are your a great markets analysts? Do you love spending hours analyzing charts and looking for patterns?
💫 Then this competition is definitely for you!
Let's pretend you have $100. You need to choose five assets that will GROW the most over the upcoming week (September 5 - September 11) and invest your imaginary money in equal shares!
Our FBS analysts team will also pick five different assets, and on Monday, September 12, we will compare the results!
❗️Please, write five assets in the comments!
❗️Example: XAUUSD, EURUSD, XNGUSD, TESLA, BTCUSD
We will also post the results of your vote on Monday🎉
👋Good luck!
😱🔥Dear FBS traders! Let's compete!
🤔Are your a great markets analysts? Do you love spending hours analyzing charts and looking for patterns?
💫 Then this competition is definitely for you!
Let's pretend you have $100. You need to choose five assets that will GROW the most over the upcoming week (September 5 - September 11) and invest your imaginary money in equal shares!
Our FBS analysts team will also pick five different assets, and on Monday, September 12, we will compare the results!
❗️Please, write five assets in the comments!
❗️Example: XAUUSD, EURUSD, XNGUSD, TESLA, BTCUSD
We will also post the results of your vote on Monday🎉
👋Good luck!

👍70🔥19🥰8🎉5😁1
🔥💥We hope it was a successful week for all of you!
🤞Let's share your results, technical setups & trade ideas for the upcoming week in the comments!
More big wins are coming! Stay with us and have a great weekend!
🤞Let's share your results, technical setups & trade ideas for the upcoming week in the comments!
More big wins are coming! Stay with us and have a great weekend!
🔥49👍20🙏4🥰2
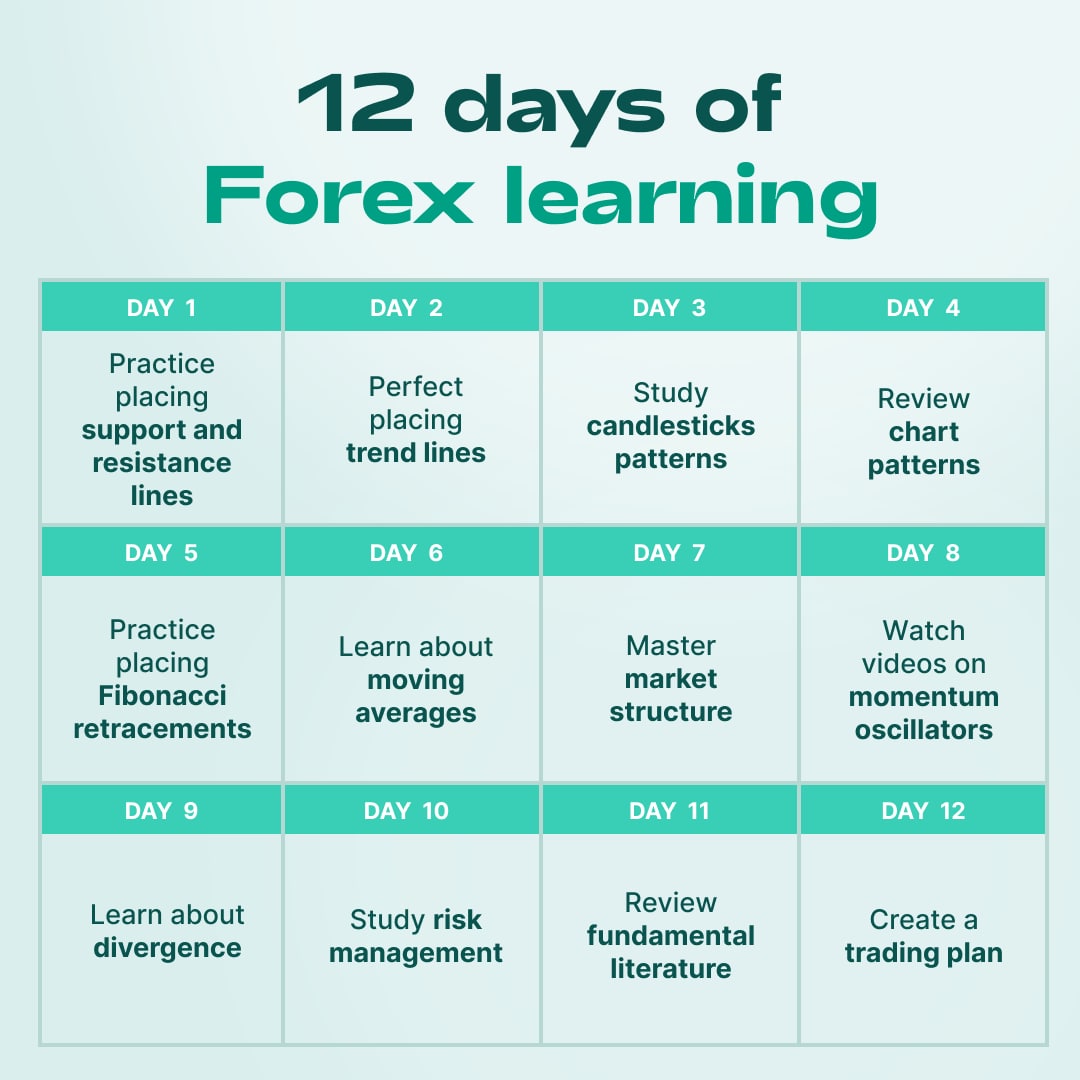
12 days of Forex learning
Learning step by step is always good idea! Let’s see how you can make your learning plan and study Forex trading fun and easy! Read the information about every aspect one a day and it may lead you to the deeper Forex trading understanding!👍
1️⃣Practice placing support and resistance lines
2️⃣Perfect placing trend lines
3️⃣Study candlesticks patterns
4️⃣Review chart patterns
5️⃣Practice placing Fibonacci retracements
6️⃣Learn about Moving Averages
7️⃣Master market structure
8️⃣Watch videos on Momentum oscillators
9️⃣Learn about divergence
1️⃣0️⃣Study risk management
1️⃣1️⃣ Review fundamental literature
1️⃣2️⃣Create a trading plan
Learning to trade step by step can really help you to study effectively. Good luck in your beginnings!💫
Learning step by step is always good idea! Let’s see how you can make your learning plan and study Forex trading fun and easy! Read the information about every aspect one a day and it may lead you to the deeper Forex trading understanding!👍
1️⃣Practice placing support and resistance lines
2️⃣Perfect placing trend lines
3️⃣Study candlesticks patterns
4️⃣Review chart patterns
5️⃣Practice placing Fibonacci retracements
6️⃣Learn about Moving Averages
7️⃣Master market structure
8️⃣Watch videos on Momentum oscillators
9️⃣Learn about divergence
1️⃣0️⃣Study risk management
1️⃣1️⃣ Review fundamental literature
1️⃣2️⃣Create a trading plan
Learning to trade step by step can really help you to study effectively. Good luck in your beginnings!💫
👍119❤49🔥27❤🔥15🥰8👏6😁4👎1
👋Hi, traders! We hope you have a great weekend!
Tomorrow starts a new trading week, which will be highly volatile due to
the RBA Rate Statement on Tuesday, the BOC rate statement on Wednesday, and the ECB press conference on Thursday!
We've looked through all instruments available to trade with FBS and made the final choice!
🔥FBS analysts' pick:
💸Currency pairs - NZDJPY, USDBRL
🤞Indices - HK50
📈Stocks - Siemens AG (#SIE) and Volkswagen AG (#VOW)
✅We will publish your voting results tomorrow!
Tomorrow starts a new trading week, which will be highly volatile due to
the RBA Rate Statement on Tuesday, the BOC rate statement on Wednesday, and the ECB press conference on Thursday!
We've looked through all instruments available to trade with FBS and made the final choice!
🔥FBS analysts' pick:
💸Currency pairs - NZDJPY, USDBRL
🤞Indices - HK50
📈Stocks - Siemens AG (#SIE) and Volkswagen AG (#VOW)
✅We will publish your voting results tomorrow!
🔥53👍14❤13👏3😱2
FBS Analytics
👋Hi, traders! We hope you have a great weekend! Tomorrow starts a new trading week, which will be highly volatile due to the RBA Rate Statement on Tuesday, the BOC rate statement on Wednesday, and the ECB press conference on Thursday! We've looked through…
🔥According to the vote, our highly respected traders have chosen the following assets:
🥇XAUUSD - 66 votes
🇪🇺🇺🇸EURUSD - 35 votes
🇬🇧🇺🇸GBPUSD - 26 votes
🇺🇸🇯🇵USDJPY - 17 votes
🇬🇧🇯🇵GBPJPY - 17 votes
😱 It Looks like traders expect the USD and JPY to weaken this week. Great choice!
🔥FBS analysts' pick:
💸Currency pairs - NZDJPY, USDBRL
🤞Indices - HK50
📈Stocks - Siemens AG (#SIE) and Volkswagen AG (#VOW)
❤️Have the best trading week ever! We will publish the results next Monday!
🥇XAUUSD - 66 votes
🇪🇺🇺🇸EURUSD - 35 votes
🇬🇧🇺🇸GBPUSD - 26 votes
🇺🇸🇯🇵USDJPY - 17 votes
🇬🇧🇯🇵GBPJPY - 17 votes
😱 It Looks like traders expect the USD and JPY to weaken this week. Great choice!
🔥FBS analysts' pick:
💸Currency pairs - NZDJPY, USDBRL
🤞Indices - HK50
📈Stocks - Siemens AG (#SIE) and Volkswagen AG (#VOW)
❤️Have the best trading week ever! We will publish the results next Monday!
❤32👍20🔥17🏆9