
🥇#XAUUSD
🔥XAUUSD update!
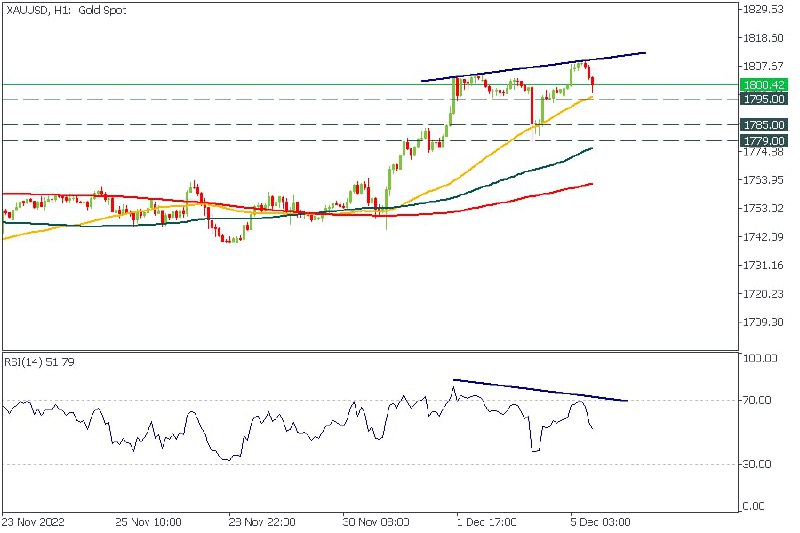
The price is declining toward the 50-hour moving average (H1 timeframe). Moreover, the RSI has formed the bearish divergence on the H1 timeframe.
Thus, consider selling gold, if the price breaks below this support. In this case, the targets will be at 1785.00 and 1779.00.
❌Trade: SELL
⭐️Entry: On the breakout below the 50-hour MA
🎯Targets: 1785.00, 1779.00
✅START TRADING ✅
🔥XAUUSD update!
The price is declining toward the 50-hour moving average (H1 timeframe). Moreover, the RSI has formed the bearish divergence on the H1 timeframe.
Thus, consider selling gold, if the price breaks below this support. In this case, the targets will be at 1785.00 and 1779.00.
❌Trade: SELL
⭐️Entry: On the breakout below the 50-hour MA
🎯Targets: 1785.00, 1779.00
✅START TRADING ✅
👍54⚡8❤8🐳4❤🔥3
#WeeklyReview
👀These week’s events that traders are keen on are Australian and Canadian Interest Rate updates and the US PPI. These releases will show how the countries cope with record-high inflation. Besides, oil is in the spotlight, as OPEC+ decided to leave the same conditions for oil production.
🇪🇺🇺🇸EURUSD. The pair started the week positively. The price has risen recently and got above the moving averages. Now it can correct to 1.0400. A reversal is unlikely, but some steps back and correction are possible.
🟡Gold. Gold is continuing its long-term consolidation between 1800 and 1626. Now it’s closer to the resistance level, and this week it’s likely to drop to 1765.
🛢Oil. XBRUSD is moving between 89.00 and 85.50. After the OPEC meeting at the weekend, the price opened with a small gap. This week the price might continue to go between two of these crucial levels. In case of a resistance level breakout, the price will head to 91.00. In case of dropping, the price might reach 82.50.
🇯🇵USDJPY. The Japanese currency has recovered from the greenback’s pressure. Now USDJPY is in a downtrend with a target of 132.00. The price is touching 200-period MA that is providing some support. In case of a reversal, the price might head to 138.
📈Indices. S&P 500 (US500) is in its uptrend, coming to the resistance trendline. The possible target is 4310 now. In case of a reversal, the price may drop to 3700.
What are you going to trade this week? Share in the comments!
Take advantage of the movements of these assets with FBS ➡️https://bit.ly/3Xj6Tyj
👀These week’s events that traders are keen on are Australian and Canadian Interest Rate updates and the US PPI. These releases will show how the countries cope with record-high inflation. Besides, oil is in the spotlight, as OPEC+ decided to leave the same conditions for oil production.
🇪🇺🇺🇸EURUSD. The pair started the week positively. The price has risen recently and got above the moving averages. Now it can correct to 1.0400. A reversal is unlikely, but some steps back and correction are possible.
🟡Gold. Gold is continuing its long-term consolidation between 1800 and 1626. Now it’s closer to the resistance level, and this week it’s likely to drop to 1765.
🛢Oil. XBRUSD is moving between 89.00 and 85.50. After the OPEC meeting at the weekend, the price opened with a small gap. This week the price might continue to go between two of these crucial levels. In case of a resistance level breakout, the price will head to 91.00. In case of dropping, the price might reach 82.50.
🇯🇵USDJPY. The Japanese currency has recovered from the greenback’s pressure. Now USDJPY is in a downtrend with a target of 132.00. The price is touching 200-period MA that is providing some support. In case of a reversal, the price might head to 138.
📈Indices. S&P 500 (US500) is in its uptrend, coming to the resistance trendline. The possible target is 4310 now. In case of a reversal, the price may drop to 3700.
What are you going to trade this week? Share in the comments!
Take advantage of the movements of these assets with FBS ➡️https://bit.ly/3Xj6Tyj
❤14👍12🔥3⚡2🍓2
What type of crypto trading platforms do you trust?
Anonymous Poll
25%
Decentralized crypto exchange platforms (DEX)
10%
Centralized crypto exchange platforms (CEX)
35%
Forex-based crypto trading platforms
9%
I trust all of them
22%
I don't trust any of them
👍12❤6
#Oil #Russia #sanctions
🇪🇺The Group of Seven price ceiling on Russian seaborne oil came into force on Monday as the West tried to limit Moscow's ability to finance its war in Ukraine. However, Russia, the world's second-largest oil exporter, said it would not accept the cap, even if it had to cut production.
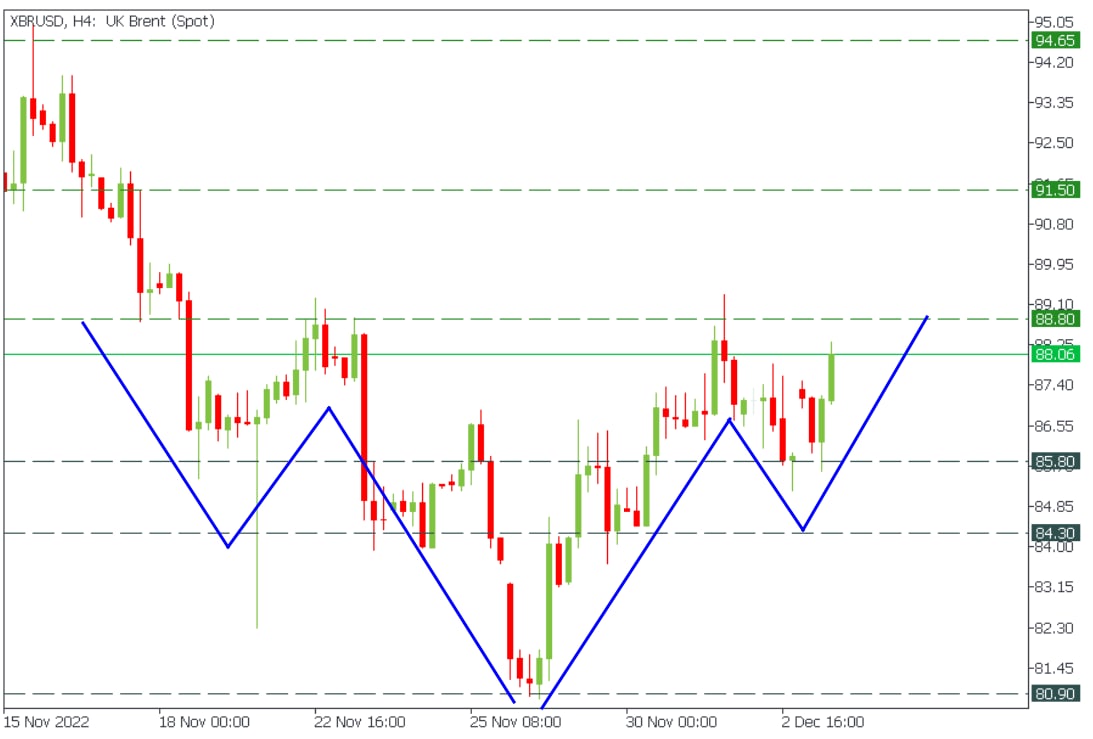
It is massively bullish news for the XBRUSD, which has formed an inverted head and shoulders pattern.
🕊If the price breaks above the neckline (88.80 resistance level), it might reach 91.50 and 94.65.
🟢Trade: BUY
⭐️Entry: On the breakout above the 88.80 resistance
🎯Targets: 91.50, 94.65
🤔Are you trading XBRUSD?
✅START TRADING ✅
🇪🇺The Group of Seven price ceiling on Russian seaborne oil came into force on Monday as the West tried to limit Moscow's ability to finance its war in Ukraine. However, Russia, the world's second-largest oil exporter, said it would not accept the cap, even if it had to cut production.
It is massively bullish news for the XBRUSD, which has formed an inverted head and shoulders pattern.
🕊If the price breaks above the neckline (88.80 resistance level), it might reach 91.50 and 94.65.
🟢Trade: BUY
⭐️Entry: On the breakout above the 88.80 resistance
🎯Targets: 91.50, 94.65
🤔Are you trading XBRUSD?
✅START TRADING ✅
👍28🔥4🐳3👎1🌭1
🇺🇸🇨🇦#USDCAD
🔥USDCAD looks bullish!
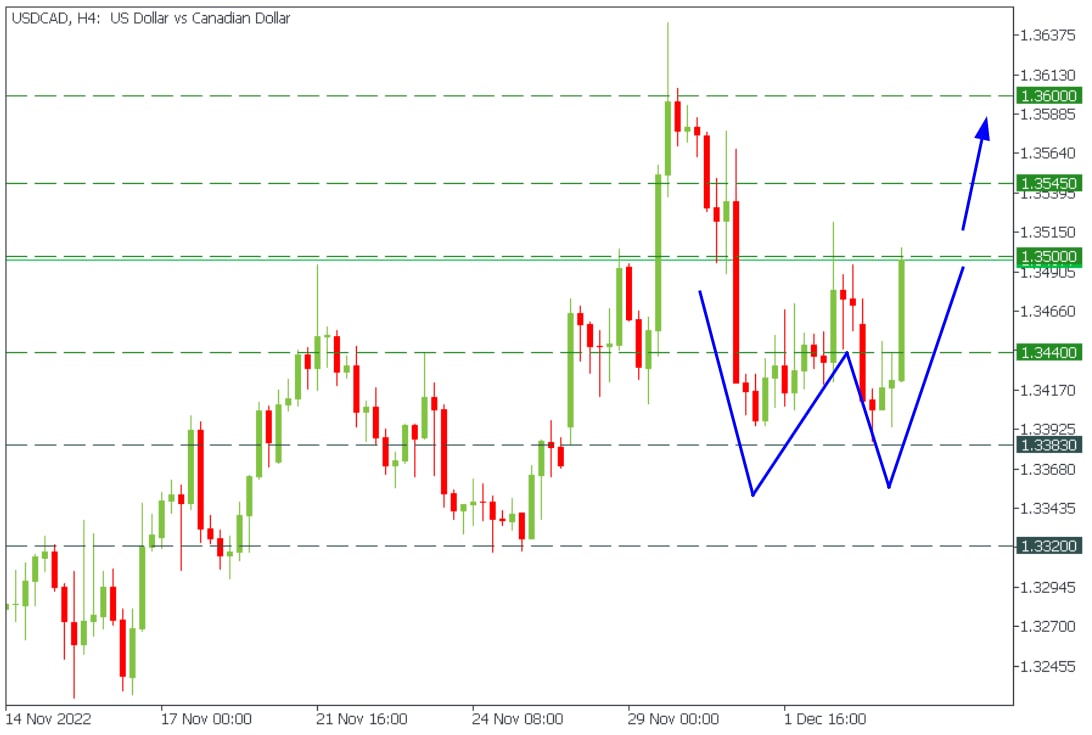
The price has formed a double bottom pattern with the targets at 1.3545 and 1.3600.
🤔What are you trading right now?
✅START TRADING ✅
🔥USDCAD looks bullish!
The price has formed a double bottom pattern with the targets at 1.3545 and 1.3600.
🤔What are you trading right now?
✅START TRADING ✅
👍33❤🔥4🥰2🐳2🍌2🔥1
🥇#XAUUSD
🔥XAUUSD daily update!
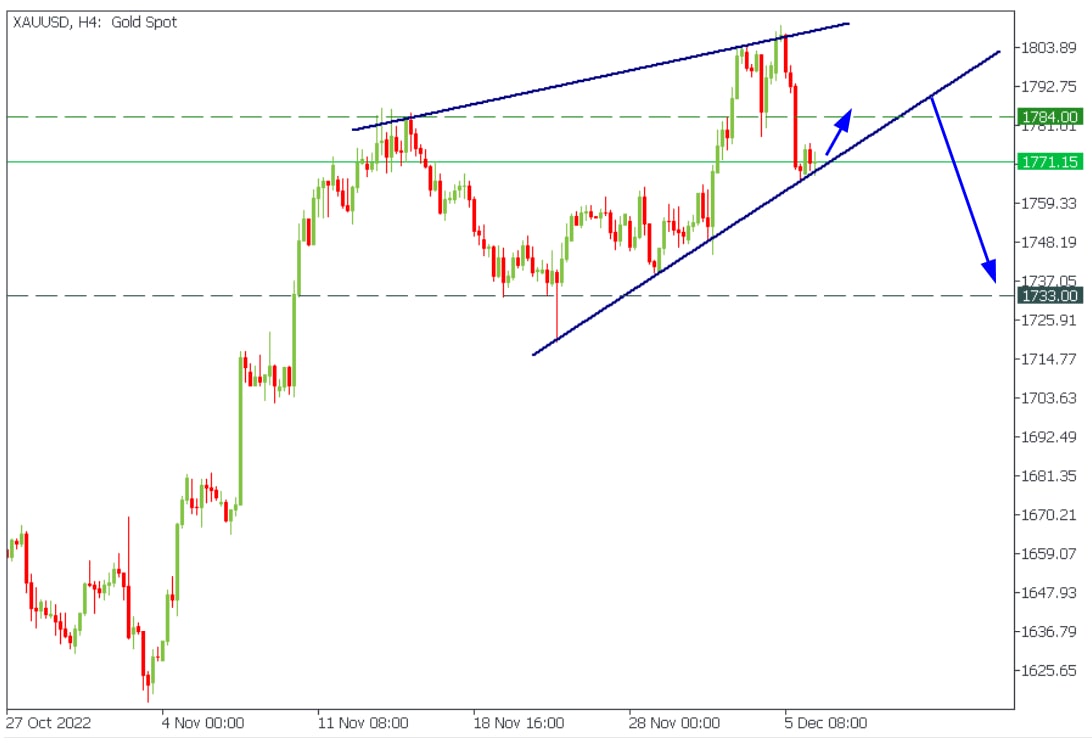
Gold has formed a bearish rising wedge. However, the price is currently consolidating above the lower wedge's border. Thus, in the short term, XAUUSD might reach 1784.00.
We expect the price to break the support trend line in the middle term and drop to 1733.00.
🟢Short-term trade (More risk): BUY
📈Entry: Market
🎯Target: 1784
🟥Middle-term trade: SELL
📈Entry: after a breakout of the wedge's lower border
🎯Target: 1733.00
What do you think about XAUUSD?
✅START TRADING ✅
🔥XAUUSD daily update!
Gold has formed a bearish rising wedge. However, the price is currently consolidating above the lower wedge's border. Thus, in the short term, XAUUSD might reach 1784.00.
We expect the price to break the support trend line in the middle term and drop to 1733.00.
🟢Short-term trade (More risk): BUY
📈Entry: Market
🎯Target: 1784
🟥Middle-term trade: SELL
📈Entry: after a breakout of the wedge's lower border
🎯Target: 1733.00
What do you think about XAUUSD?
✅START TRADING ✅
👍35❤🔥7🔥6👌5🐳3❤2👎2🍓1
#MarketNews
💫Happy Tuesday, dear traders! Every day brings new opportunities to trade! Let’s see what you need to know:
📌Today’s events:
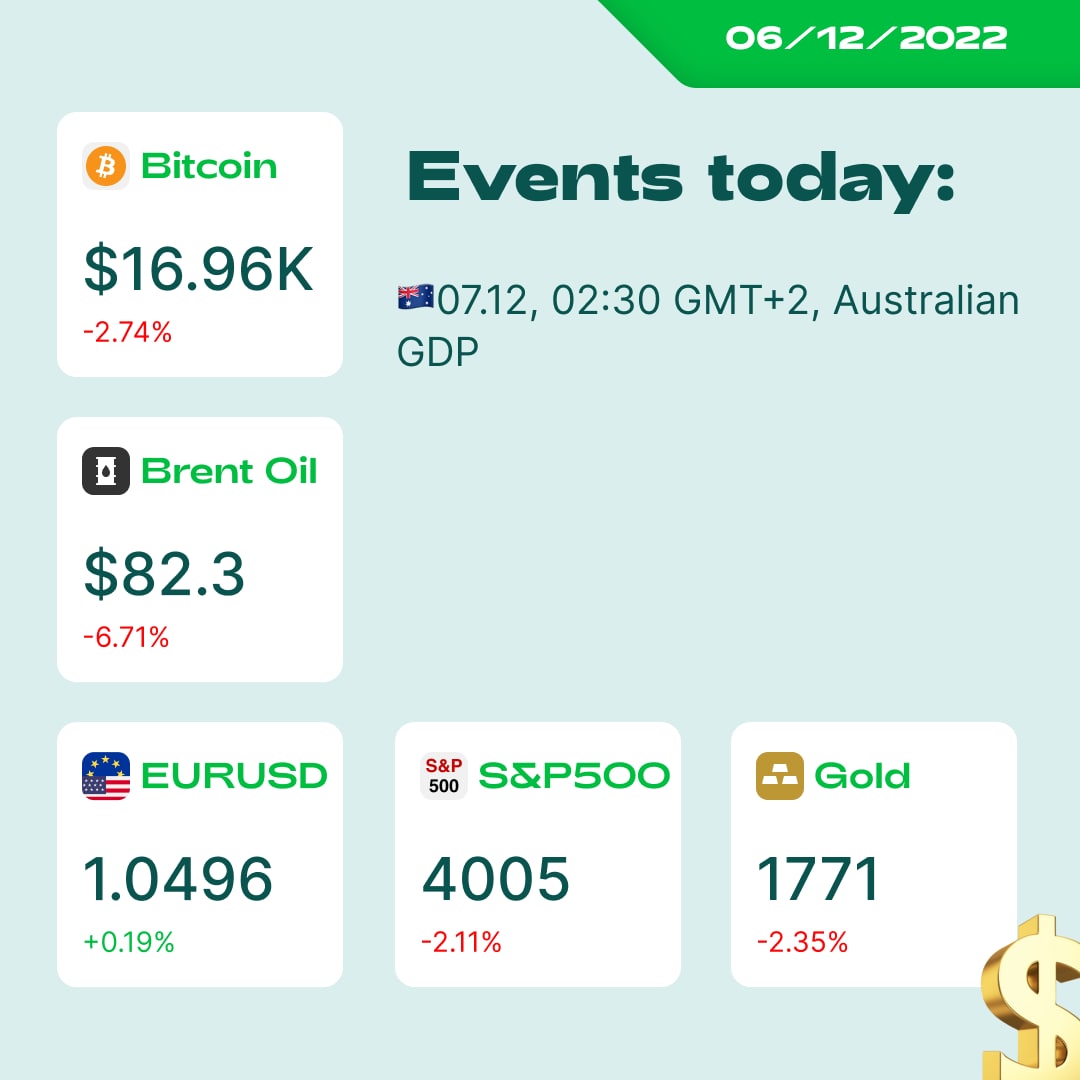
07.12, 02:30 GMT+2, Australian GDP
🚗Tesla's stock price fell on reports that the Shanghai plant may cut production.
🛢Nearly 20 oil tankers are stuck off the coast of Turkey due to a Russian oil price limit. XRBUSD is 82.30.
🇦🇺The Reserve Bank of Australia raised its key rate to a ten-year high. Now it’s 2.10%.
📉Contracts for the S&P 500 gained 0.2% after the third day of the S&P 500 decline.
🇨🇳Beijing has announced that it will remove Covid testing requirements for most public places, seen as an accelerated step towards exiting the Covid Zero policy.
☢️Prices for bitcoin and other cryptocurrencies are falling along with other riskier assets amid fears about the US economy uncertainties.
➡️Read the full report here: http://bit.ly/3Y1EJYP
Stay tuned with FBS! Have a great day!
💫Happy Tuesday, dear traders! Every day brings new opportunities to trade! Let’s see what you need to know:
📌Today’s events:
07.12, 02:30 GMT+2, Australian GDP
🚗Tesla's stock price fell on reports that the Shanghai plant may cut production.
🛢Nearly 20 oil tankers are stuck off the coast of Turkey due to a Russian oil price limit. XRBUSD is 82.30.
🇦🇺The Reserve Bank of Australia raised its key rate to a ten-year high. Now it’s 2.10%.
📉Contracts for the S&P 500 gained 0.2% after the third day of the S&P 500 decline.
🇨🇳Beijing has announced that it will remove Covid testing requirements for most public places, seen as an accelerated step towards exiting the Covid Zero policy.
☢️Prices for bitcoin and other cryptocurrencies are falling along with other riskier assets amid fears about the US economy uncertainties.
➡️Read the full report here: http://bit.ly/3Y1EJYP
Stay tuned with FBS! Have a great day!
👍17🔥7🕊2🐳2👏1
🇺🇸#US100
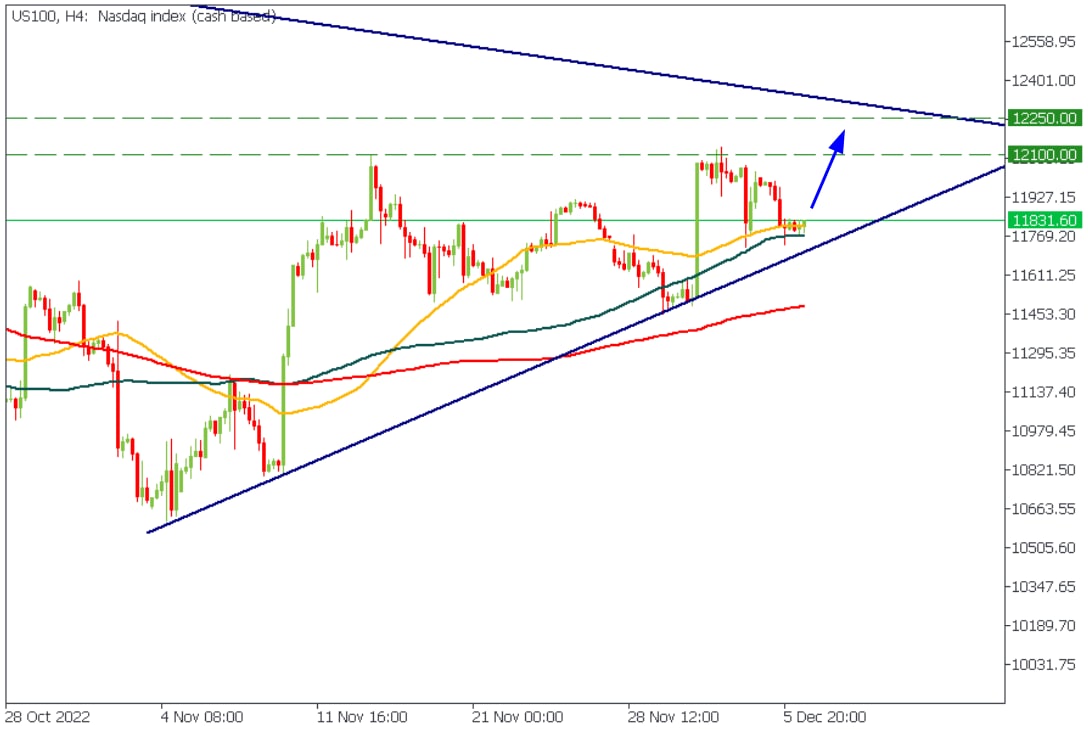
🔥US100 looks bullish!
US100 is bouncing off the cross point of the 50- and 100-period moving averages. Consider buying the index here.
🎯Targets: 12 100, 12 250
✅START TRADING ✅
🔥US100 looks bullish!
US100 is bouncing off the cross point of the 50- and 100-period moving averages. Consider buying the index here.
🎯Targets: 12 100, 12 250
✅START TRADING ✅
🔥17👍7❤🔥3😢1
🇦🇺🇺🇸#AUDUSD
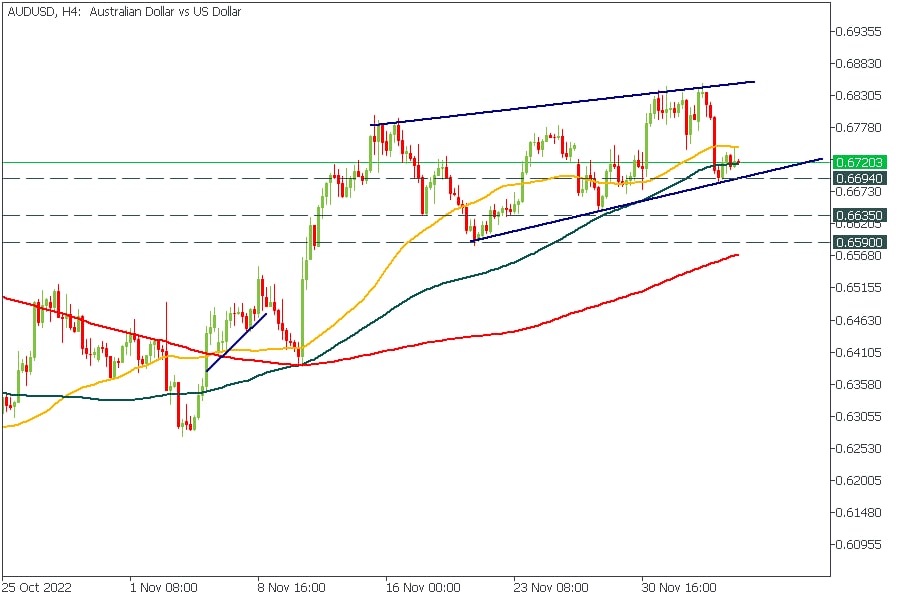
🔥AUDUSD looks bearish!
AUDUSD has formed a rising bearish wedge pattern. Thus, you might sell the pair on the breakout of the wedge's support line.
🟥Trade: SELL
📈Entry: on the breakout of the wedge's lower border
🎯Targets: 0.6635, 0.6590
✅START TRADING ✅
🔥AUDUSD looks bearish!
AUDUSD has formed a rising bearish wedge pattern. Thus, you might sell the pair on the breakout of the wedge's support line.
🟥Trade: SELL
📈Entry: on the breakout of the wedge's lower border
🎯Targets: 0.6635, 0.6590
✅START TRADING ✅
👍30🔥9❤3👎1
🌺THANK YOU, GUYS🌺
We were really touched by your answers to this survey! It was exciting to read, and all your answers were thoughtful and engaging.
We chose the most interesting of them here!
Thank you very much for your answers! ❤️
Stay tuned with FBS and wait for more content from our team!👍🏻
We were really touched by your answers to this survey! It was exciting to read, and all your answers were thoughtful and engaging.
We chose the most interesting of them here!
Thank you very much for your answers! ❤️
Stay tuned with FBS and wait for more content from our team!👍🏻

❤61👍19❤🔥12🔥10🤩2🍌2💩1
🇪🇺🇺🇸#EURUSD
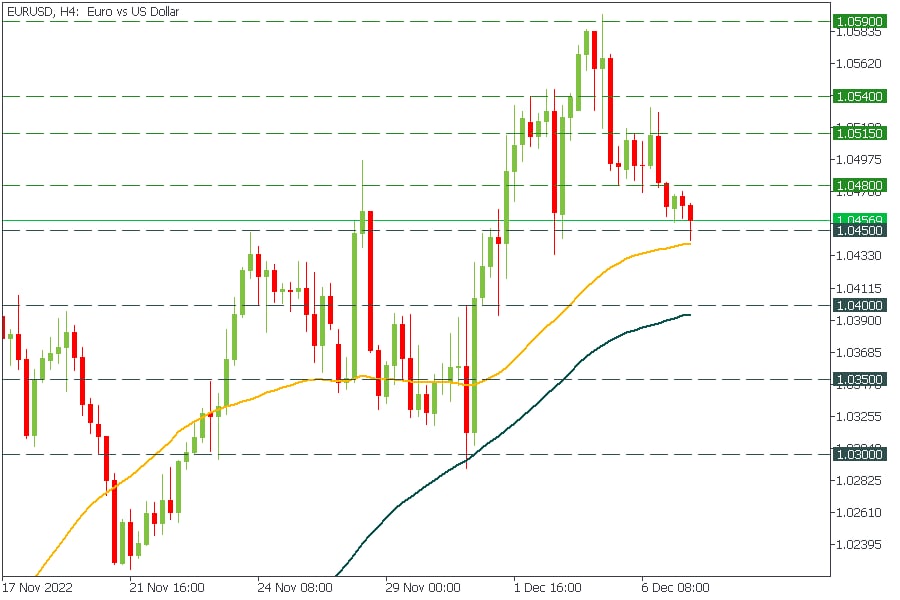
🔥EURUSD looks bullish!
EURUSD reached a massive support level of 1.0450, where the 50-period moving average goes through. Thus, we expect a reverse to 1.0480, 1.0515 and 1.0540.
❗️However, if the price breaks through the support, it will move to 1.0400.
Are you buying EURUSD right now?
✅START TRADING ✅
🔥EURUSD looks bullish!
EURUSD reached a massive support level of 1.0450, where the 50-period moving average goes through. Thus, we expect a reverse to 1.0480, 1.0515 and 1.0540.
❗️However, if the price breaks through the support, it will move to 1.0400.
Are you buying EURUSD right now?
✅START TRADING ✅
👍21❤4💩4🔥3⚡2❤🔥1🌭1
FBS Analytics
🥇#XAUUSD 🔥XAUUSD daily update! Gold has formed a bearish rising wedge. However, the price is currently consolidating above the lower wedge's border. Thus, in the short term, XAUUSD might reach 1784.00. We expect the price to break the support trend line…
🥇#XAUUSD
🔥XAUUSD daily update!
Buyers are still holding gold above the support trend line of the rising wedge. Thus, you might open a BUY trade with the targets at 1780 and 1784.
❗️Moreover, if the price breaks above these levels, gold might skyrocket to 1803.
❗️However, if the price loses the support trend line, we will be selling gold to 1760 support.
✅START TRADING ✅
🔥XAUUSD daily update!
Buyers are still holding gold above the support trend line of the rising wedge. Thus, you might open a BUY trade with the targets at 1780 and 1784.
❗️Moreover, if the price breaks above these levels, gold might skyrocket to 1803.
❗️However, if the price loses the support trend line, we will be selling gold to 1760 support.
✅START TRADING ✅
👍52❤8🔥7🐳4🍌3🍓1
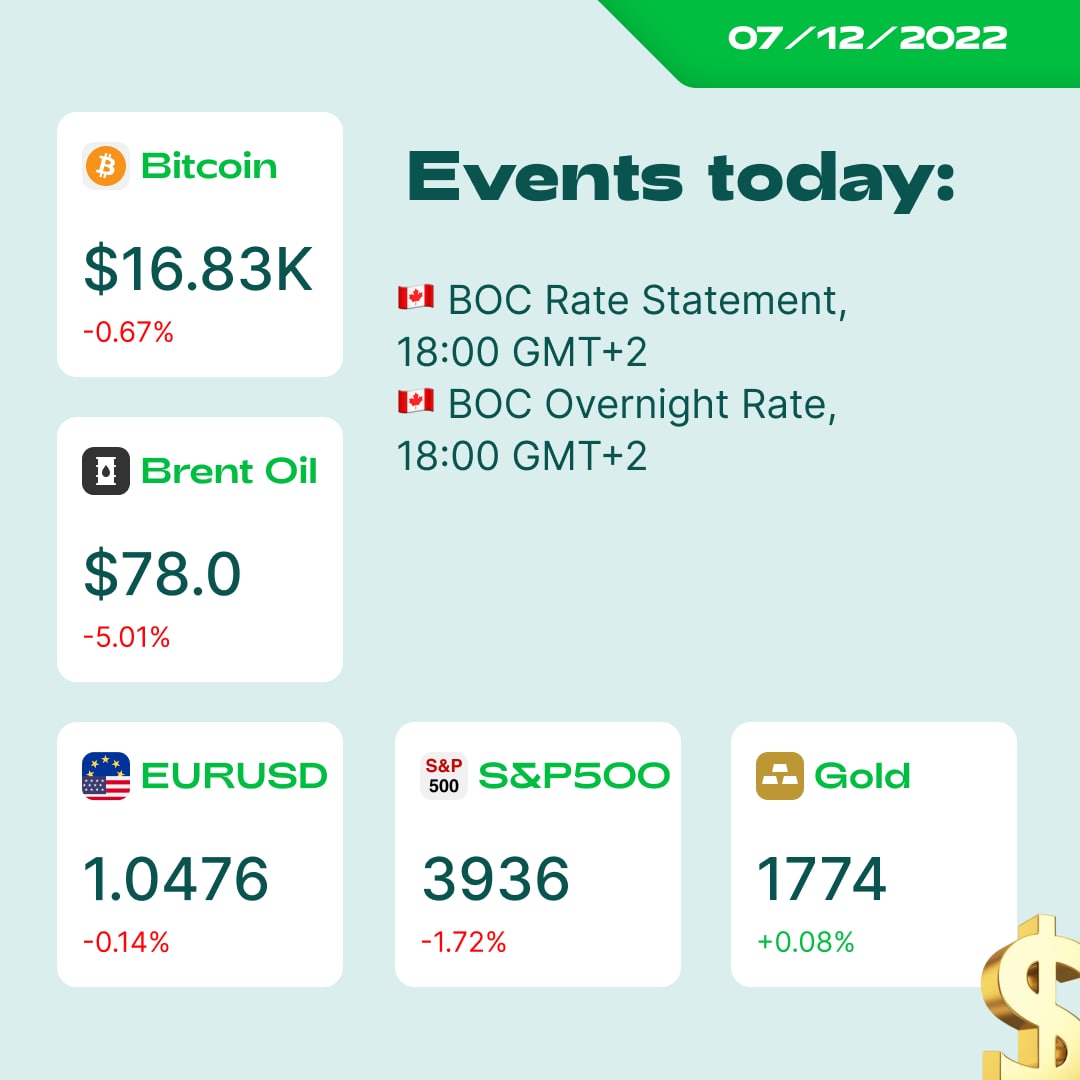
#MarketNews
🌤 It’s Wednesday, my fellow traders! The day is filled with news and events you need to know, and here’re some of them.
🇦🇺 Australian quarterly GDP turned out to be lower than expected (0.6% actual vs. 0.7% forecast).
🏘 The US housing market collapsed by 30% year-on-year, which makes this correction the harshest since 2008. The monthly drop of -2.3% in Great Britain is the largest seen since October 2008, too.
🎮 Microsoft and Nintendo agreed to a 10-year deal to bring Call of Duty to Nintendo gaming platforms. However, the agreement depends on Microsoft closing its $69 billion acquisition of Activision Blizzard.
💸 Binance exchange entered the Japanese market again after it was forced to leave a year ago.
Catch the latest trade idea on the link:
➡️ https://bit.ly/3HhEZxa
🌤 It’s Wednesday, my fellow traders! The day is filled with news and events you need to know, and here’re some of them.
🇦🇺 Australian quarterly GDP turned out to be lower than expected (0.6% actual vs. 0.7% forecast).
🏘 The US housing market collapsed by 30% year-on-year, which makes this correction the harshest since 2008. The monthly drop of -2.3% in Great Britain is the largest seen since October 2008, too.
🎮 Microsoft and Nintendo agreed to a 10-year deal to bring Call of Duty to Nintendo gaming platforms. However, the agreement depends on Microsoft closing its $69 billion acquisition of Activision Blizzard.
💸 Binance exchange entered the Japanese market again after it was forced to leave a year ago.
Catch the latest trade idea on the link:
➡️ https://bit.ly/3HhEZxa
👍28🔥7❤🔥3🤔3😍2❤1🌚1
Are you ready? Give us as much reactions as you can
Please open Telegram to view this post
VIEW IN TELEGRAM
❤🔥73🔥38👍8❤7🐳5⚡4😍4🏆4👏2
Please open Telegram to view this post
VIEW IN TELEGRAM
YouTube
Why do you trade counter trend?
Download FBS Personal Area:
Worldwide https://bit.ly/36qlgeC
Indonesia https://bit.ly/3qxOQFQ
The odds of a great trade are high when you trade in the direction of a trend. So why do we even consider trading opposite the trend? Still looking for the answer…
Worldwide https://bit.ly/36qlgeC
Indonesia https://bit.ly/3qxOQFQ
The odds of a great trade are high when you trade in the direction of a trend. So why do we even consider trading opposite the trend? Still looking for the answer…
👍34❤🔥4🔥4🌚2
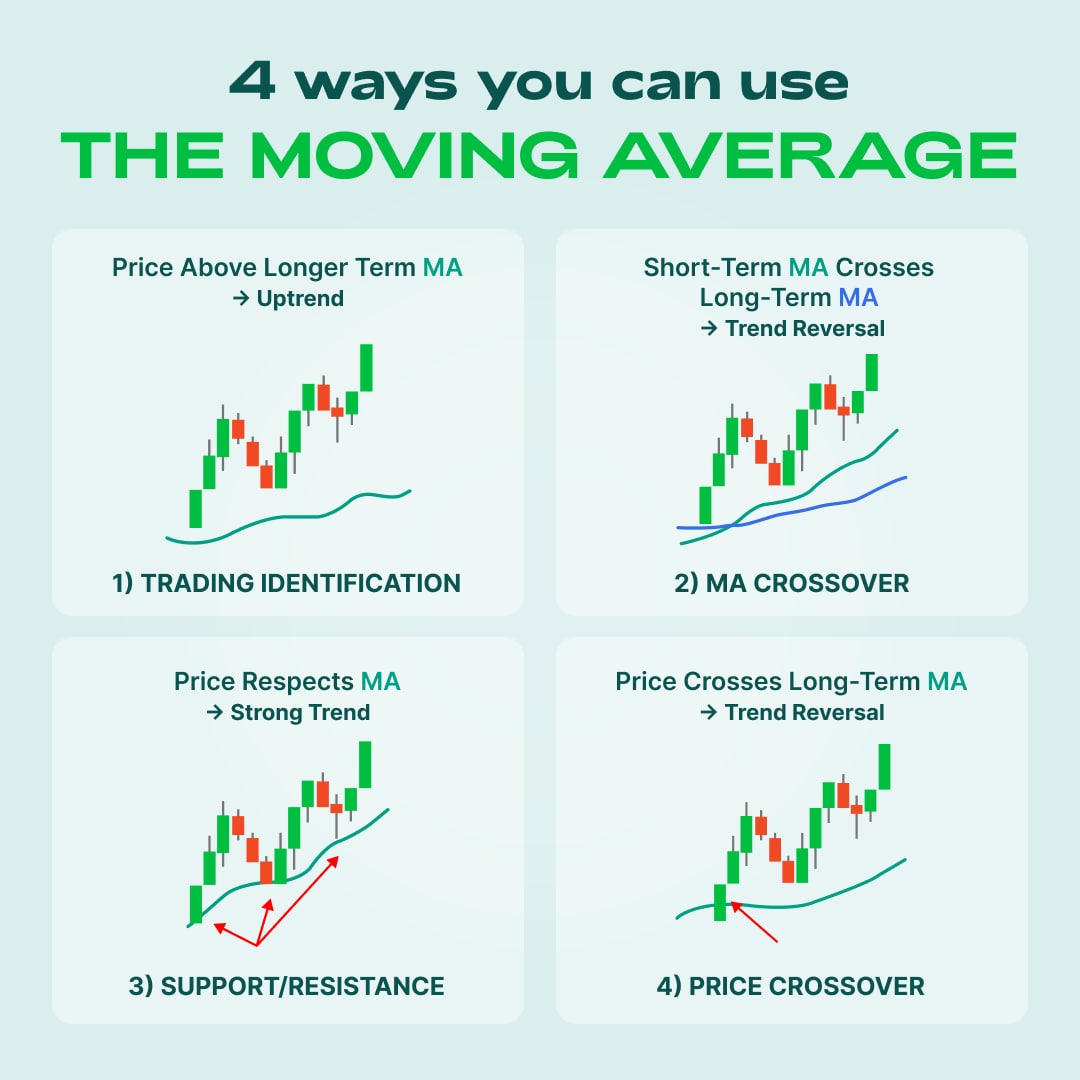
How you can use Moving Averages?👌🏻
💫Moving average is a basic tool for technical analysis, and you guys asked us to tell you more about it! How can you use it? This instrument can be used differently in several ways! Let’s see how it can help us:
1️⃣Trend identification
Use 100- and 200- period MA to identify the trend. If the price goes up and the long-period MA is under it, it’s an uptrend!
2️⃣MA Crossover
A golden cross is a great signal for the upcoming reversal. When you notice that the long-term MA crosses the shorter-term MA, that’s the signal to start trading! If this cross is below the price- it’s a buy signal, if it’s above the trend, it’s time to sell.
3️⃣Support/ Resistance
Sometimes you don’t need to draw the support and resistance line, as the MA can build them by itself! The strength of the levels depends on the MA period. The bigger the period, the stronger the support/resistance. Additionally, pay attention to the timeframe! The bigger the timeframes, the stronger the MAs will be.
4️⃣Price Crossover
MAs can cross not only each other but the price as well. When the long-term MA crosses the price, it’s an upcoming reversal sign.
Use Moving Averages in your analysis and your trading skills will definitely improve! ✨
Is everything clear? Try it out with FBS➡️https://bit.ly/2NH9X88
💫Moving average is a basic tool for technical analysis, and you guys asked us to tell you more about it! How can you use it? This instrument can be used differently in several ways! Let’s see how it can help us:
1️⃣Trend identification
Use 100- and 200- period MA to identify the trend. If the price goes up and the long-period MA is under it, it’s an uptrend!
2️⃣MA Crossover
A golden cross is a great signal for the upcoming reversal. When you notice that the long-term MA crosses the shorter-term MA, that’s the signal to start trading! If this cross is below the price- it’s a buy signal, if it’s above the trend, it’s time to sell.
3️⃣Support/ Resistance
Sometimes you don’t need to draw the support and resistance line, as the MA can build them by itself! The strength of the levels depends on the MA period. The bigger the period, the stronger the support/resistance. Additionally, pay attention to the timeframe! The bigger the timeframes, the stronger the MAs will be.
4️⃣Price Crossover
MAs can cross not only each other but the price as well. When the long-term MA crosses the price, it’s an upcoming reversal sign.
Use Moving Averages in your analysis and your trading skills will definitely improve! ✨
Is everything clear? Try it out with FBS➡️https://bit.ly/2NH9X88
👍56🔥8❤6🍌2
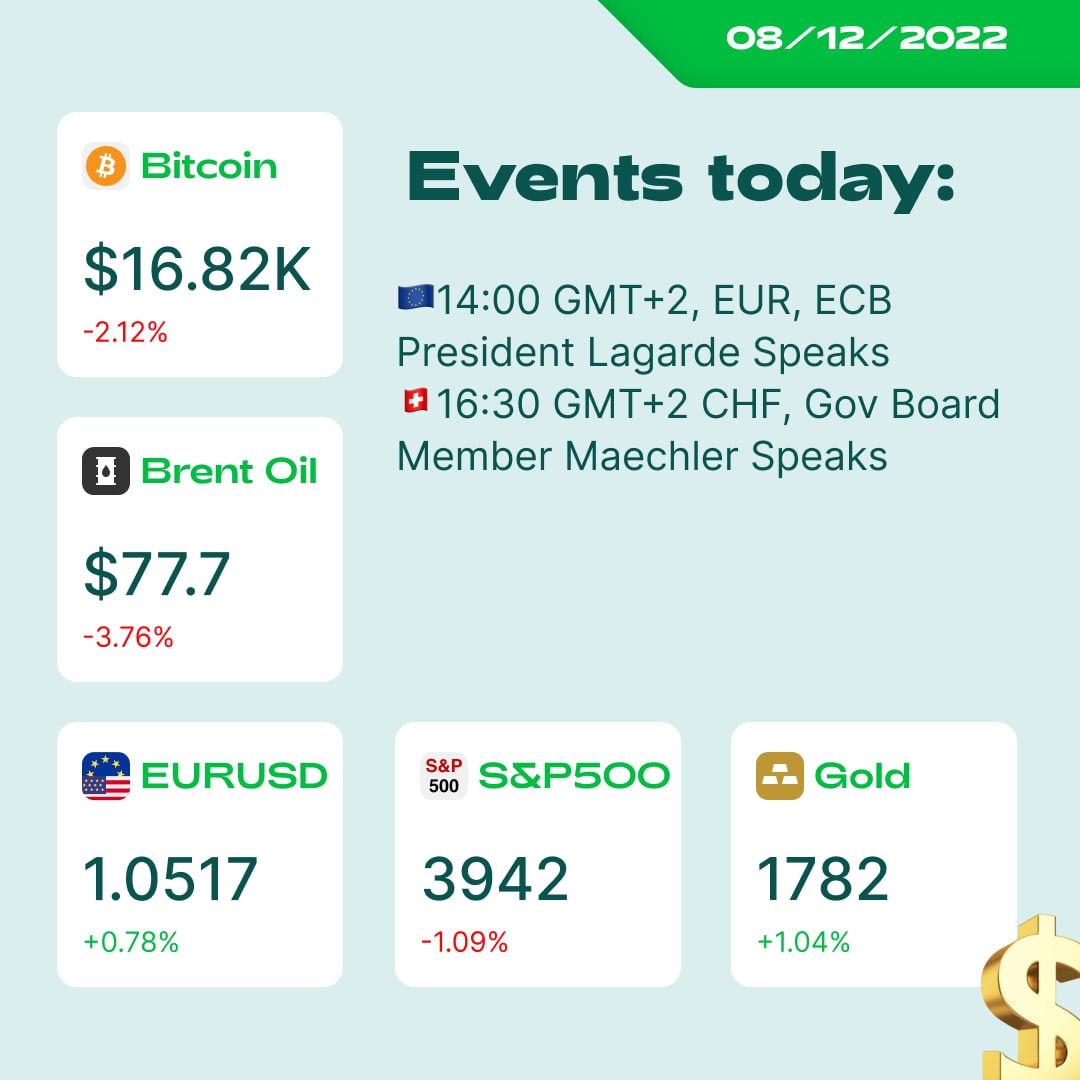
#MarketNews
Good morning, our dear traders! Are you ready for the news that is worth following for trading today? Let’s see!💫
☢️Standard Chartered, a multinational financial company, said markets could expect a further 70% fall in the price of Bitcoin.
📈Hong Kong shares rose almost 3% after reports that the city is easing anti-Covid rules.
🇪🇺EU announced ninth round of sanctions against Russia after Putin's warning that the threat of nuclear war is growing.
👥Google, Oracle, Amazon, and Microsoft have signed $9 billion cloud computing contracts with the US government.
🫱🏻🫲🏻Deutsche Bank will partner with Nvidia to bring artificial intelligence to financial services.
🇯🇵Japan posted lower than expected GDP, q/q = -0.2% vs. +1.1% expected, and y/y = -0.8% vs. +4.5% expected.
🍎WSJ reported Apple is developing a new data encryption system.
🛢Oil rose as investors weighed in on the impact of China's moves to ease the Covid Zero policy amid a looming slowdown in the US.
🟡Gold fell on weak Treasury yields as traders wait for Friday's US producer price report and the release of the US CPI next week.
Read the full report with Bitcoin analysis here: http://bit.ly/3Yj9Tvh
Have a good day, and follow daily news with FBS!💫
Good morning, our dear traders! Are you ready for the news that is worth following for trading today? Let’s see!💫
☢️Standard Chartered, a multinational financial company, said markets could expect a further 70% fall in the price of Bitcoin.
📈Hong Kong shares rose almost 3% after reports that the city is easing anti-Covid rules.
🇪🇺EU announced ninth round of sanctions against Russia after Putin's warning that the threat of nuclear war is growing.
👥Google, Oracle, Amazon, and Microsoft have signed $9 billion cloud computing contracts with the US government.
🫱🏻🫲🏻Deutsche Bank will partner with Nvidia to bring artificial intelligence to financial services.
🇯🇵Japan posted lower than expected GDP, q/q = -0.2% vs. +1.1% expected, and y/y = -0.8% vs. +4.5% expected.
🍎WSJ reported Apple is developing a new data encryption system.
🛢Oil rose as investors weighed in on the impact of China's moves to ease the Covid Zero policy amid a looming slowdown in the US.
🟡Gold fell on weak Treasury yields as traders wait for Friday's US producer price report and the release of the US CPI next week.
Read the full report with Bitcoin analysis here: http://bit.ly/3Yj9Tvh
Have a good day, and follow daily news with FBS!💫
🔥16❤9👍9🍌1
💥RJ Austria: Expert’s Q&A💥
Who doesn’t want to ask a professional trader a question? We’re sure, many of you! Today, our guest RJ Austria will answer all your questions!
RJ Austria can help you with:
🔹Advance Fibonacci
🔹Price action strategy
🔹Candlestick patterns
🔹Smart money concept
🔹Chart patterns and Advance chart patterns
🔹Trading psychology
🔹Timing of trading
🔹Advance risk management
🔹How to be profitable and stay in the market for the next 50 years.
⬇️Write all your questions below in the comments! Let’s go! ⬇️
Who doesn’t want to ask a professional trader a question? We’re sure, many of you! Today, our guest RJ Austria will answer all your questions!
RJ Austria can help you with:
🔹Advance Fibonacci
🔹Price action strategy
🔹Candlestick patterns
🔹Smart money concept
🔹Chart patterns and Advance chart patterns
🔹Trading psychology
🔹Timing of trading
🔹Advance risk management
🔹How to be profitable and stay in the market for the next 50 years.
⬇️Write all your questions below in the comments! Let’s go! ⬇️

🔥21❤12👍11🤩2🏆2⚡1🌚1
#AUDCAD
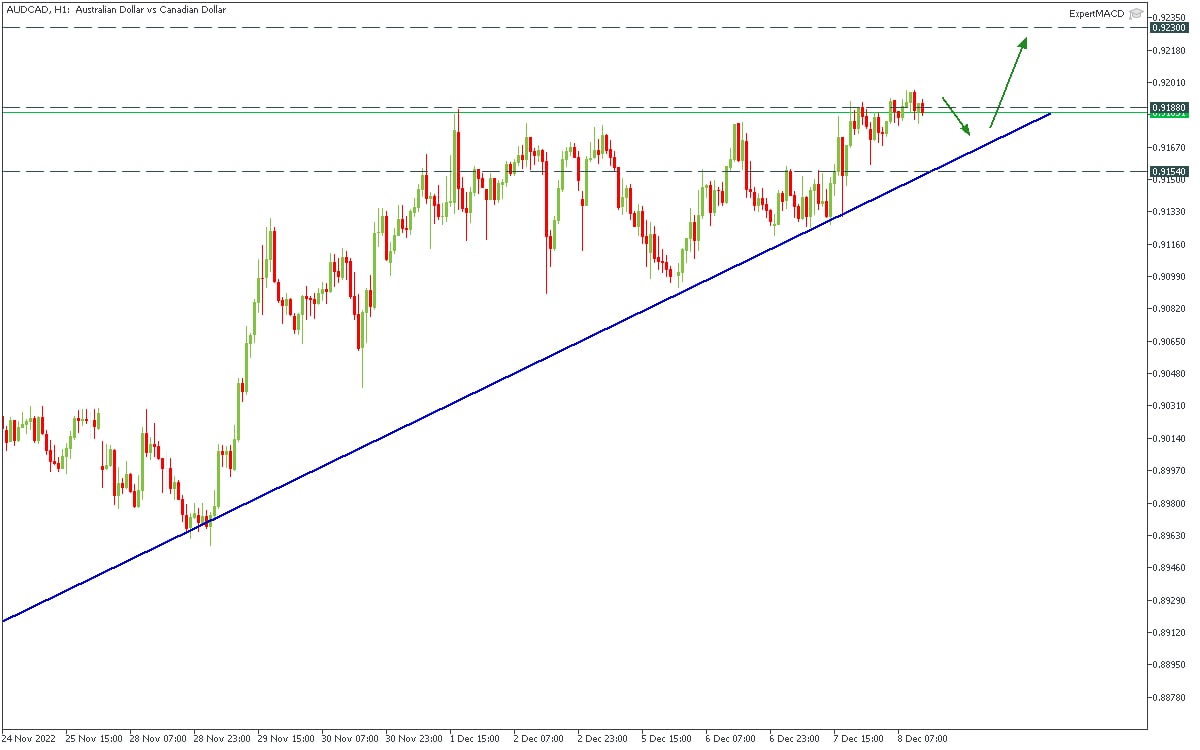
🤡 The forex market is tricky and makes fake breakouts all the time. In the figure below, AUDCAD made a fake breakout of the ascending triangle.
📉 The pair is going to decline to touch the trendline one more time before further growth.
📈 Thus, you can open a Buy trade on the touch of the blue line and aim for the bullish wave. Take Profits are 0.9180 and 0.9230. Stop Loss 0.9154
✅START TRADING ✅
Tell us what do you think in the comments!
🤡 The forex market is tricky and makes fake breakouts all the time. In the figure below, AUDCAD made a fake breakout of the ascending triangle.
📉 The pair is going to decline to touch the trendline one more time before further growth.
📈 Thus, you can open a Buy trade on the touch of the blue line and aim for the bullish wave. Take Profits are 0.9180 and 0.9230. Stop Loss 0.9154
✅START TRADING ✅
Tell us what do you think in the comments!
👍28⚡9👎3🔥3🌭2