
#US500
🤑 While Fed chair Jerome Powell assures markets in stability of the US financial system, the chart doesn't think this way
📊 We have seen two times in recent history when the index failed to went above the 200-daily MA. Both cases resulted in 7-18% decline
📈The chart has it all, what do you think? Buy or Sell? 📉
➡️ START TRADING
🤑 While Fed chair Jerome Powell assures markets in stability of the US financial system, the chart doesn't think this way
📊 We have seen two times in recent history when the index failed to went above the 200-daily MA. Both cases resulted in 7-18% decline
📈The chart has it all, what do you think? Buy or Sell? 📉
➡️ START TRADING

🔥14👍6❤3😍3👏2😱2🐳2❤🔥1🤪1🗿1
🇦🇺🇨🇭#AUDCHF
🔥AUDCHF looks bullish!
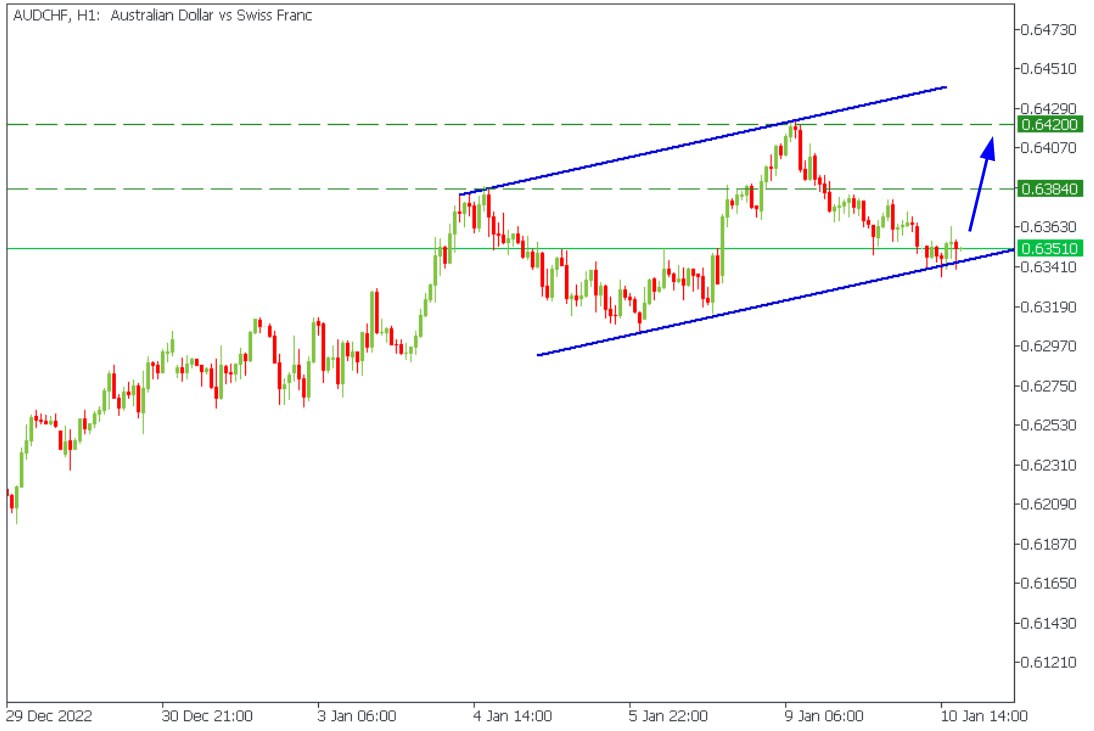
AUDCHF is bouncing of the ascending channel's lower border. Until the price stays above the support trend line, you might consider buying the pair.
🎯TP: 0.6384, 0.6420
❌SL: below the recent low
✅START TRADING ✅
🔥AUDCHF looks bullish!
AUDCHF is bouncing of the ascending channel's lower border. Until the price stays above the support trend line, you might consider buying the pair.
🎯TP: 0.6384, 0.6420
❌SL: below the recent low
✅START TRADING ✅
👍20🔥8❤7👏1🤔1
🤩 We love looking at the charts, dreaming about an amazing trade and drawing possible price action. Do you love it too?
💎 For those who do, we made a video with five great tips for chart analysis that will boost your performance.
Give us as many ❤️ reactions as you can and we will publish it right away!
💎 For those who do, we made a video with five great tips for chart analysis that will boost your performance.
Give us as many ❤️ reactions as you can and we will publish it right away!
❤142🔥17👍7🐳6🍾4❤🔥3🙈2🤪2👏1🤩1🍓1
FBS Analytics
🤩 We love looking at the charts, dreaming about an amazing trade and drawing possible price action. Do you love it too? 💎 For those who do, we made a video with five great tips for chart analysis that will boost your performance. Give us as many ❤️ reactions…
💚Thanks for your attention and support, we appreciate it. Here's the video, watch it and write in the comments, what tips did you like the most?
➡️ https://bit.ly/3ioW12q
➡️ https://bit.ly/3ioW12q
YouTube
Tips on Forex Technical Analysis
Download the FBS Personal Area:
Worldwide https://bit.ly/36qlgeC
Indonesia https://bit.ly/3qxOQFQ
Visit our website for more information: https://bit.ly/3vIzmR1
Follow us on social media:
Facebook https://bit.ly/3ELXjLm
Instagram bit.ly/3gO8lYW
Telegram…
Worldwide https://bit.ly/36qlgeC
Indonesia https://bit.ly/3qxOQFQ
Visit our website for more information: https://bit.ly/3vIzmR1
Follow us on social media:
Facebook https://bit.ly/3ELXjLm
Instagram bit.ly/3gO8lYW
Telegram…
❤24👍18❤🔥4🔥2👏2😍2🐳2👎1
FBS Analytics
🥇#XAUUSD 🔥XAUUSD might reach 1910 today! The price is consolidating under the 1880.00 resistance, 161.8 Fibonacci level. If XAUUSD breaks this resistance, it will move to the 1910.00 - 1913.00 range. ❗️Jerome Powell's speech starts in 2hours 30 minutes.…
🥇#XAUUSD
🔥 XAUUSD looks bullish!
The price has finally broken through the 1880.00 resistance level, 161.8 Fibonacci. In our opinion, the yellow metal will reach 1910.00 pretty soon.
🎯Target: 1910.00
❌SL: below 1880.00
✅ START TRADING ✅
The price has finally broken through the 1880.00 resistance level, 161.8 Fibonacci. In our opinion, the yellow metal will reach 1910.00 pretty soon.
🎯Target: 1910.00
❌SL: below 1880.00
Please open Telegram to view this post
VIEW IN TELEGRAM
❤40👍24🔥8🤪8🐳3💔3💩2🙈2🙏1🍌1🍾1
#MarketNews
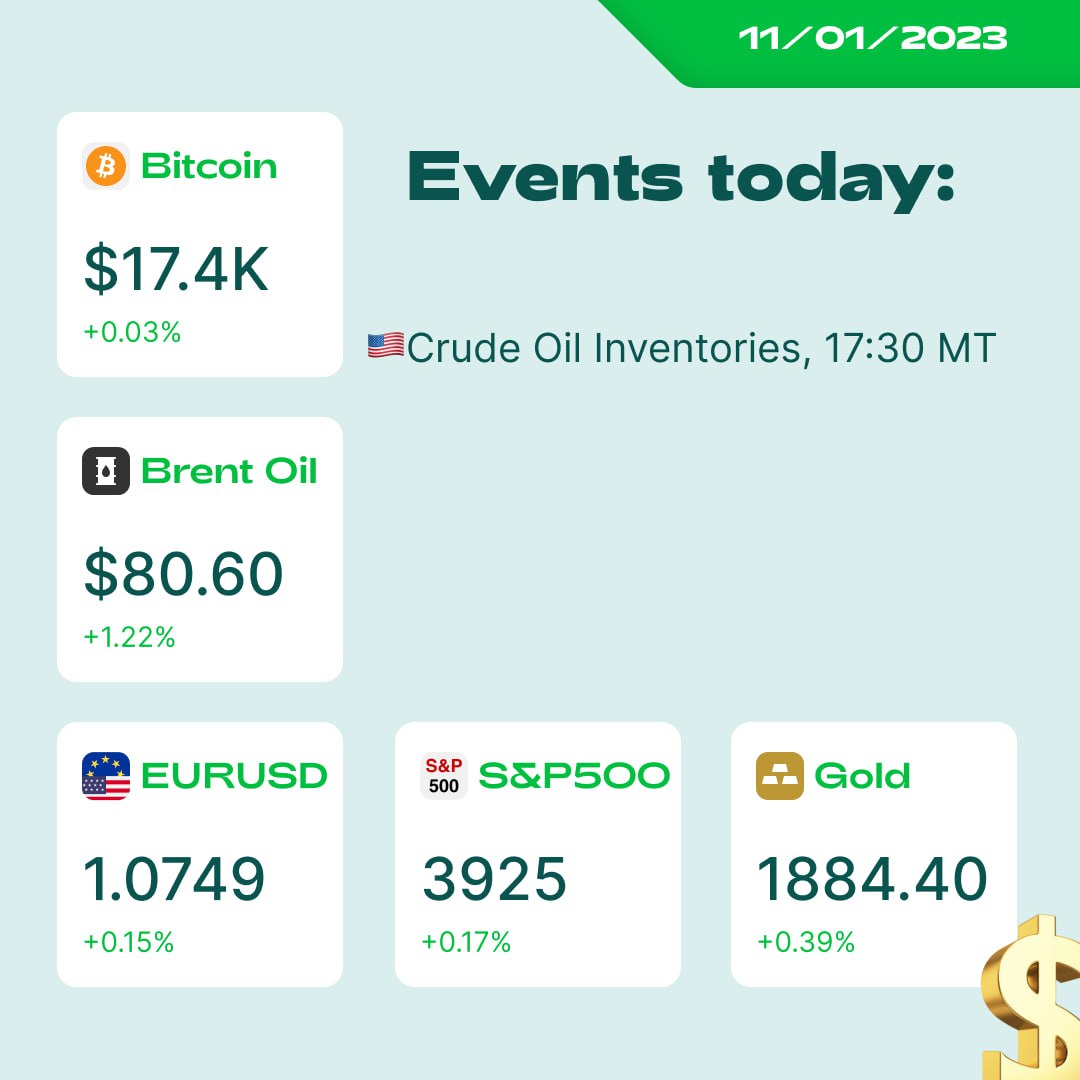
☀️ Good morning, traders! Let's check over news moving the markets right now!
📈JPMorgan believes that on January 12, US500 may rise by 1.5 - 3.5% on the CPI report if consumer inflation slows down again.
🏦The World Bank lowered its forecast for global economic growth for 2023 from 3.0% to 1.7%, anticipating worsening economic conditions in the world.
☢️🇨🇳СryptoQuant: There are signs that China is returning to the crypto market, with China's first BTC futures ETF raising $79M in debut trading. China might be the primary driver of the next bull run.
😱Some of the world's largest asset managers, such as BlackRock Inc., Fidelity Investments, and Carmignac, warn that markets are undervaluing inflation and the US top rate peak just as they did a year ago.
🇺🇸🇯🇵Japan and the United States will strengthen cooperation in dual-use technologies. Containment of China could be one of the goals of the relevant partnership. At the same time, Britain and Japan will sign a defense pact to counter the Chinese threat.
🇺🇸US dollar index has more room for decline. The major support trend line locates at 102.30.
☀️ Good morning, traders! Let's check over news moving the markets right now!
📈JPMorgan believes that on January 12, US500 may rise by 1.5 - 3.5% on the CPI report if consumer inflation slows down again.
🏦The World Bank lowered its forecast for global economic growth for 2023 from 3.0% to 1.7%, anticipating worsening economic conditions in the world.
☢️🇨🇳СryptoQuant: There are signs that China is returning to the crypto market, with China's first BTC futures ETF raising $79M in debut trading. China might be the primary driver of the next bull run.
😱Some of the world's largest asset managers, such as BlackRock Inc., Fidelity Investments, and Carmignac, warn that markets are undervaluing inflation and the US top rate peak just as they did a year ago.
🇺🇸🇯🇵Japan and the United States will strengthen cooperation in dual-use technologies. Containment of China could be one of the goals of the relevant partnership. At the same time, Britain and Japan will sign a defense pact to counter the Chinese threat.
🇺🇸US dollar index has more room for decline. The major support trend line locates at 102.30.
👍26❤🔥5🔥4❤2😍2👌1
🇪🇺🇺🇸#EURUSD
🔥EURUSD might make a huge impulse soon!
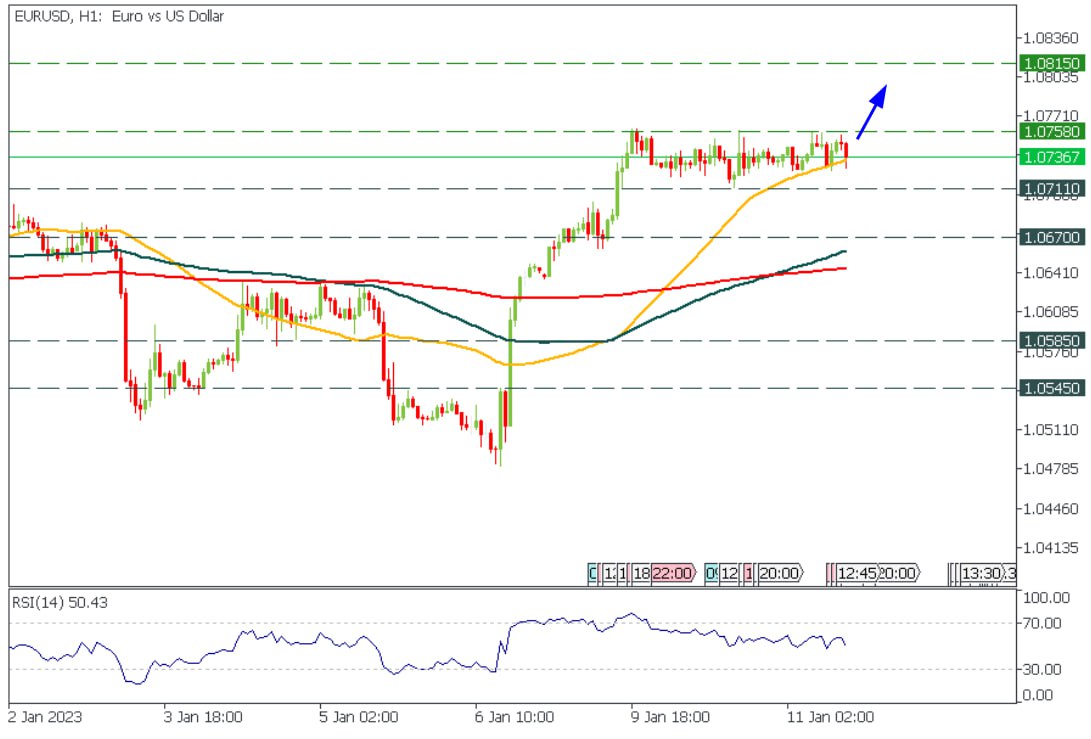
The 50-hour moving average acts as the main support for the price right now. Thus, until the H1 candle closes below this MA, you might consider buying this pair.
🎯Targets: 1.0758, 1.0815
❌SL: below the 50-hour MA
✅START TRADING ✅
🔥EURUSD might make a huge impulse soon!
The 50-hour moving average acts as the main support for the price right now. Thus, until the H1 candle closes below this MA, you might consider buying this pair.
🎯Targets: 1.0758, 1.0815
❌SL: below the 50-hour MA
✅START TRADING ✅
👍21🔥4☃2😢2🐳2❤🔥1❤1👏1
#Best_Investments
Part 1
💚 We want to educate you and help on your journey to profitable trading and investing. So we decided to prepare for you a series of posts about the greatest investments of the last 100 years.
You will be surprised how the market didn't change over decades 🙂
1️⃣9️⃣6️⃣0️⃣1960-s and Nifty Fifty
🧢 The Nifty Fifty were a group of 50 high-growth, blue-chip stocks popular among investors in the 1960s. They became known as “one-decision” stocks because investors were told that they could buy and hold them forever.
😉 However, a wise trader always knows that every asset tends to correct after a rally.
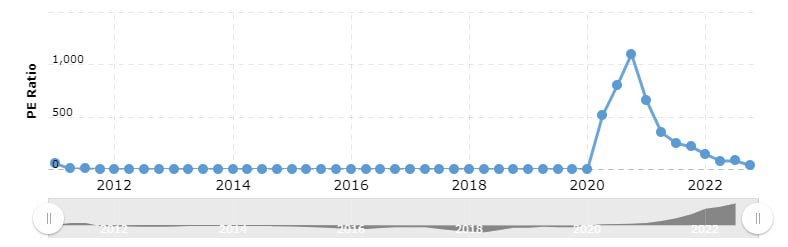
❌ The outcome of the enormous growth in “60-s blue chips” was higher than the usual P/E ratio. This ratio shows a relation between the current market value of the company and its earnings.
🚀 If the P/E ratio is too high, like Tesla had at the beginning of 2021 (1102), then investors surely overpriced the company. Compared with this, a neutral P/E in the tech industry is usually 25-30. (in the figure)
Show us your support if you want more posts like this, hit a ❤️ reaction
Part 1
💚 We want to educate you and help on your journey to profitable trading and investing. So we decided to prepare for you a series of posts about the greatest investments of the last 100 years.
You will be surprised how the market didn't change over decades 🙂
1️⃣9️⃣6️⃣0️⃣1960-s and Nifty Fifty
🧢 The Nifty Fifty were a group of 50 high-growth, blue-chip stocks popular among investors in the 1960s. They became known as “one-decision” stocks because investors were told that they could buy and hold them forever.
😉 However, a wise trader always knows that every asset tends to correct after a rally.
❌ The outcome of the enormous growth in “60-s blue chips” was higher than the usual P/E ratio. This ratio shows a relation between the current market value of the company and its earnings.
🚀 If the P/E ratio is too high, like Tesla had at the beginning of 2021 (1102), then investors surely overpriced the company. Compared with this, a neutral P/E in the tech industry is usually 25-30. (in the figure)
Show us your support if you want more posts like this, hit a ❤️ reaction
❤98👍19🔥8🥱5🤝4🐳3😈3🥰2❤🔥1
🇺🇸🇨🇦#USDCAD
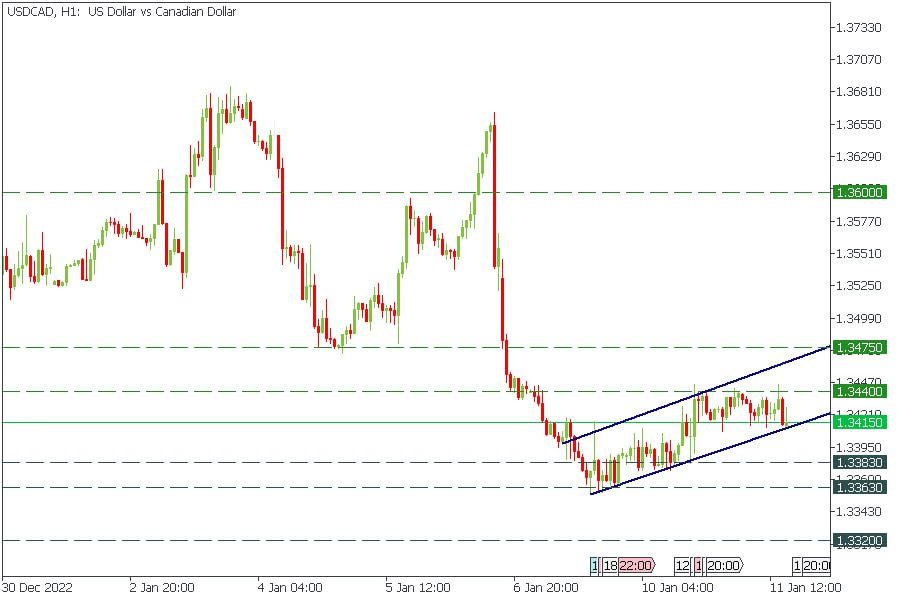
🔥USDCAD might drop soon!
The price is moving inside the ascending bearish channel (flag) ⛳️. Consider selling USDCAD as soon as the price breaks through the support trend line.
🎯Targets: 1.3383, 1.3363
✅START TRADING ✅
🔥USDCAD might drop soon!
The price is moving inside the ascending bearish channel (flag) ⛳️. Consider selling USDCAD as soon as the price breaks through the support trend line.
🎯Targets: 1.3383, 1.3363
✅START TRADING ✅
👍22❤5🔥4💔3❤🔥2🎄1
🇺🇸#USDollarIndex
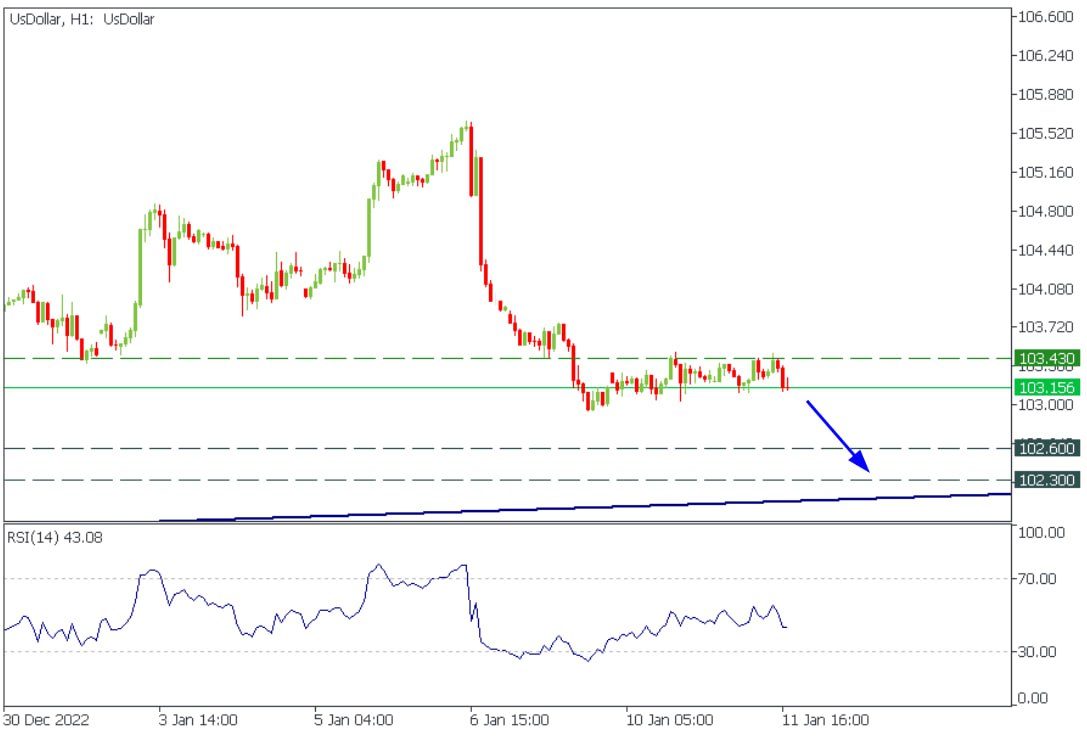
🔥US dollar index looks bearish!
The index broke under the resistance level of 103.42 and retested it from below. Moreover, the RSI is rounding toward the level of 30.00. Usually, this pattern leads to a price decline.
❗️Thus, we suggest you sell USD against other currencies.
Do you agree?
✅START TRADING ✅
🔥US dollar index looks bearish!
The index broke under the resistance level of 103.42 and retested it from below. Moreover, the RSI is rounding toward the level of 30.00. Usually, this pattern leads to a price decline.
❗️Thus, we suggest you sell USD against other currencies.
Do you agree?
✅START TRADING ✅
👍28❤6🤮5🔥3🍾3❤🔥1👏1🍓1
#Correlation
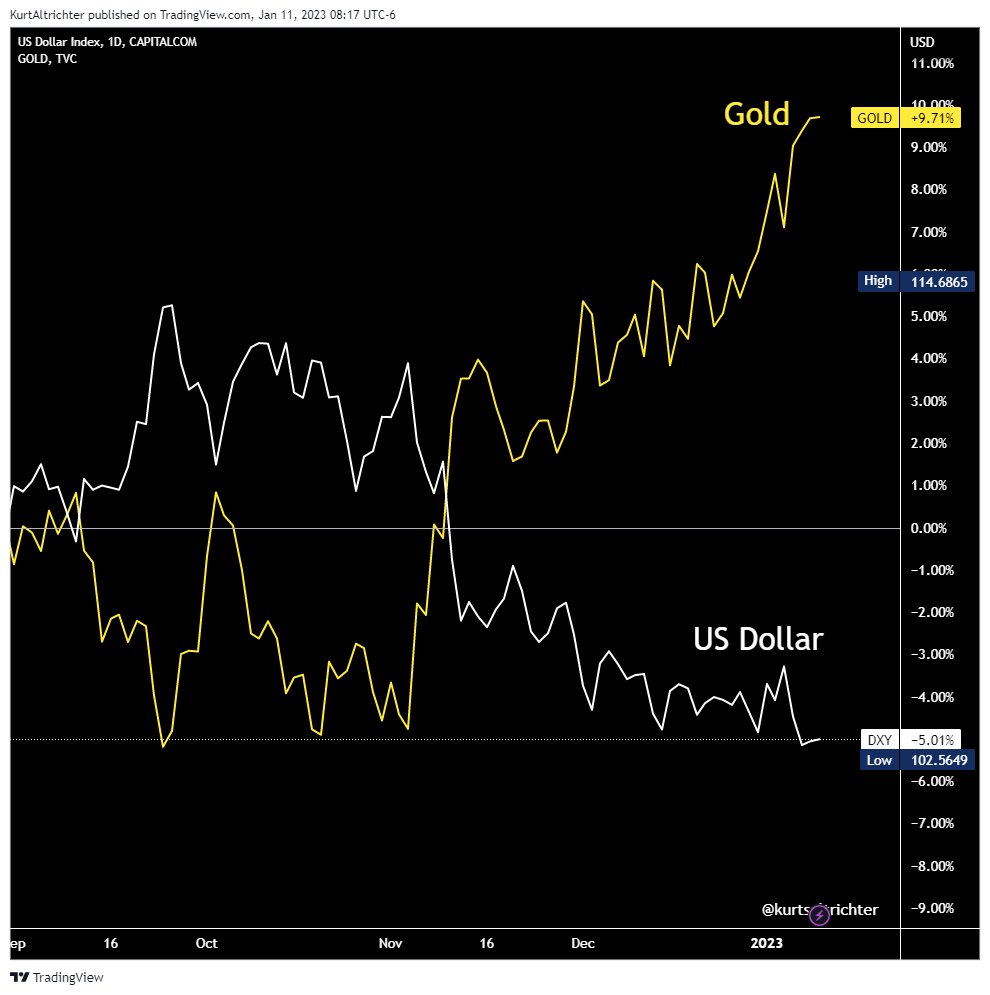
😉Do you still wonder why you should analyze the US dollar index chart before trading gold?
Check how 🥇XAUUSD and the 🇺🇸US dollar index have been moving since September 2022.
😈What will happen with the USD after the CPI release?
😉Do you still wonder why you should analyze the US dollar index chart before trading gold?
Check how 🥇XAUUSD and the 🇺🇸US dollar index have been moving since September 2022.
😈What will happen with the USD after the CPI release?
🔥44👍32❤12🍾10❤🔥8😁5🤪5🥱4🍌4😱3🤡1
👋 Hi traders! Did you see our video with tips for chart analysis? Go check it out here: ➡️ https://bit.ly/3ioW12q
And now to the news!
💹 10-year bond auction in the US showed a decline in bond yield from 3.63 to 3.58. EURUSD went up 200 points. Overall, the pair is near the critical resistance of 1.0780. Give this post ❤️ reactions if you want a signal on EURUSD.
📊 The release of the US CPI will be out today at 15:30 GMT+2. Traders should be careful as volatility will be intense. Higher than-expected numbers will send the USD to the moon and gold down. Press 🔥 reaction if you want a signal for gold.
🇯🇵 USDJPY is near the 131.30 support level. The breakout may send the pair to the next support of 129.60.
🇨🇳 Consumer prices in China rose 1.8% y/y. USDCNH has been down 4000 points since the start of the week.
💸 Bitcoin skyrocketed 6.3% over the last day and reached the last resistance line of 18 300. High CPI numbers will press on the crypto market.
🏦 Fed member Collins backs up a smaller rate hike, likely a negative scenario for the USD.
🛢 The oil market is bullish, with the main gauge, XBRUSD, up 4.8%.
💭 What are you trading today? Good luck to you!
And now to the news!
💹 10-year bond auction in the US showed a decline in bond yield from 3.63 to 3.58. EURUSD went up 200 points. Overall, the pair is near the critical resistance of 1.0780. Give this post ❤️ reactions if you want a signal on EURUSD.
📊 The release of the US CPI will be out today at 15:30 GMT+2. Traders should be careful as volatility will be intense. Higher than-expected numbers will send the USD to the moon and gold down. Press 🔥 reaction if you want a signal for gold.
🇯🇵 USDJPY is near the 131.30 support level. The breakout may send the pair to the next support of 129.60.
🇨🇳 Consumer prices in China rose 1.8% y/y. USDCNH has been down 4000 points since the start of the week.
💸 Bitcoin skyrocketed 6.3% over the last day and reached the last resistance line of 18 300. High CPI numbers will press on the crypto market.
🏦 Fed member Collins backs up a smaller rate hike, likely a negative scenario for the USD.
🛢 The oil market is bullish, with the main gauge, XBRUSD, up 4.8%.
💭 What are you trading today? Good luck to you!

🔥94❤31👍20❤🔥6😍4🐳2😈2🍌1🤗1
#XAUUSD
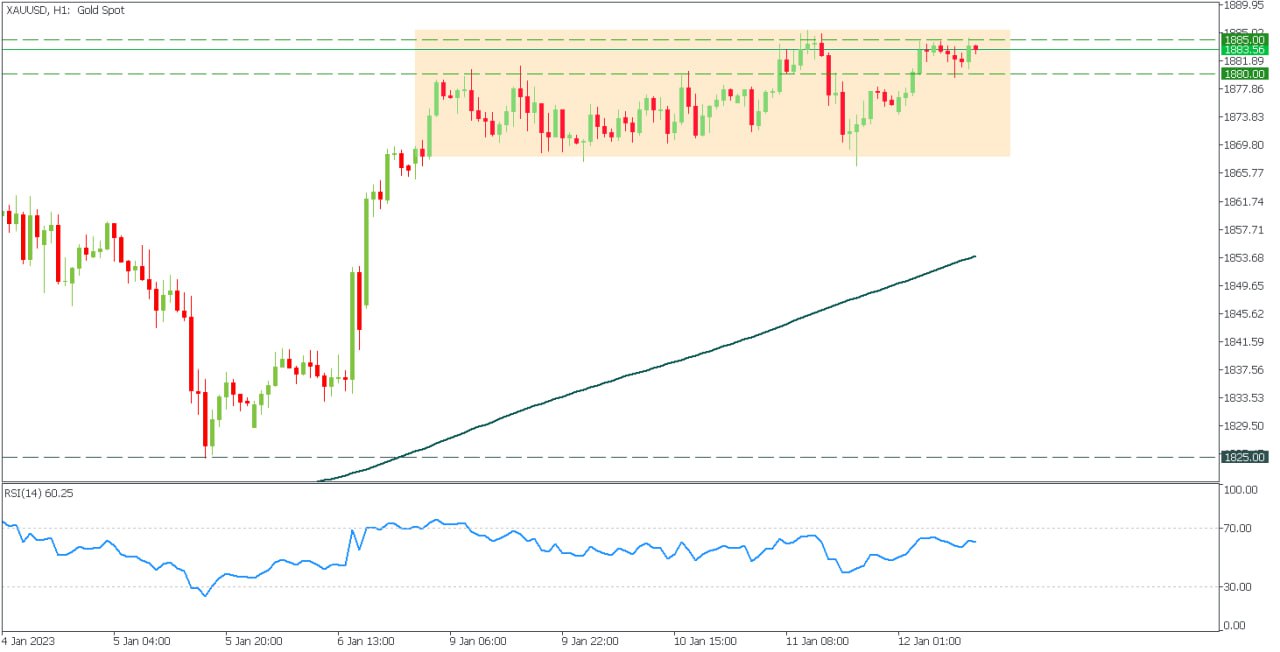
Gold ahead of CPI
1️⃣ The US CPI will come out in three hours (15:30 GMT+3). We don't recommend trading before the news release because you may get a spike in either direction and gambling is not an option for us.
2️⃣ Instead, mark support and resistance levels and trade breakouts and retests. For example, gold is likely to be bullish if the H1 candle closes above $1885.
3️⃣ On the contrary, we would sell the metal if the H1 candle closes below $1880.
What is your strategy for today?
Gold ahead of CPI
1️⃣ The US CPI will come out in three hours (15:30 GMT+3). We don't recommend trading before the news release because you may get a spike in either direction and gambling is not an option for us.
2️⃣ Instead, mark support and resistance levels and trade breakouts and retests. For example, gold is likely to be bullish if the H1 candle closes above $1885.
3️⃣ On the contrary, we would sell the metal if the H1 candle closes below $1880.
What is your strategy for today?
👍56🔥14❤🔥9🐳4👏3😍3🥰2😈1
#LiveStream
🤩 Are you ready for the volatility?
🔥Today, at 15:30 GMT+2, the US CPI will be released! It is a fantastic time for trading.
Thus, our expert Adetola Freeman would like to share some trade Ideas Live with you!
Join our live YouTube stream at 15:15 GMT+2!
Link: https://youtu.be/dgPFsd8S60I
🔥Today, at 15:30 GMT+2, the US CPI will be released! It is a fantastic time for trading.
Thus, our expert Adetola Freeman would like to share some trade Ideas Live with you!
Join our live YouTube stream at 15:15 GMT+2!
Link: https://youtu.be/dgPFsd8S60I
Please open Telegram to view this post
VIEW IN TELEGRAM
YouTube
LIVE FOREX CPI RELEASE TRADING - January 12
Start trading now: https://bit.ly/3yf6Ibz
Today, the US Bureau of Labor Statistics will release the monthly CPI changes. FBS financial expert Adetola Freeman will make a LIVE market outlook ahead of the CPI release. Moreover, he will be trading live and…
Today, the US Bureau of Labor Statistics will release the monthly CPI changes. FBS financial expert Adetola Freeman will make a LIVE market outlook ahead of the CPI release. Moreover, he will be trading live and…
👍26🔥5🐳4
FBS Analytics
#LiveStream 🤩 Are you ready for the volatility? 🔥Today, at 15:30 GMT+2, the US CPI will be released! It is a fantastic time for trading. Thus, our expert Adetola Freeman would like to share some trade Ideas Live with you! Join our live YouTube stream…
Please open Telegram to view this post
VIEW IN TELEGRAM
YouTube
LIVE FOREX CPI RELEASE TRADING - January 12
Start trading now: https://bit.ly/3yf6Ibz
Today, the US Bureau of Labor Statistics will release the monthly CPI changes. FBS financial expert Adetola Freeman will make a LIVE market outlook ahead of the CPI release. Moreover, he will be trading live and…
Today, the US Bureau of Labor Statistics will release the monthly CPI changes. FBS financial expert Adetola Freeman will make a LIVE market outlook ahead of the CPI release. Moreover, he will be trading live and…
👍17🔥5💩2❤1
🔥CPI release
Actual: -0.1%
Forecast: -0.1%
Previous: 0.1%
🔥Core CPI release
Actual: 0.3%
Forecast: 0.3%
Previous: 0.2%
Actual: -0.1%
Forecast: -0.1%
Previous: 0.1%
🔥Core CPI release
Actual: 0.3%
Forecast: 0.3%
Previous: 0.2%
👍40🔥16🐳6😢3🤪2🍌1
#MarketNews
☀️ Good morning, traders! Happy Friday the 13th! Let's check what news is moving the markets right now.
🇺🇸The Fed is preparing to reduce the rate hike step after the December CPI report. Goldman believes the December CPI report strengthens the case for a 0.25% rate hike in February and still expects 0.25% rate hikes in February, March and May.
🇨🇳China is bracing for a historic demographic turn accelerated by COVID. Over the past three years, living under strict anti-Covid restrictions in China has caused enough stress and uncertainty for many to plan to have children.
🇨🇳Asia is going up. Chinese indices added 1%. The reason is the regulators finally confirmed they intend to move to a soft policy towards private business and partner countries.
😈🇺🇸Today is Friday the 13th. Over the past 10 years, American indices have grown 8 times on this day.
🥇XAUUSD rose above $1 900 after an eight-month break. It happens largely due to the investment nature of gold, for which demand has grown amid lower expectations of a sharp rise in the Fed's rate. Quotes have been growing steadily since the beginning of the year, while the cost of other precious metals remains stable. The record demand for precious metals from the central banks of developing countries also supports prices.
🌎The global economy is on the verge between recession and a soft landing.
What are your trading plans for today?
☀️ Good morning, traders! Happy Friday the 13th! Let's check what news is moving the markets right now.
🇺🇸The Fed is preparing to reduce the rate hike step after the December CPI report. Goldman believes the December CPI report strengthens the case for a 0.25% rate hike in February and still expects 0.25% rate hikes in February, March and May.
🇨🇳China is bracing for a historic demographic turn accelerated by COVID. Over the past three years, living under strict anti-Covid restrictions in China has caused enough stress and uncertainty for many to plan to have children.
🇨🇳Asia is going up. Chinese indices added 1%. The reason is the regulators finally confirmed they intend to move to a soft policy towards private business and partner countries.
😈🇺🇸Today is Friday the 13th. Over the past 10 years, American indices have grown 8 times on this day.
🥇XAUUSD rose above $1 900 after an eight-month break. It happens largely due to the investment nature of gold, for which demand has grown amid lower expectations of a sharp rise in the Fed's rate. Quotes have been growing steadily since the beginning of the year, while the cost of other precious metals remains stable. The record demand for precious metals from the central banks of developing countries also supports prices.
🌎The global economy is on the verge between recession and a soft landing.
What are your trading plans for today?

👍28🔥5❤3🐳2🍾2👏1🤪1
🥇#XAUUSD
🔥XAUUSD middle-term analysis!
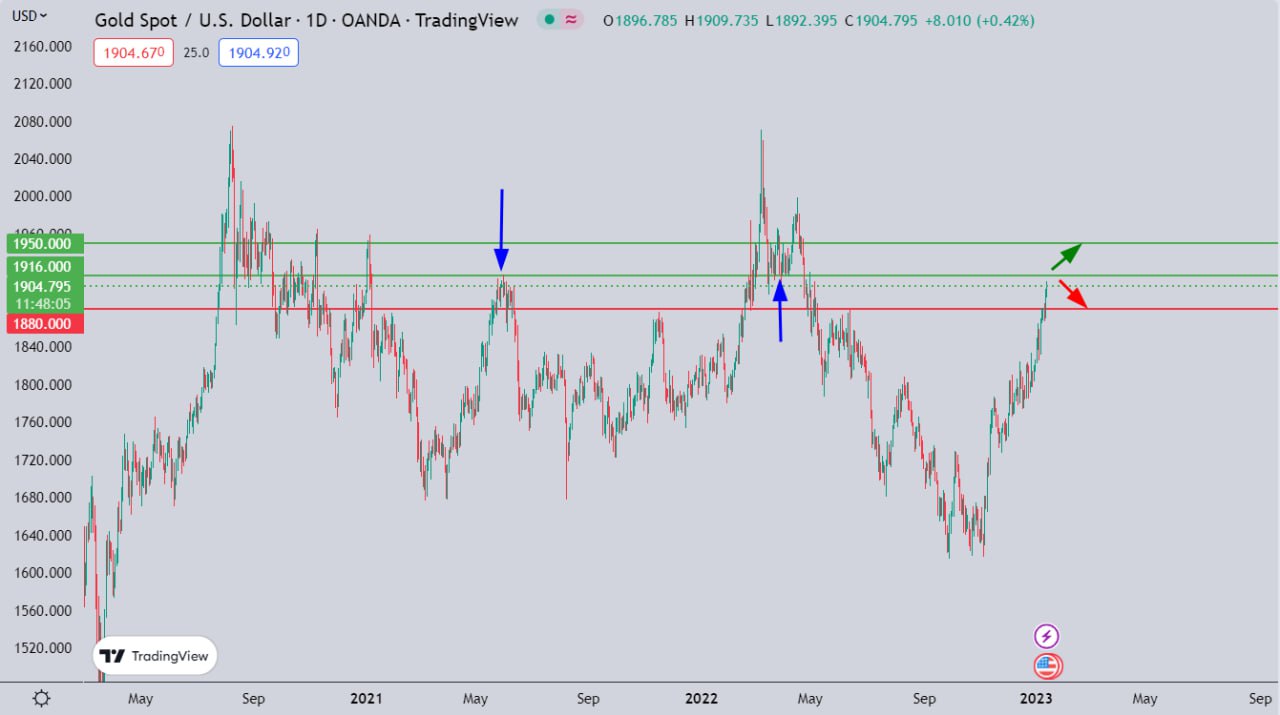
The price is slowly moving resistance level of 1916.00. You can notice that in June 2021 and April 2022, the price has been consolidating around this level for a long time, making this resistance critical for momentum.
🟢If the price breaks above this level, we can expect a further uptrend to 1950.00.
🔻However, if the price reverses off this line, it will decline to 1880.00.
Which level will the price reach first, 1950.00 or 1880.00?
✅START TRADING ✅
🔥XAUUSD middle-term analysis!
The price is slowly moving resistance level of 1916.00. You can notice that in June 2021 and April 2022, the price has been consolidating around this level for a long time, making this resistance critical for momentum.
🟢If the price breaks above this level, we can expect a further uptrend to 1950.00.
🔻However, if the price reverses off this line, it will decline to 1880.00.
Which level will the price reach first, 1950.00 or 1880.00?
✅START TRADING ✅
👍30🔥8❤5🐳4
🇦🇺🇨🇭#AUDCHF
🔥AUDCHF looks bearish!
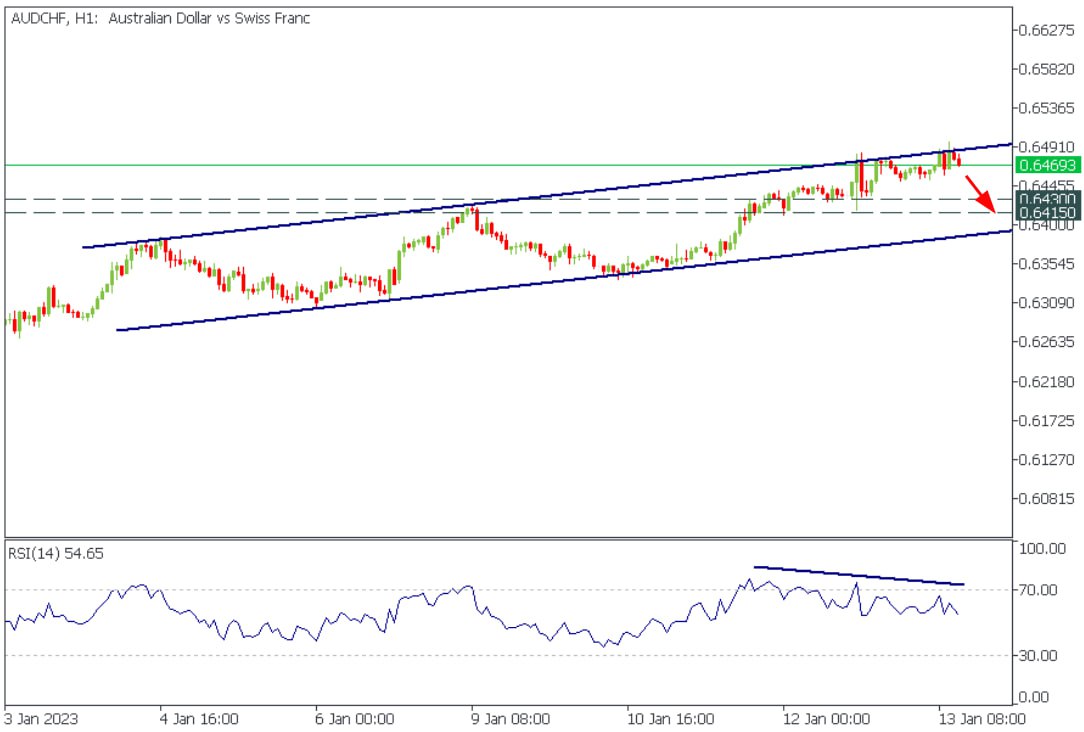
A couple of days ago, we bought AUDCHF at the lower border of the ascending channel. Now is the time to take profits and sell the pair due to several reasons:
1️⃣the pair reached the upper border of the channel.
2️⃣he price has formed a bearish divergence on the H1 timeframe
🎯Targets: 0.6430, 0.6415
✅START TRADING ✅
🔥AUDCHF looks bearish!
A couple of days ago, we bought AUDCHF at the lower border of the ascending channel. Now is the time to take profits and sell the pair due to several reasons:
1️⃣the pair reached the upper border of the channel.
2️⃣he price has formed a bearish divergence on the H1 timeframe
🎯Targets: 0.6430, 0.6415
✅START TRADING ✅
👍27❤7🔥7🍓2
#XBRUSD
Brent oil breakout
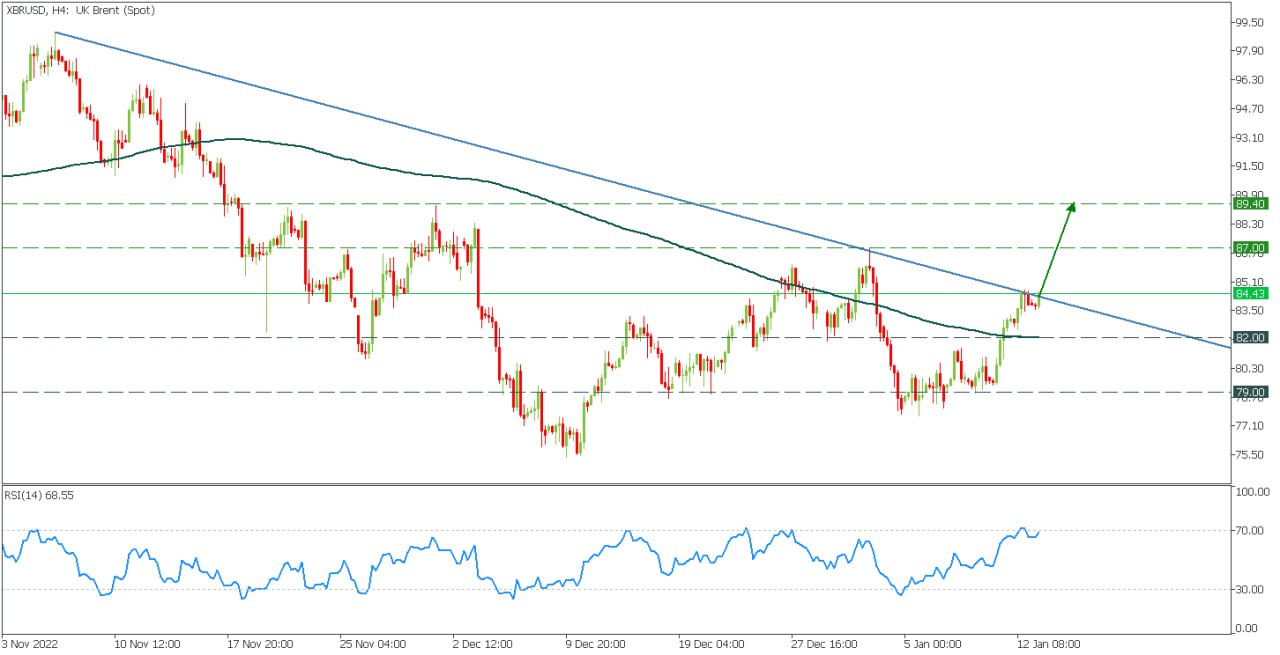
🚀The oil market is trying to gain momentum, but it must first break through the resistance trendline. XBRUSD may reach $87.00, the recent high, after the breakout.
📍On the other hand, the retest of the 200-period MA may cause the price to slide lower.
✅Resistance: 87.00, 89.40
🛑Support: 82.00, 79.00
➡️ START TRADING
Brent oil breakout
🚀The oil market is trying to gain momentum, but it must first break through the resistance trendline. XBRUSD may reach $87.00, the recent high, after the breakout.
📍On the other hand, the retest of the 200-period MA may cause the price to slide lower.
✅Resistance: 87.00, 89.40
🛑Support: 82.00, 79.00
➡️ START TRADING
👍13🐳3❤1🔥1