
🇪🇺🇺🇸#EURUSD
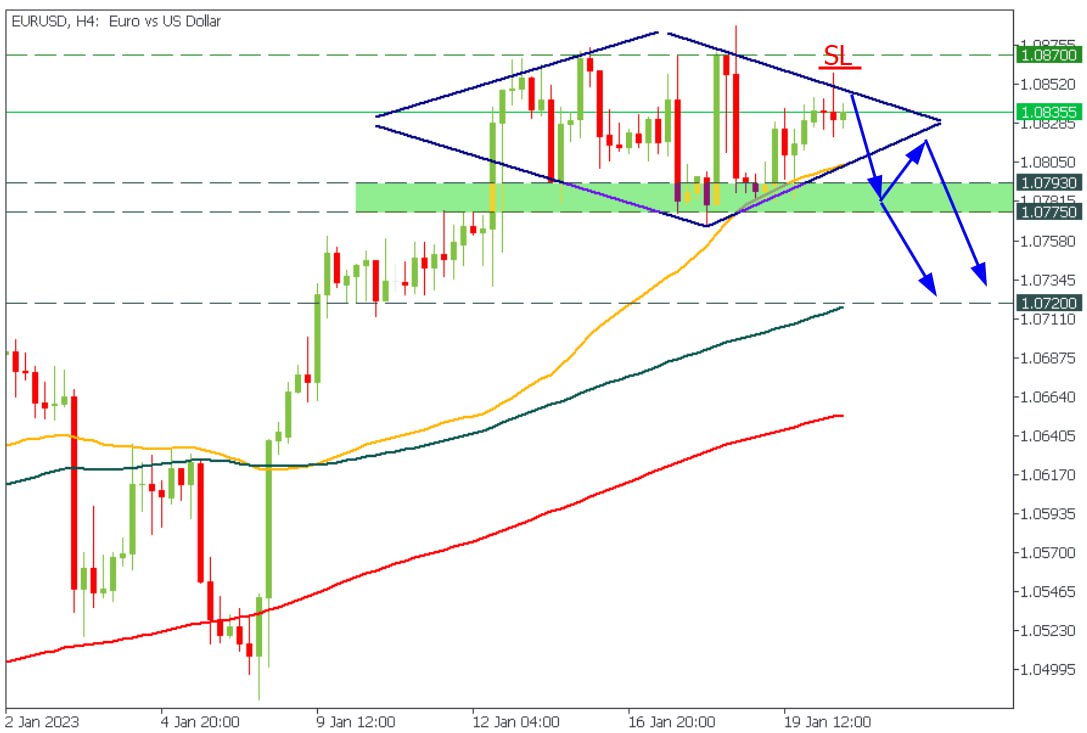
🔥EURUSD looks bearish!
The price has formed a perfect diamond pattern. Thus, we suggest looking for sell opportunities.
👍The best entry points are:
1️⃣Sell at the upper border of the Diamond with the SL above the trend line at the target at the lower Diamond's border.
2️⃣Sell after the breakout below the lower Diamond's border and the 1.0775 - 1.0793 support range. In this case, the target will be at 1.0720.
🤔Would EURUSD reverse soon?
✅TRY TRADING WITH FBS ✅
🔥EURUSD looks bearish!
The price has formed a perfect diamond pattern. Thus, we suggest looking for sell opportunities.
👍The best entry points are:
1️⃣Sell at the upper border of the Diamond with the SL above the trend line at the target at the lower Diamond's border.
2️⃣Sell after the breakout below the lower Diamond's border and the 1.0775 - 1.0793 support range. In this case, the target will be at 1.0720.
🤔Would EURUSD reverse soon?
✅TRY TRADING WITH FBS ✅
👍26🔥7🐳4❤3
FBS Analytics
🇦🇺🇺🇸#AUDUSD 🔥AUDUSD - correction might happen! After a massive dump the price reached the support range and the 100-period moving average. Thus, we expect a tiny correction to happen here. Our target is the 50-period moving average. 🟢Trade: BUY 🎯Target:…
🇦🇺🇺🇸#AUDUSD
🔥AUDUSD looks bearish!
The price reached our target☝️ and bounced back. Moreover, the price broke through the ascending support trend line. Thus, right now we are selling AUDUSD with the target at 0.6875.
😈 Are you with us?
✅START TRADING ✅
🔥AUDUSD looks bearish!
The price reached our target
✅START TRADING ✅
Please open Telegram to view this post
VIEW IN TELEGRAM
👍30🔥7🐳3🙈2
#Best_Investments
Part 5
2️⃣0️⃣0️⃣0️⃣, emerging markets!
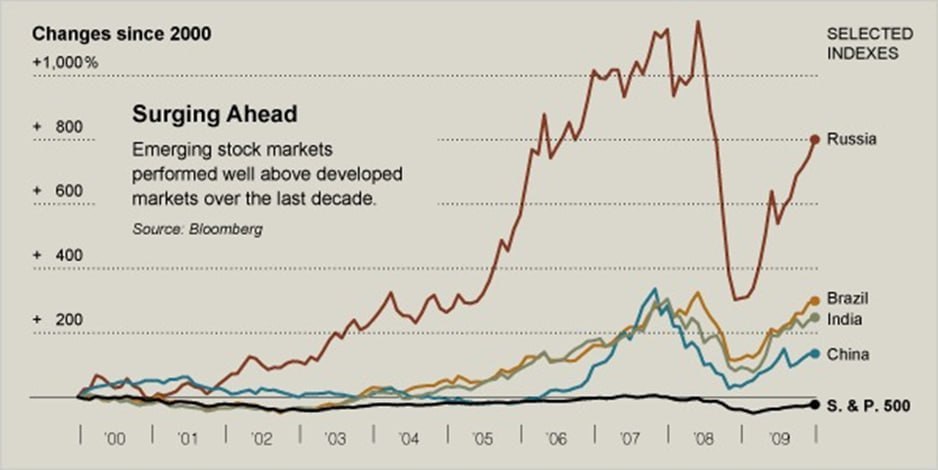
💹 As you can see, overvaluation is a common problem that follows the market almost every decade, leading to high risks and huge losses.
📚 History repeats itself, and in the 2000s, we witnessed another round of overvaluation. This time, emerging markets were in the limelight.
🌊 Huge flows of foreign investments went to emerging countries with higher risks and rewards. For example, Russia benefited from soaring oil prices, and its main stock gauge gained 880% over the decade, even despite the market crash of 2008.
🚀 Other high-yield markets are Brazil, with over 300% growth, India, and China. Meanwhile, the US500 index finished the decade with a loss of several percent.
Give us a ❤️ if you want the next part to come!
How long ago did you start trading?
Part 5
2️⃣0️⃣0️⃣0️⃣, emerging markets!
💹 As you can see, overvaluation is a common problem that follows the market almost every decade, leading to high risks and huge losses.
📚 History repeats itself, and in the 2000s, we witnessed another round of overvaluation. This time, emerging markets were in the limelight.
🌊 Huge flows of foreign investments went to emerging countries with higher risks and rewards. For example, Russia benefited from soaring oil prices, and its main stock gauge gained 880% over the decade, even despite the market crash of 2008.
🚀 Other high-yield markets are Brazil, with over 300% growth, India, and China. Meanwhile, the US500 index finished the decade with a loss of several percent.
Give us a ❤️ if you want the next part to come!
How long ago did you start trading?
❤79👍18❤🔥6🐳5🍾4😍3🔥2🤪2😢1
#Education
🔺Triangle patterns
Triangle patterns are one of the most common patterns you can meet daily! That's why it is important to learn how to trade them correctly.
👇This article describes the rules for trading all types of triangle patterns.
Read the article: http://bit.ly/3we0JTX
🔺Triangle patterns
Triangle patterns are one of the most common patterns you can meet daily! That's why it is important to learn how to trade them correctly.
👇This article describes the rules for trading all types of triangle patterns.
Read the article: http://bit.ly/3we0JTX

👍59❤5🔥5😱4😢3🐳3🤪3🍓2🍾2💋2🗿1
↩️How to Spot a Trend Reversal?
👦The trend is a trader's friend - one of the most famous and important sayings about the financial markets. Every trader knows that following the market is the easiest way to succeed. For example, if the market is bullish, a trader must wait for downside corrections and look for buy trade opportunities. On the contrary, a trader must wait for upside corrections and look for sell trade opportunities.
Why is it so important to stop a trend reversal?
The correct definition of a trend reversal will allow you to:
✅Exit your previous positions
✅Open positions following a new trend
How do you know a trend is reversing?
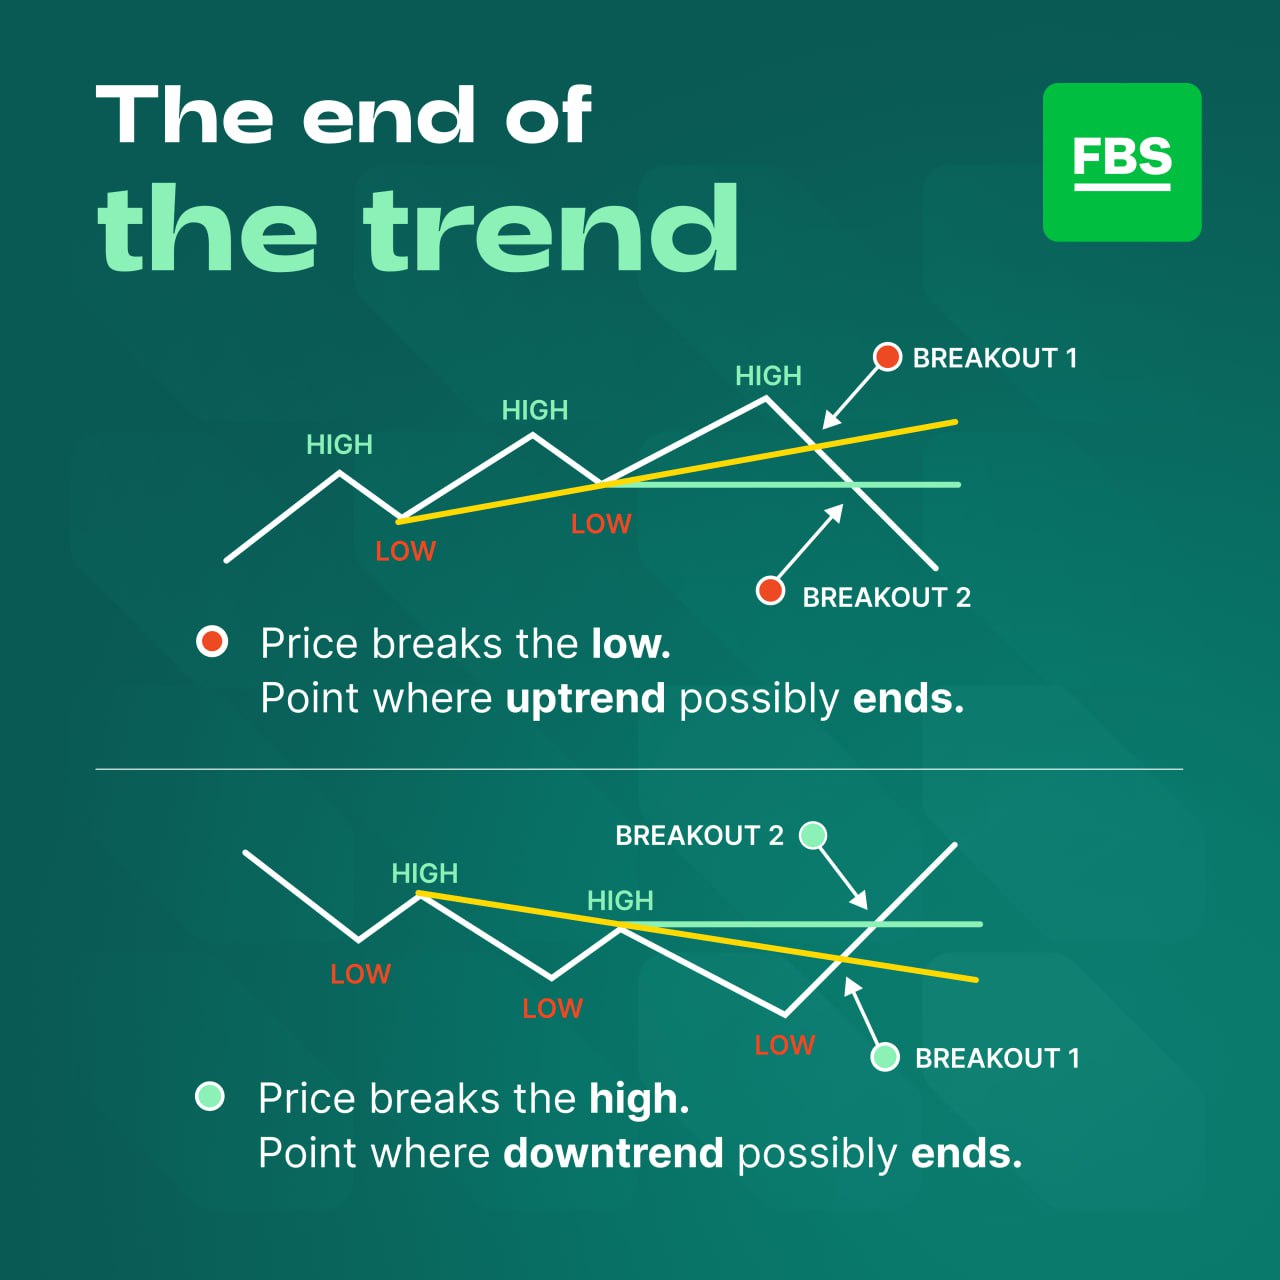
Scenario 1: The main sign of a strong bullish trend is that each next bottom should be higher than the previous one. The line that connects these bottoms forms the support trend line.
1️⃣The first sign of a trend reversal is when the price falls below the support line. This breakout is our first entry point for a trend reversal.
2️⃣The second and most important sign of a bullish trend reversal is a price drop below the recent bottom, which means the weakness of buyers and the dominance of sellers in the market. This breakout is our second sell entry point.
Scenario 2: The main sign of a strong bearish trend is that each next high should be lower than the previous one. The line that connects these highs forms the resistance trend line.
1️⃣The first sign of a trend reversal is the price breakout above the resistance line. This breakout is our first buy entry point.
2️⃣The second and most important sign of a bearish trend reversal is a price breakout above the recent high, meaning the sellers' weakness and the buyers' dominance in the market. This breakout is the second buy entry point.
Now you know how to define a trend reversal! What else do you want to know about trading?
➡️Want more? Read the article: http://bit.ly/3Xi8GmR
👦The trend is a trader's friend - one of the most famous and important sayings about the financial markets. Every trader knows that following the market is the easiest way to succeed. For example, if the market is bullish, a trader must wait for downside corrections and look for buy trade opportunities. On the contrary, a trader must wait for upside corrections and look for sell trade opportunities.
Why is it so important to stop a trend reversal?
The correct definition of a trend reversal will allow you to:
✅Exit your previous positions
✅Open positions following a new trend
How do you know a trend is reversing?
Scenario 1: The main sign of a strong bullish trend is that each next bottom should be higher than the previous one. The line that connects these bottoms forms the support trend line.
1️⃣The first sign of a trend reversal is when the price falls below the support line. This breakout is our first entry point for a trend reversal.
2️⃣The second and most important sign of a bullish trend reversal is a price drop below the recent bottom, which means the weakness of buyers and the dominance of sellers in the market. This breakout is our second sell entry point.
Scenario 2: The main sign of a strong bearish trend is that each next high should be lower than the previous one. The line that connects these highs forms the resistance trend line.
1️⃣The first sign of a trend reversal is the price breakout above the resistance line. This breakout is our first buy entry point.
2️⃣The second and most important sign of a bearish trend reversal is a price breakout above the recent high, meaning the sellers' weakness and the buyers' dominance in the market. This breakout is the second buy entry point.
Now you know how to define a trend reversal! What else do you want to know about trading?
➡️Want more? Read the article: http://bit.ly/3Xi8GmR
👍76❤11🐳5❤🔥4🔥2🍾2😈2😁1🥱1
🇪🇺🇺🇸#EURUSD
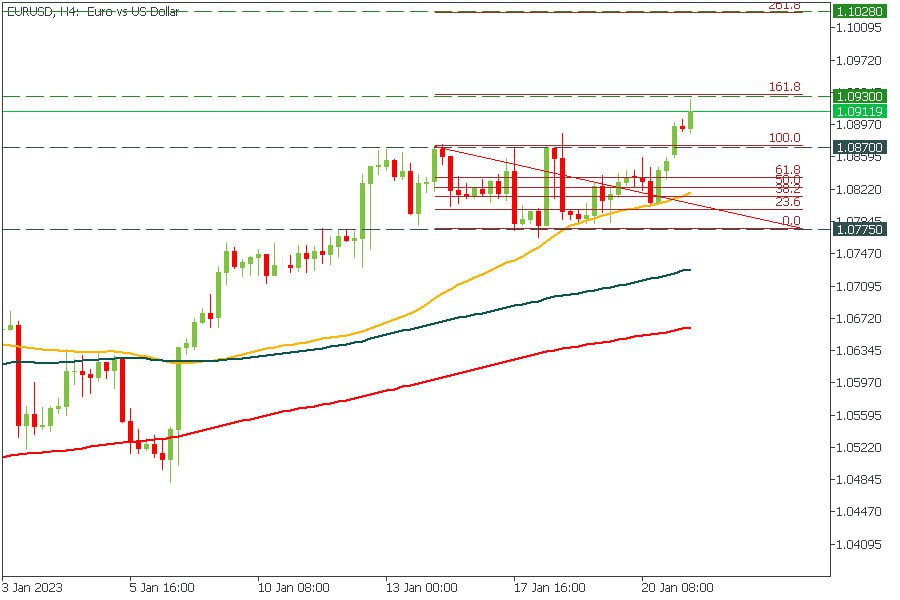
🔥The pair might pull back soon!
According to the Fibonacci retracement, the level of 1.0930 is a 161.8 Fibonacci level. Thus, it might act as a solid resistance for the price. That's why you might be looking for sell trades around this level with the target at 1.0870.
Are you bullish or bearish on the EURUSD today?
✅START TRADING ✅
🔥The pair might pull back soon!
According to the Fibonacci retracement, the level of 1.0930 is a 161.8 Fibonacci level. Thus, it might act as a solid resistance for the price. That's why you might be looking for sell trades around this level with the target at 1.0870.
Are you bullish or bearish on the EURUSD today?
✅START TRADING ✅
👍24🔥16❤4🐳3❤🔥1🥰1
#MarketNews
💚 Happy Monday, dear traders! Let's see what news is moving the markets at the beginning of the week!
🇯🇵According to the Bank of Japan meeting minutes, all group members consider it critical to maintain the soft monetary policy. Moreover, incentives will be increased if needed. Overall, the discussion was about how to make monetary policy easing more sustainable.
🇺🇸Bloomberg survey shows nearly 20% of US firms expect to reduce the number of employees.
💸World managers continue to build up shorts in the USD. The US dollar index is trading at 101.81.
🍏Indian Commerce Minister stated Apple plans to move up to 25% of production to India, which is now 5-7%.
🇨🇳Chinese household savings increased significantly in 2022. As a result, a $720 billion inflation bomb comes with China's opening.
🛢XBRUSD is moving toward the 88.75 resistance = monthly high.
☢️BTCUSD broke above $22 500. Currently, the price is heading toward $24 500, the 6-months high.
🥇What are your thoughts about XAUUSD?
💚 Happy Monday, dear traders! Let's see what news is moving the markets at the beginning of the week!
🇯🇵According to the Bank of Japan meeting minutes, all group members consider it critical to maintain the soft monetary policy. Moreover, incentives will be increased if needed. Overall, the discussion was about how to make monetary policy easing more sustainable.
🇺🇸Bloomberg survey shows nearly 20% of US firms expect to reduce the number of employees.
💸World managers continue to build up shorts in the USD. The US dollar index is trading at 101.81.
🍏Indian Commerce Minister stated Apple plans to move up to 25% of production to India, which is now 5-7%.
🇨🇳Chinese household savings increased significantly in 2022. As a result, a $720 billion inflation bomb comes with China's opening.
🛢XBRUSD is moving toward the 88.75 resistance = monthly high.
☢️BTCUSD broke above $22 500. Currently, the price is heading toward $24 500, the 6-months high.
🥇What are your thoughts about XAUUSD?

👍19🔥4❤2🐳2🤪2
🛢#XBRUSD
🔥XBRUSD might reverse soon!
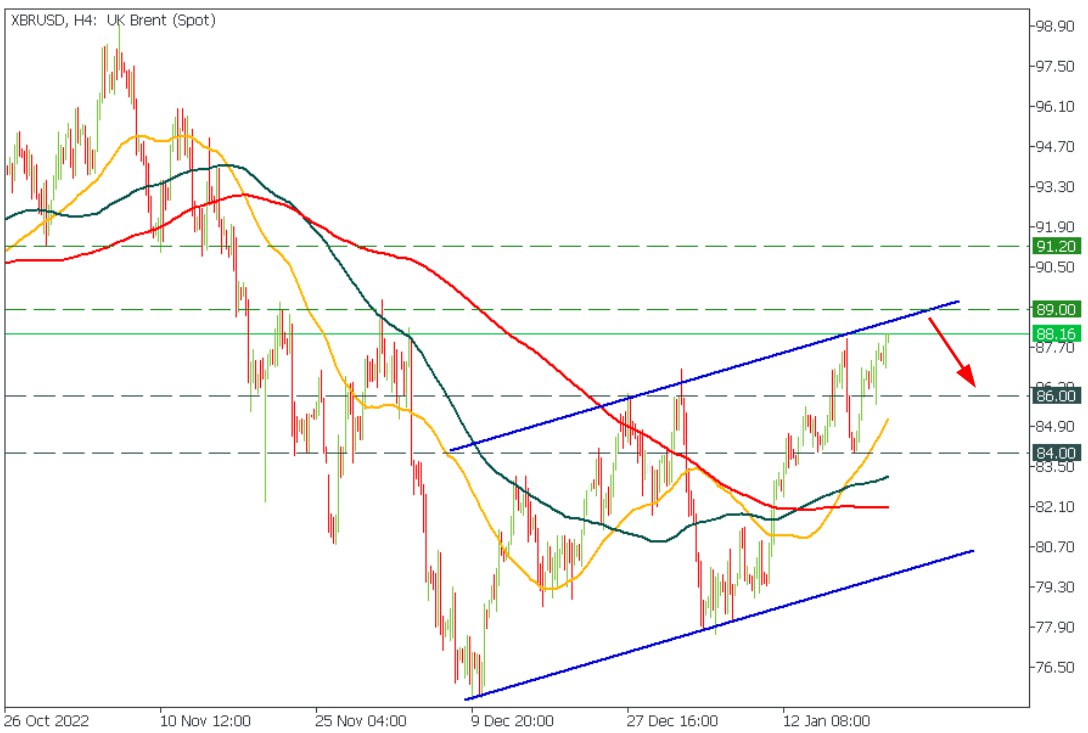
The price is slowly moving toward the upper border of the ascending channel and the 89.00 resistance level. Consider looking for sell trade opportunities around 89.00 and the target at 86.00.
❗️However, if the price breaks through the upper channel's border, the price will fly to 91.20.
How often do you trade Brent?
✅START TRADING ✅
🔥XBRUSD might reverse soon!
The price is slowly moving toward the upper border of the ascending channel and the 89.00 resistance level. Consider looking for sell trade opportunities around 89.00 and the target at 86.00.
❗️However, if the price breaks through the upper channel's border, the price will fly to 91.20.
How often do you trade Brent?
✅START TRADING ✅
👍16🔥4🐳4😍3
FBS Analytics
🇪🇺🇺🇸#EURUSD 🔥The pair might pull back soon! According to the Fibonacci retracement, the level of 1.0930 is a 161.8 Fibonacci level. Thus, it might act as a solid resistance for the price. That's why you might be looking for sell trades around this level…
🇪🇺🇺🇸 #EURUSD
🔥 The price reached the target!
EURUSD reached the 1.0870 support level and bounced off it. Now, we can trade in the opposite direction buying the pair with the target at 1.0915!
Are you buying EURUSD right now?
✅START TRADING ✅
EURUSD reached the 1.0870 support level and bounced off it. Now, we can trade in the opposite direction buying the pair with the target at 1.0915!
Are you buying EURUSD right now?
✅START TRADING ✅
Please open Telegram to view this post
VIEW IN TELEGRAM
👍24🔥8✍3🐳3💩2❤1
🇺🇸🇨🇦#USDCAD
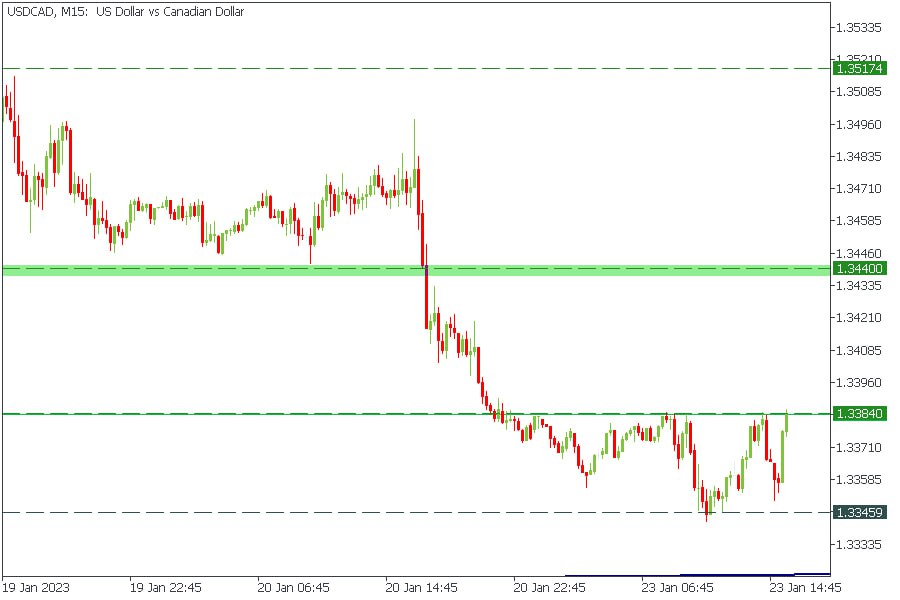
🔥USDCAD is testing the resistance level!
If the price breaks through the 1.3384 resistance, it might increase to 1.3440.
❗️The trade idea will be active only after a breakout!
✅START TRADING ✅
🔥USDCAD is testing the resistance level!
If the price breaks through the 1.3384 resistance, it might increase to 1.3440.
❗️The trade idea will be active only after a breakout!
✅START TRADING ✅
👍23🔥8❤5🐳5
🇺🇸🇯🇵#USDJPY
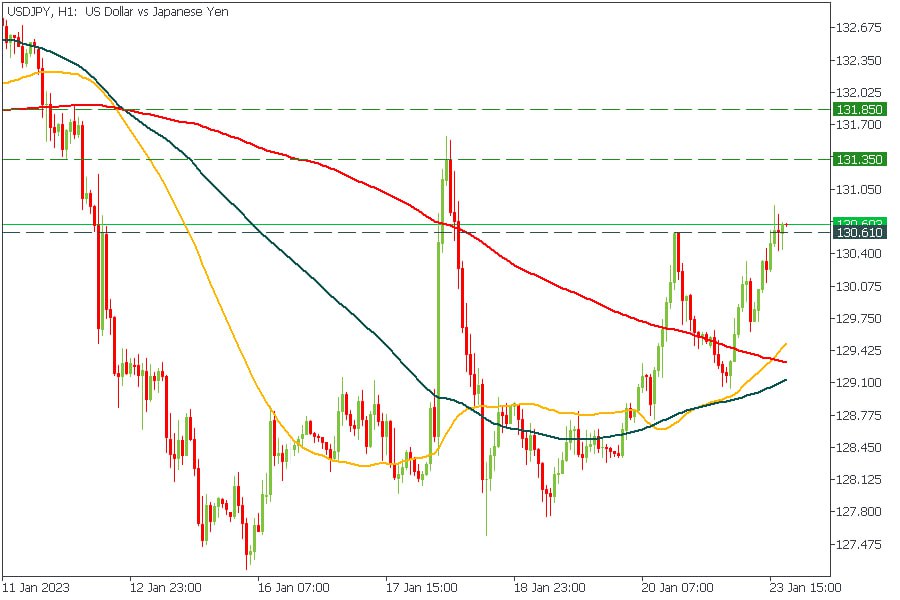
🔥USDJPY looks bullish!
The price broke through the recent high and retested it from the above. Thus, we expect an uptrend to continue with the price moving toward the 131.35 and 131.85.
😈Do you think USDJPY will continue moving up?
✅START TRADING ✅
🔥USDJPY looks bullish!
The price broke through the recent high and retested it from the above. Thus, we expect an uptrend to continue with the price moving toward the 131.35 and 131.85.
😈Do you think USDJPY will continue moving up?
✅START TRADING ✅
👍26🔥6🐳5❤4😢1
#MarketNews
🙌Happy Tuesday, dear traders! Let's see what news is moving the markets today!
🇺🇸Republican leader in the US Senate McConnell, in his speech about the ceiling of the US national debt, stated there would be no default.
📈The S&P 500 index opens the week in positive territory, with the price breaking above 4010.00, waiting for Tesla, Microsoft, and Intel to report this week. Some analysts are waiting for positive signals due to a gradual recovery in macroeconomic indicators.
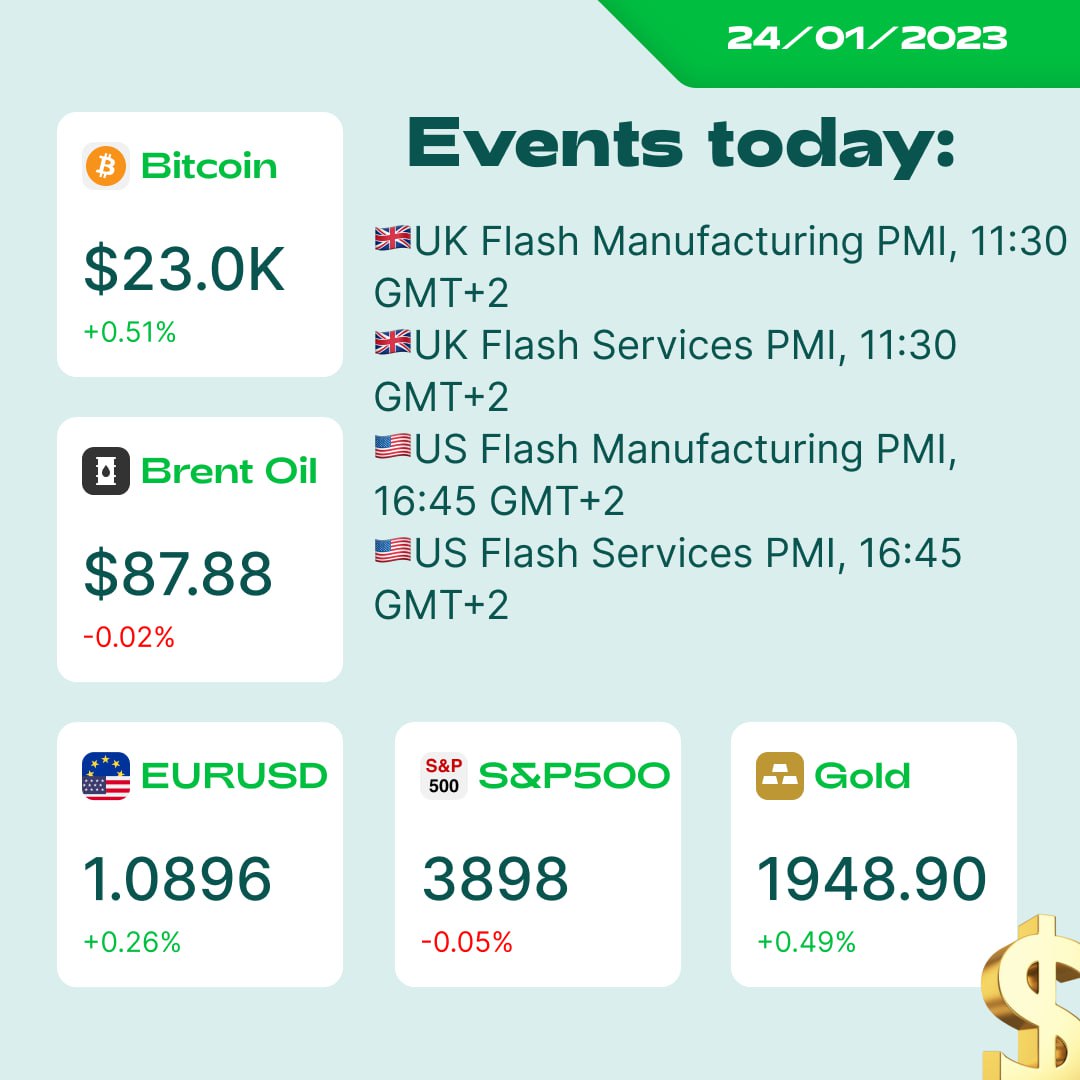
❗️ Today, the market is waiting for PMI data in the manufacturing sector and PMI in services in the US and UK, which may indicate the economic situation of these two countries.
☢️JPMorgan stated 95% of Coinbase retail customers would be able to stake Ethereum after the Shanghai update. It can bring the exchange from $225 to $545 million in additional annual income.
🇬🇧UK experiences a record budget deficit due to the rising spending as inflation boosts debt repayments.
🥇XAUUSD breaks above the 1935.00 support. The next resistance is 1948.00.
What are you going to trade today?
🙌Happy Tuesday, dear traders! Let's see what news is moving the markets today!
🇺🇸Republican leader in the US Senate McConnell, in his speech about the ceiling of the US national debt, stated there would be no default.
📈The S&P 500 index opens the week in positive territory, with the price breaking above 4010.00, waiting for Tesla, Microsoft, and Intel to report this week. Some analysts are waiting for positive signals due to a gradual recovery in macroeconomic indicators.
❗️ Today, the market is waiting for PMI data in the manufacturing sector and PMI in services in the US and UK, which may indicate the economic situation of these two countries.
☢️JPMorgan stated 95% of Coinbase retail customers would be able to stake Ethereum after the Shanghai update. It can bring the exchange from $225 to $545 million in additional annual income.
🇬🇧UK experiences a record budget deficit due to the rising spending as inflation boosts debt repayments.
🥇XAUUSD breaks above the 1935.00 support. The next resistance is 1948.00.
What are you going to trade today?
👍11🔥8🐳4🤪1
🇬🇧🇺🇸#GBPUSD
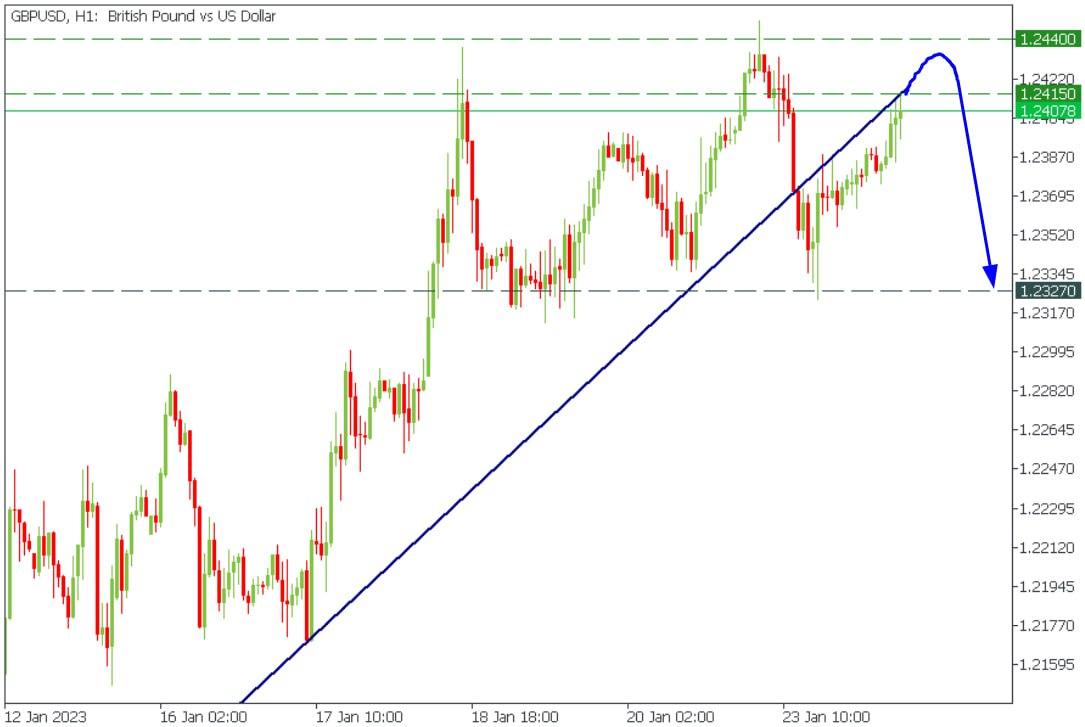
🔥GBPUSD might drop after the UK PMI release!
The numbers will be posted in 5 minutes. We can notice the price broke below the support trend line and retested it. Thus, a reversal might happen soon!
Consider waiting for the release and look for sell opportunities inside the 1.2415 - 1.2440 resistance range.
🎯TP: 1.2327
Are you bullish or bearish on GBPUSD today?
🔥GBPUSD might drop after the UK PMI release!
The numbers will be posted in 5 minutes. We can notice the price broke below the support trend line and retested it. Thus, a reversal might happen soon!
Consider waiting for the release and look for sell opportunities inside the 1.2415 - 1.2440 resistance range.
🎯TP: 1.2327
Are you bullish or bearish on GBPUSD today?
👍27🔥10❤7
🇺🇸🇨🇭#USDCHF
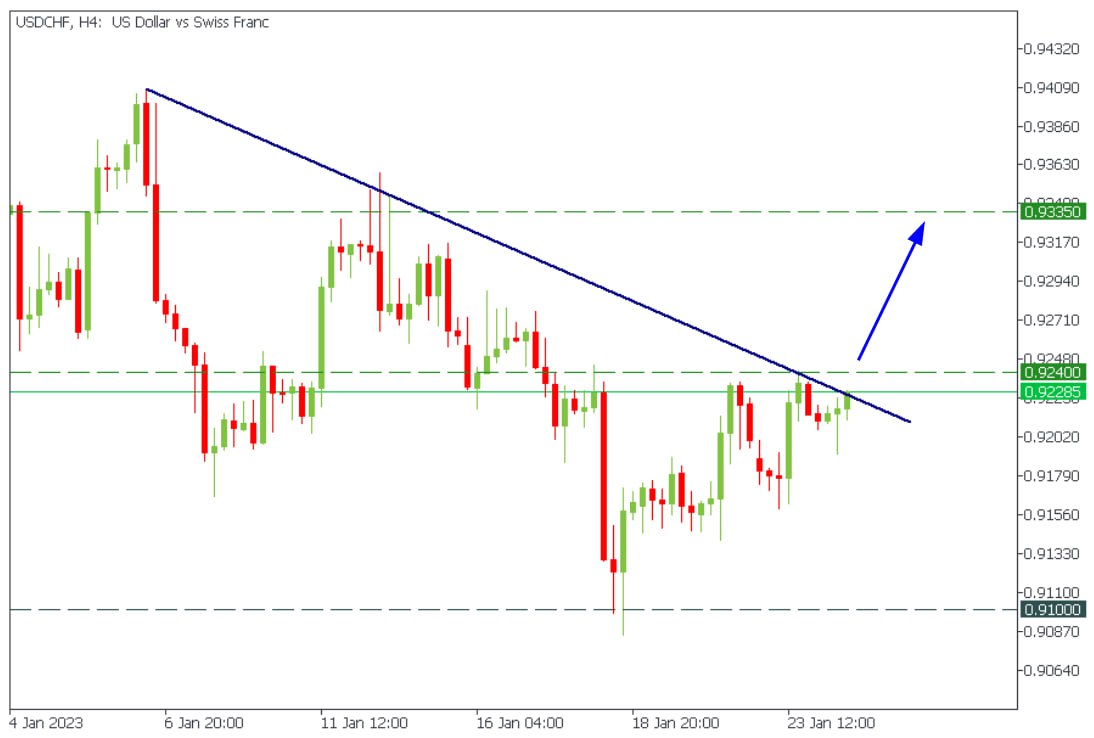
🔥USDCHF might skyrocket soon!
The price may break above the descending trend line in the H4 timeframe. Thus, after a breakout above 0.9240 (recent high), you might consider buying USDCHF with the middle-term target at 0.9335!
🟢Trade: BUY
🎯Target: 0.9335!
❗️Use proper risk management and set-stop losses ❗️
✅TRADE USDCHF ✅
🔥USDCHF might skyrocket soon!
The price may break above the descending trend line in the H4 timeframe. Thus, after a breakout above 0.9240 (recent high), you might consider buying USDCHF with the middle-term target at 0.9335!
🟢Trade: BUY
🎯Target: 0.9335!
❗️Use proper risk management and set-stop losses ❗️
✅TRADE USDCHF ✅
👍22❤5🔥4🥰2🐳2
🥇#XAUUSD
🔥Gold is holding the support!
XAUUSD is retesting the 1935.00 - 1936.00 range breakout, which is the primary support for the price now. Thus, if the retest is successful, we might gain buy positions with the targets at 1941.00 and 1948.00.
🟢Trade: BUY
🎯TP: 1941.00, 1948.00
Do you agree?
✅TRADE XAUUSD ✅
🔥Gold is holding the support!
XAUUSD is retesting the 1935.00 - 1936.00 range breakout, which is the primary support for the price now. Thus, if the retest is successful, we might gain buy positions with the targets at 1941.00 and 1948.00.
🟢Trade: BUY
🎯TP: 1941.00, 1948.00
Do you agree?
✅TRADE XAUUSD ✅

👍23🔥5🐳3🍾3🤪3
🇬🇧🇺🇸#GBPUSD
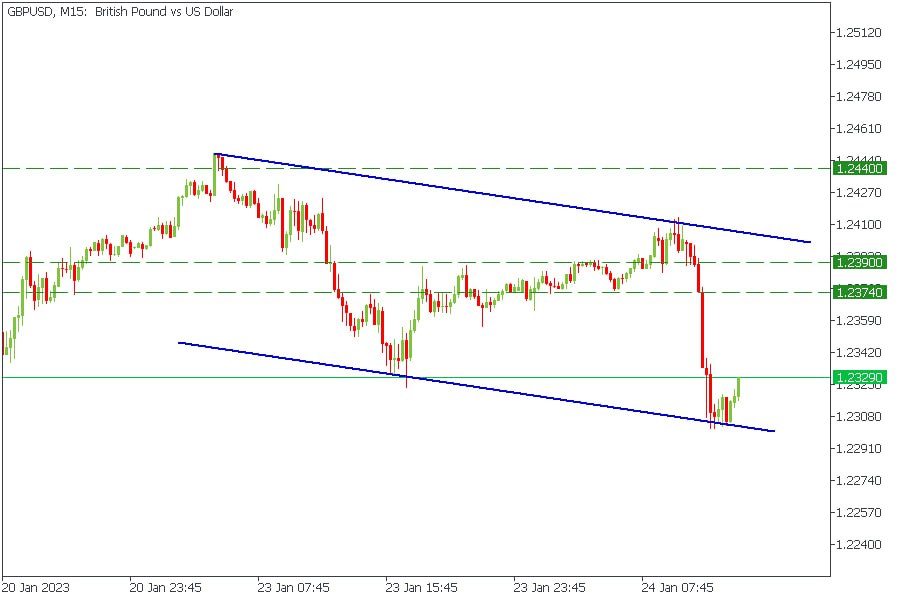
🔥GBPUSD look bullish!
The price bounced off the lower border of the descending channel. Now, we are expecting a pullback toward 1.2374 and 1.2390, 50.0 and 61.8 Fibonacci levels.
🟢Trade: BUY
🎯TP: 1.2374, 1.2390
❌SL: below the recent low
✅TRADE GBPUSD ✅
🔥GBPUSD look bullish!
The price bounced off the lower border of the descending channel. Now, we are expecting a pullback toward 1.2374 and 1.2390, 50.0 and 61.8 Fibonacci levels.
🟢Trade: BUY
🎯TP: 1.2374, 1.2390
❌SL: below the recent low
✅TRADE GBPUSD ✅
👍28🔥3🐳3🍾3❤2👎1
FBS Analytics
🇺🇸🇨🇭#USDCHF 🔥USDCHF might skyrocket soon! The price may break above the descending trend line in the H4 timeframe. Thus, after a breakout above 0.9240 (recent high), you might consider buying USDCHF with the middle-term target at 0.9335! 🟢Trade: BUY 🎯Target:…
💥Attention!
The price is breaking through!
The price is breaking through!
⚡17👍17❤10🔥6🐳5🍌2😢1🍾1🤪1
🛢#XBRUSD
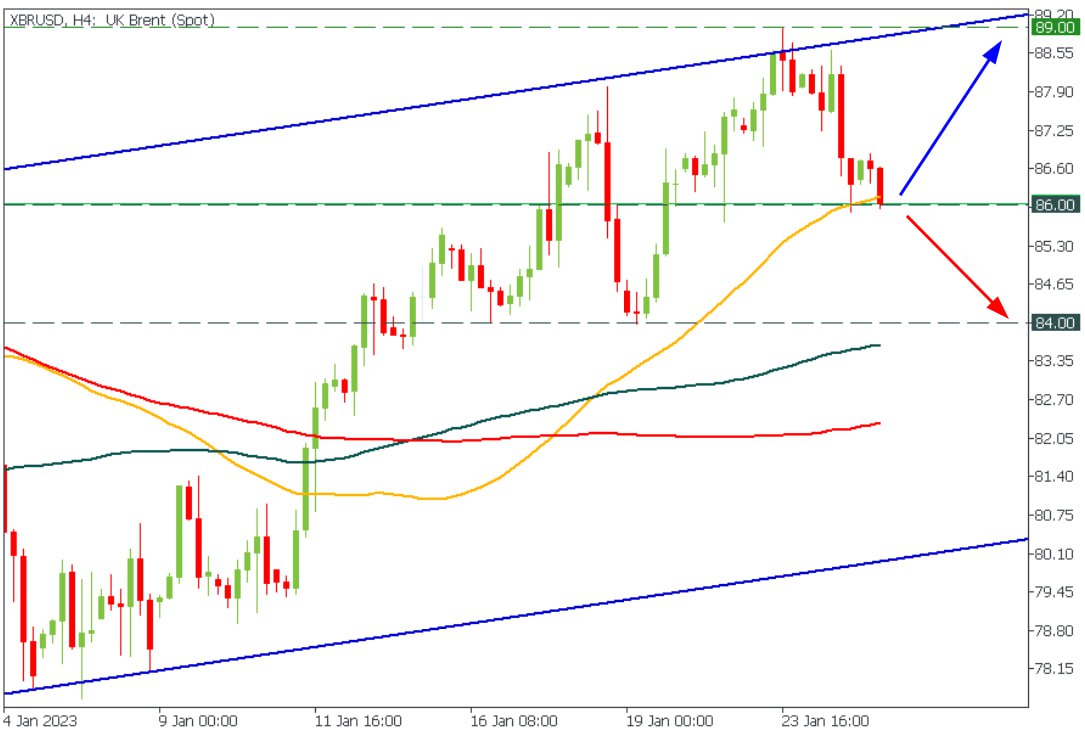
💥Key moment for the oil market!
XBRUSD is flirting with the cross point of the 86.00 support level and 50-period moving average. If the breakout happens, the price will decline to 84.00.
❗️However, in case of reversal, buyers might push XBRUSD to the 89.00 resistance.
✅START TRADING WITH FBS ✅
💥Key moment for the oil market!
XBRUSD is flirting with the cross point of the 86.00 support level and 50-period moving average. If the breakout happens, the price will decline to 84.00.
❗️However, in case of reversal, buyers might push XBRUSD to the 89.00 resistance.
✅START TRADING WITH FBS ✅
👍16🔥7❤2🐳2👌1🍾1
#MarketNews
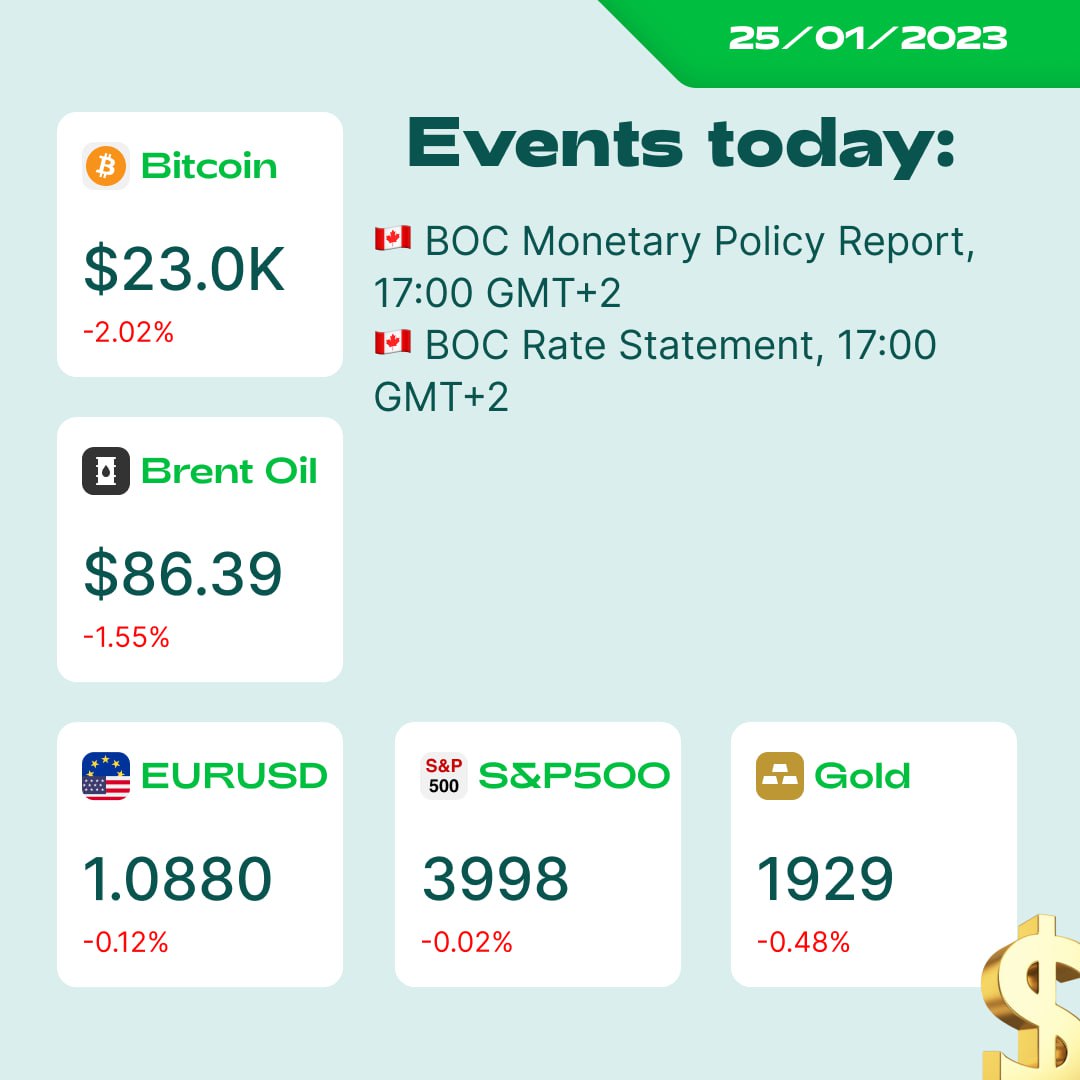
💚 There’s no better start to the day than with fresh news from FBS!
🇦🇺Australian quarterly CPI turned out to be higher than expected (1.9% vs. 1.6% forecast). AUDUSD is up 750 points.
🇳🇿New Zealand CPI is also above expectations (1.4% vs. 1.3% forecast). NZDUSD is down 550 points since the release.
🇺🇸 US Flash Manufacturing and Services PMI surpassed the forecast, pushing XAUUSD 1200 points down.
🇩🇪 German Ifo Business Climate aligned with expectations, and no effect on EURUSD has been seen.
🇨🇳 The Chinese yuan remained the fifth most active currency for global payments by value in December 2022.
🇧🇷🇦🇷 Argentina and Brazil are discussing plans for a common currency as part of a coordinated plan to reduce reliance on the USD.
🏦 Jeremy Grantham, an 84-year investment manager, bet SP500 would soon be down another 17%.
🏆 Gold failed to overcome the resistance of $1940 and slid to the support of $1928. The metal may reach $1923 soon.
😉Happy trading, and share your trade ideas in the comments!
💚 There’s no better start to the day than with fresh news from FBS!
🇦🇺Australian quarterly CPI turned out to be higher than expected (1.9% vs. 1.6% forecast). AUDUSD is up 750 points.
🇳🇿New Zealand CPI is also above expectations (1.4% vs. 1.3% forecast). NZDUSD is down 550 points since the release.
🇺🇸 US Flash Manufacturing and Services PMI surpassed the forecast, pushing XAUUSD 1200 points down.
🇩🇪 German Ifo Business Climate aligned with expectations, and no effect on EURUSD has been seen.
🇨🇳 The Chinese yuan remained the fifth most active currency for global payments by value in December 2022.
🇧🇷🇦🇷 Argentina and Brazil are discussing plans for a common currency as part of a coordinated plan to reduce reliance on the USD.
🏦 Jeremy Grantham, an 84-year investment manager, bet SP500 would soon be down another 17%.
🏆 Gold failed to overcome the resistance of $1940 and slid to the support of $1928. The metal may reach $1923 soon.
😉Happy trading, and share your trade ideas in the comments!
👍21🔥10❤7🐳3