
🇪🇺🇺🇸 👉 🇪🇺 🇻🇦 🌠 👈 #EURUSD
EURUSD is declining!
EURUSD is moving inside the descending channel.
The price failed to break above the 1.0710 and reversed toward the lower channel’s border.
After a breakout below 1.0690, the way to 1.0660 and 1.0630 will be opened.
🔽 Trade: Sell
🟢 Entry: breakout below 1.0690
🎯TP: 1.0660, 1.0630
😈 Are you in?
✅ TRADE WITH FBS ✅
EURUSD is declining!
EURUSD is moving inside the descending channel.
The price failed to break above the 1.0710 and reversed toward the lower channel’s border.
After a breakout below 1.0690, the way to 1.0660 and 1.0630 will be opened.
🎯TP: 1.0660, 1.0630
Please open Telegram to view this post
VIEW IN TELEGRAM
👍33🔥8✍3❤🔥3🐳3❤2👎1🥱1
Currently, the price is retesting the support trendline from below, with 1843.00 as the primary resistance.
We expect a downtrend to continue after the price touches 1843.00 (or the resistance trendline or 100-hour moving average).
🎯TP: 1830.00, 1820.00
Are you bearish on XAUUSD today?
Please open Telegram to view this post
VIEW IN TELEGRAM
👍56❤🔥7🔥7❤4👌4😍2🏆1
🇺🇸🇨🇦#USDCAD
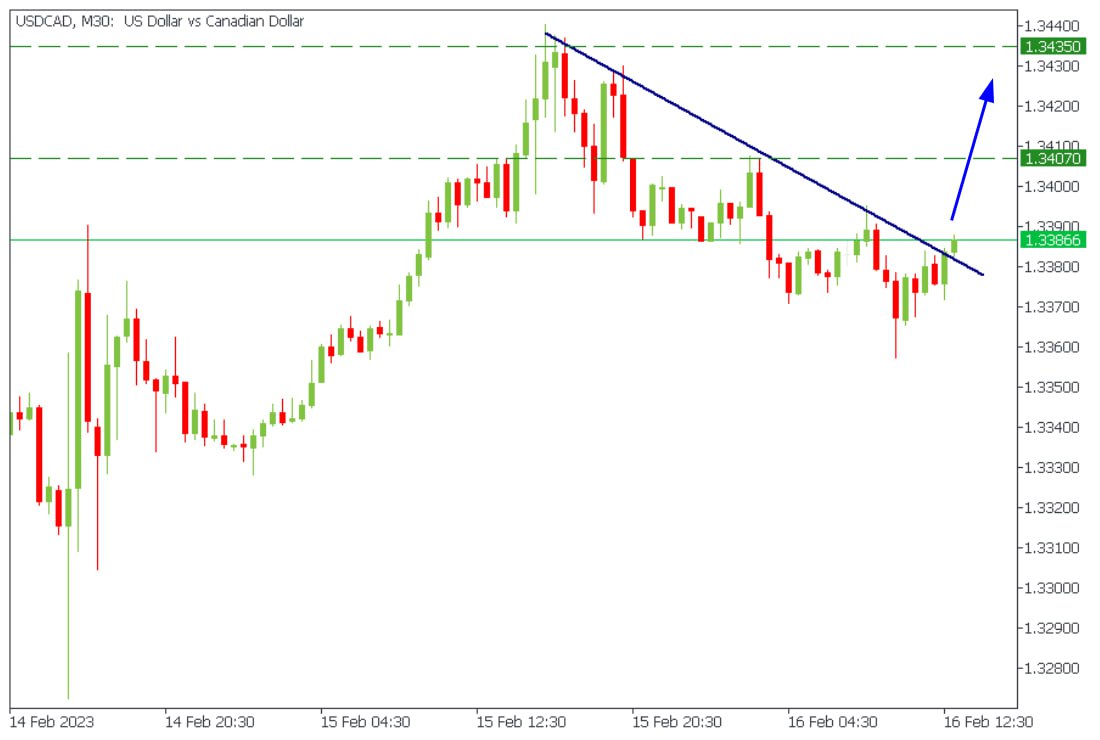
🔥USDCAD broke through the resistance trendline!
Consider buying USDCAD with targets 1.3407 and 1.3435!
Do you agree?
✅TRADE WITH FBS ✅
🔥USDCAD broke through the resistance trendline!
Consider buying USDCAD with targets 1.3407 and 1.3435!
Do you agree?
✅TRADE WITH FBS ✅
✍16👍14❤6🔥4🏆1
💥Voice chat with FBS analyst!💥
👋Hi, dear traders!
20 minutes left till the US PPI release! And only 5 minutes left for our weekly voice chat!
Join us discuss the markets ahead of the ECB and BOE Monetary Policy Statements!
Link: https://t.me/fbsanalytics?livestream
👋Hi, dear traders!
20 minutes left till the US PPI release! And only 5 minutes left for our weekly voice chat!
Join us discuss the markets ahead of the ECB and BOE Monetary Policy Statements!
Link: https://t.me/fbsanalytics?livestream

👍30❤10🔥5🙏3🍾2
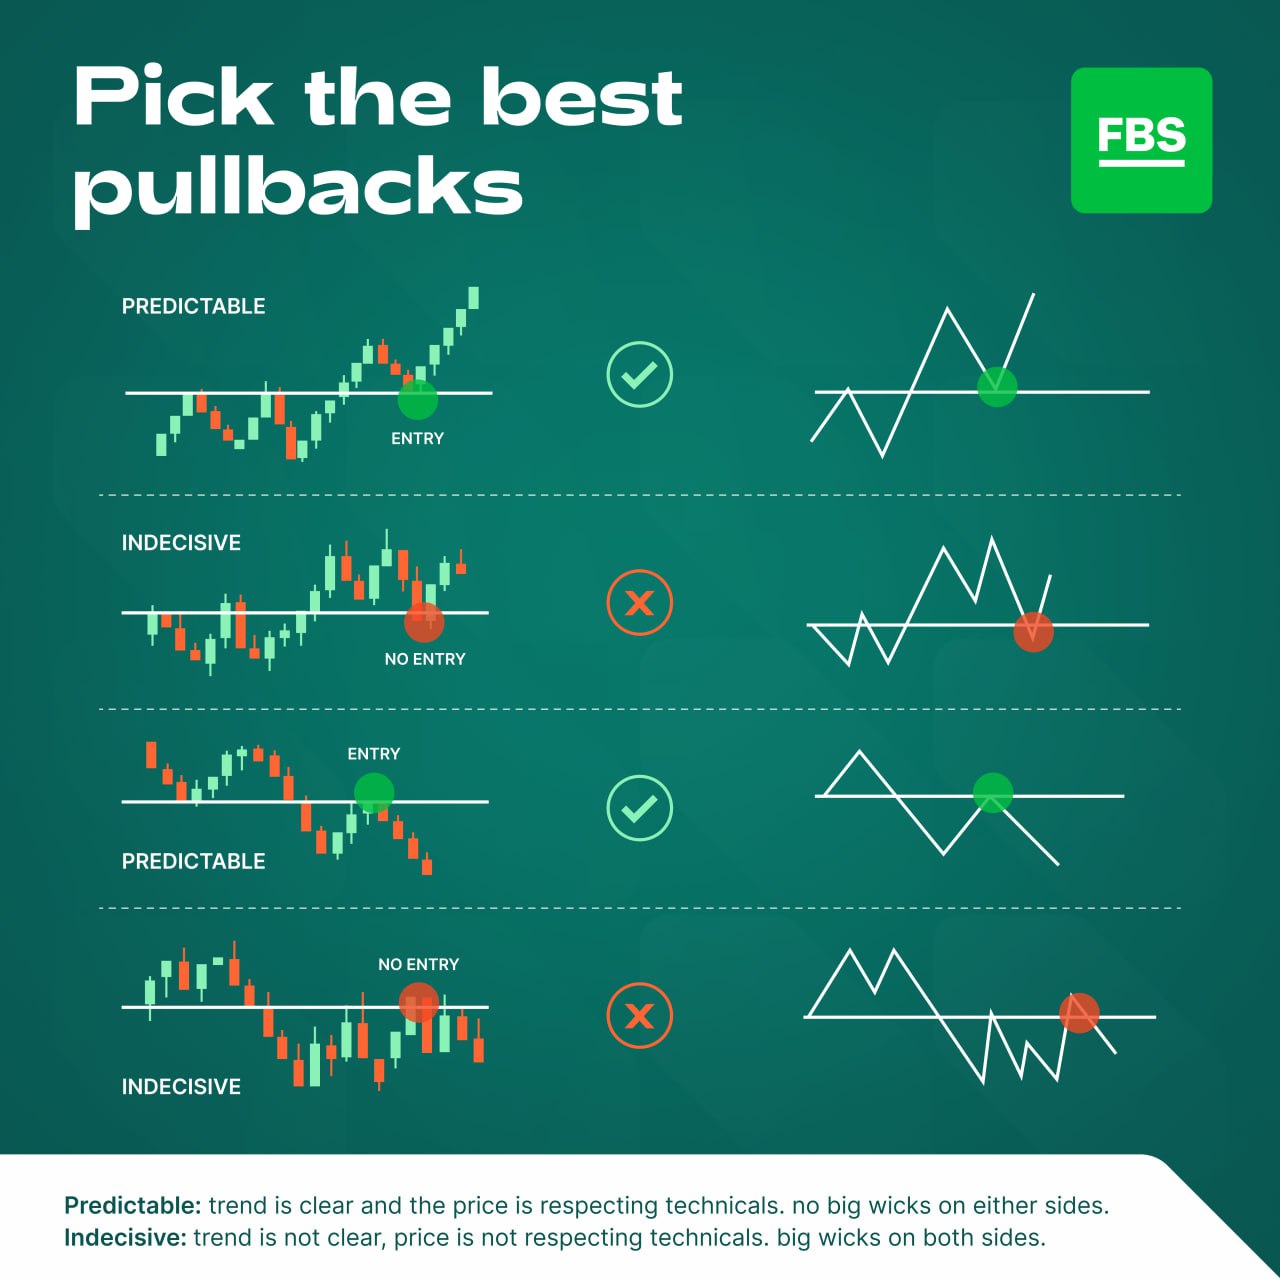
📈Pullback trading is a popular trading strategy used by traders to take advantage of temporary price reversals in a trend. Here are five steps to help you trade pullbacks like a pro:
Step 1: Identify the Trend
Use technical analysis tools like moving averages, trend lines, and chart patterns to determine whether the market is in an uptrend or a downtrend.
Step 2: Identify the Pullback
Once you've identified the trend, look for a pullback in the price. A pullback is a temporary retracement in the price of an asset, often caused by profit-taking or a change in market sentiment.
Step 3: Look for Support and Resistance Levels
After identifying the pullback, look for key support and resistance levels. These levels can be identified using technical analysis tools such as Fibonacci retracements, horizontal lines or trend lines.
Step 4: Enter the Trade
Once you've identified the pullback and support and resistance levels, it's time to enter the trade. The best time to enter a pullback trade is when the price retraces to a key support or resistance level and then bounces off that level. Look for a bullish or bearish candlestick pattern to confirm the entry point.
Step 5: Manage the Trade
Managing the trade is crucial in pullback trading. Set a stop loss order to limit your losses if the price moves against you, and take profit when the price reaches a key resistance or support level. If the price continues to move in your favor, consider trailing your stop loss order to lock in profits.
🙌By following these 5 steps, you can increase your chances of making profitable pullback trades. Remember to always manage your risk and trade with discipline.
Step 1: Identify the Trend
Use technical analysis tools like moving averages, trend lines, and chart patterns to determine whether the market is in an uptrend or a downtrend.
Step 2: Identify the Pullback
Once you've identified the trend, look for a pullback in the price. A pullback is a temporary retracement in the price of an asset, often caused by profit-taking or a change in market sentiment.
Step 3: Look for Support and Resistance Levels
After identifying the pullback, look for key support and resistance levels. These levels can be identified using technical analysis tools such as Fibonacci retracements, horizontal lines or trend lines.
Step 4: Enter the Trade
Once you've identified the pullback and support and resistance levels, it's time to enter the trade. The best time to enter a pullback trade is when the price retraces to a key support or resistance level and then bounces off that level. Look for a bullish or bearish candlestick pattern to confirm the entry point.
Step 5: Manage the Trade
Managing the trade is crucial in pullback trading. Set a stop loss order to limit your losses if the price moves against you, and take profit when the price reaches a key resistance or support level. If the price continues to move in your favor, consider trailing your stop loss order to lock in profits.
🙌By following these 5 steps, you can increase your chances of making profitable pullback trades. Remember to always manage your risk and trade with discipline.
👍92✍17❤10❤🔥10🔥10👌10🏆5😍4👏2🎉2💅2
We'll walk you through the dynamics of XAUUSD, and give tips on how to trade gold during crisis times.
Please open Telegram to view this post
VIEW IN TELEGRAM
YouTube
How to trade gold, part 2. A crash-course on trading gold during crises. XAUUSD trading strategy
Download the FBS Personal Area app:
Worldwide https://bit.ly/36qlgeC
Indonesia https://bit.ly/3qxOQFQ
Visit our website for more information: https://bit.ly/3vIzmR1
Follow us on social media:
Facebook https://bit.ly/3ELXjLm
Instagram https://bit.ly/3gO8lYW…
Worldwide https://bit.ly/36qlgeC
Indonesia https://bit.ly/3qxOQFQ
Visit our website for more information: https://bit.ly/3vIzmR1
Follow us on social media:
Facebook https://bit.ly/3ELXjLm
Instagram https://bit.ly/3gO8lYW…
❤🔥23👍11❤10👎3👏3🏆2💯1
This media is not supported in your browser
VIEW IN TELEGRAM
Smash ❤️ if yes, and share your results in the comments!
Please open Telegram to view this post
VIEW IN TELEGRAM
❤113👍18🔥8👎2😢2🐳1🏆1
#MarketNews
🕺 Happy Friday, dear traders! This week was intense, with the US dollar outperforming the market! We hope you enjoyed it! Let's see what news is moving the markets today.
😱 Vanda Research: Over the past month, retail investors have spent a record $1.51 billion per day in US equities. Such active and record buying indicates real FOMO on the part of physicists in the market.
🏦Goldman predicts three more Fed rate hikes of 0.25% in March, May, and June, with a peak rate of 5.25 - 5.5%.
🏧Banks are limiting cooperation with cryptocurrency companies due to regulatory pressure that threatens to separate the crypto from the real financial system.
😈 Traders began betting on Thursday that the Federal Reserve might hike the rate by 50 basis points at its next policy meeting in March.
🇦🇺The head of the Central Bank of Australia expects further rate hikes.
🇪🇺Stock indices of European countries have updated multi-month highs.
🇺🇸 🇨🇳 🇹🇼Top Pentagon official will visit Taiwan in the coming days amid rising tensions.
What are you going to trade today? Share your setups and help each other✌️
🏦Goldman predicts three more Fed rate hikes of 0.25% in March, May, and June, with a peak rate of 5.25 - 5.5%.
🏧Banks are limiting cooperation with cryptocurrency companies due to regulatory pressure that threatens to separate the crypto from the real financial system.
🇦🇺The head of the Central Bank of Australia expects further rate hikes.
🇪🇺Stock indices of European countries have updated multi-month highs.
What are you going to trade today? Share your setups and help each other
Please open Telegram to view this post
VIEW IN TELEGRAM
👍8🔥4❤🔥3🙏3😍3🐳2
#XAUUSD
🔥 XAUUSD might bounce!
The price stopped falling right above our target of 1820.00. Moreover, we can notice buyers joined the game around this level.
We expect a pullback toward 1828.50, and 1831.00.
🔼 Trade: BUY
🎯TP: 1828.05, 1831.00
✅ TRADE WITH FBS✅
The price stopped falling right above our target of 1820.00. Moreover, we can notice buyers joined the game around this level.
We expect a pullback toward 1828.50, and 1831.00.
🎯TP: 1828.05, 1831.00
Please open Telegram to view this post
VIEW IN TELEGRAM
❤36👍32❤🔥6✍4💯3🌚2🏆2🍾2👎1💩1😘1
The price is looking for a breakout of the descending trendline. If it does, consider opening a long position with targets at 161.70, 162.00, and 163.30.
🎯Targets: 161.70, 162.00, 163.30.
Please open Telegram to view this post
VIEW IN TELEGRAM
👍46🍾6✍5❤5🏆3❤🔥2🔥2
👍Hey, chat! Our today’s trade ideas are running well!
We are trying to give you the best options to profit.
Show some respect to FBS in the comments!
Smash some ♥️if the admin has to spend his weekends analyzing charts for you😉
We are trying to give you the best options to profit.
Show some respect to FBS in the comments!
Smash some ♥️if the admin has to spend his weekends analyzing charts for you😉
❤189🔥17👍8❤🔥6💩2🏆2
#Education
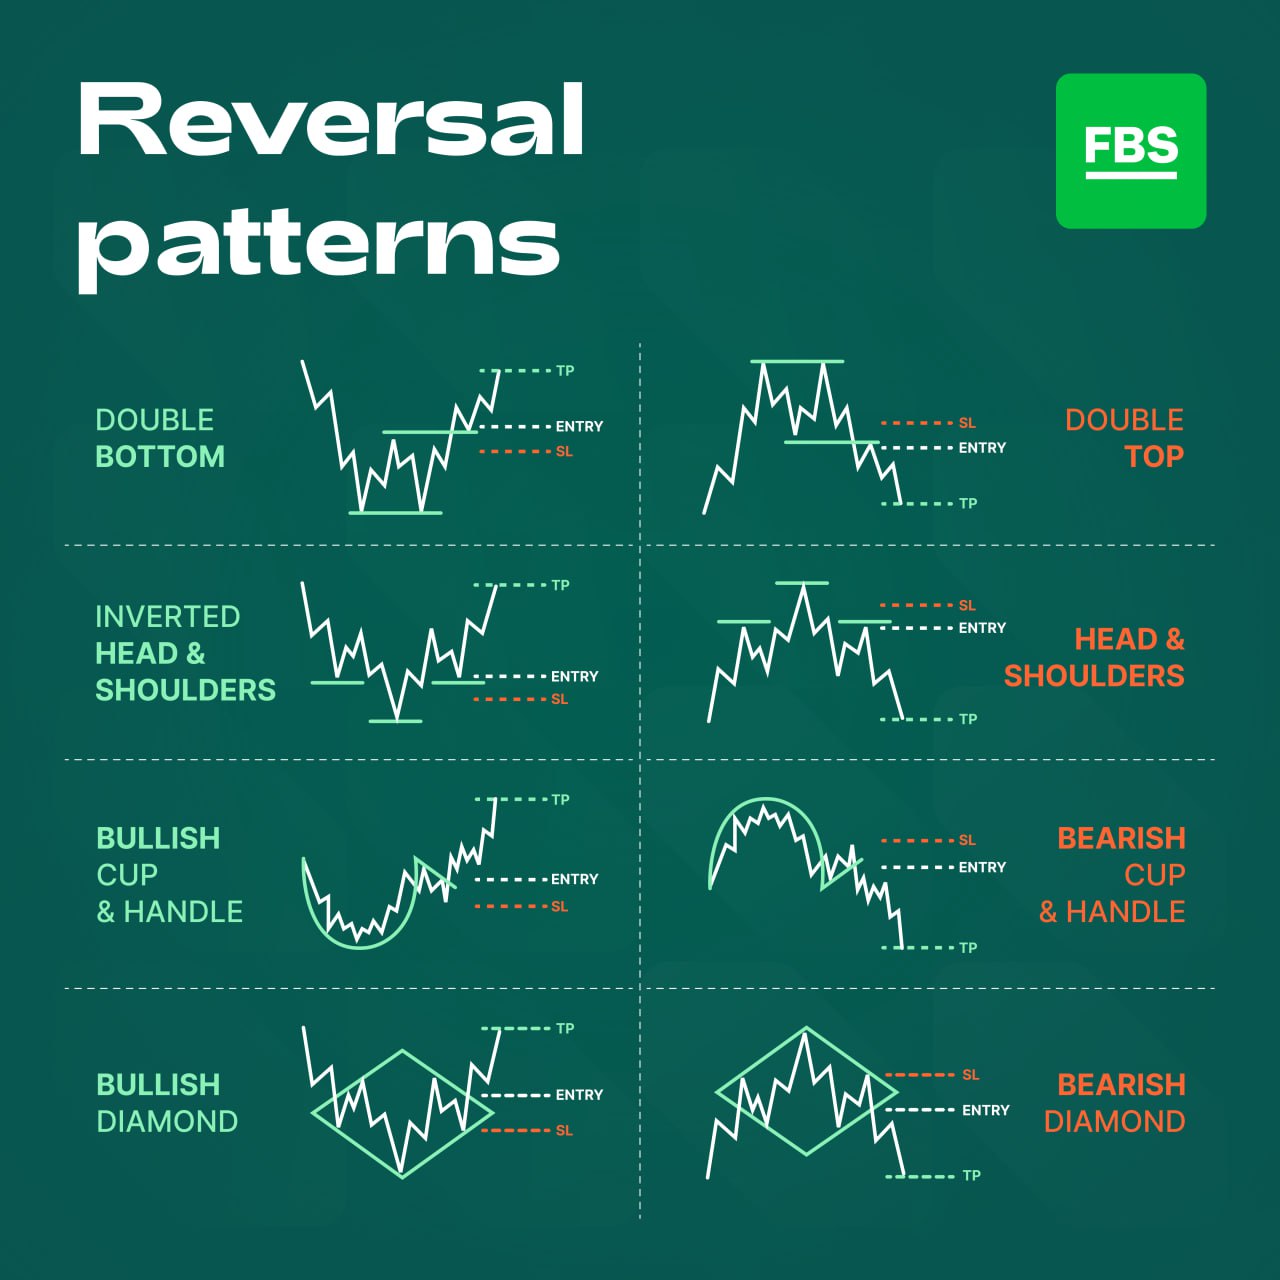
🥰Happy Saturday everyone! Today, we're going to dive into the exciting world of trading patterns! Trading patterns are like little puzzles that appear on a chart, giving traders clues as to what might happen next in the market. Let's take a look at eight common patterns and what they can tell us about the market.
📈Double Bottom
A bullish pattern that appears as two lows at approximately the same level, indicating a potential trend reversal. A breakout above the resistance level is the signal to go long.
📉Double Top
A bearish pattern that appears as two highs at approximately the same level, indicating a potential trend reversal. A breakout below the support level is the signal to go short.
📉Head and Shoulders
A bearish pattern that appears as a peak (head) with two smaller peaks (shoulders) on either side. The neckline is drawn connecting the lowest points between the peaks, and a breakout below the neckline signals a trend reversal.
📈Inverted Head and Shoulders
A bullish pattern that is the opposite of the Head and Shoulders pattern, with the peaks and troughs flipped upside down. A breakout above the neckline signals a trend reversal.
📈Bullish Cup and Handle
A bullish continuation pattern that appears as a cup with a handle. A breakout above the resistance level of the handle signals a continuation of the uptrend.
📉Bearish Cup and Handle
A bearish continuation pattern that appears as a rounded top (cup) followed by a small bounce (handle). A breakout below the support level of the handle signals a continuation of the downtrend.
📈Bullish Diamond
A bullish continuation pattern that appears as a diamond shape by connecting lower highs and higher lows. A breakout above the resistance level signals a continuation of the uptrend.
📉Bearish Diamond
A bearish continuation pattern that appears as a diamond shape by connecting higher highs and lower lows. A breakout below the support level signals a continuation of the downtrend.
There you have it - 8 common trading patterns in just 3 sentences each! If you want to learn more strategies on trading these patterns, visit our website: https://bit.ly/3xuNpv5
Happy trading, and enjoy the weekend!
🥰Happy Saturday everyone! Today, we're going to dive into the exciting world of trading patterns! Trading patterns are like little puzzles that appear on a chart, giving traders clues as to what might happen next in the market. Let's take a look at eight common patterns and what they can tell us about the market.
📈Double Bottom
A bullish pattern that appears as two lows at approximately the same level, indicating a potential trend reversal. A breakout above the resistance level is the signal to go long.
📉Double Top
A bearish pattern that appears as two highs at approximately the same level, indicating a potential trend reversal. A breakout below the support level is the signal to go short.
📉Head and Shoulders
A bearish pattern that appears as a peak (head) with two smaller peaks (shoulders) on either side. The neckline is drawn connecting the lowest points between the peaks, and a breakout below the neckline signals a trend reversal.
📈Inverted Head and Shoulders
A bullish pattern that is the opposite of the Head and Shoulders pattern, with the peaks and troughs flipped upside down. A breakout above the neckline signals a trend reversal.
📈Bullish Cup and Handle
A bullish continuation pattern that appears as a cup with a handle. A breakout above the resistance level of the handle signals a continuation of the uptrend.
📉Bearish Cup and Handle
A bearish continuation pattern that appears as a rounded top (cup) followed by a small bounce (handle). A breakout below the support level of the handle signals a continuation of the downtrend.
📈Bullish Diamond
A bullish continuation pattern that appears as a diamond shape by connecting lower highs and higher lows. A breakout above the resistance level signals a continuation of the uptrend.
📉Bearish Diamond
A bearish continuation pattern that appears as a diamond shape by connecting higher highs and lower lows. A breakout below the support level signals a continuation of the downtrend.
There you have it - 8 common trading patterns in just 3 sentences each! If you want to learn more strategies on trading these patterns, visit our website: https://bit.ly/3xuNpv5
Happy trading, and enjoy the weekend!
👍72❤18❤🔥14✍5🏆5👎4🥰3
Let's practice!
Have you noticed any of these patterns recently? Send the screenshots in the comments under the post! 🏆
Have you noticed any of these patterns recently? Send the screenshots in the comments under the post! 🏆
❤🔥40👍24❤9🥱3🤓3👎1
#MarketNews
☀️ Hello, dear traders! Here’s what you’ll encounter on your trading journey this week:
(All times are given in GGMT+2 time zone)
1️⃣ Monday:
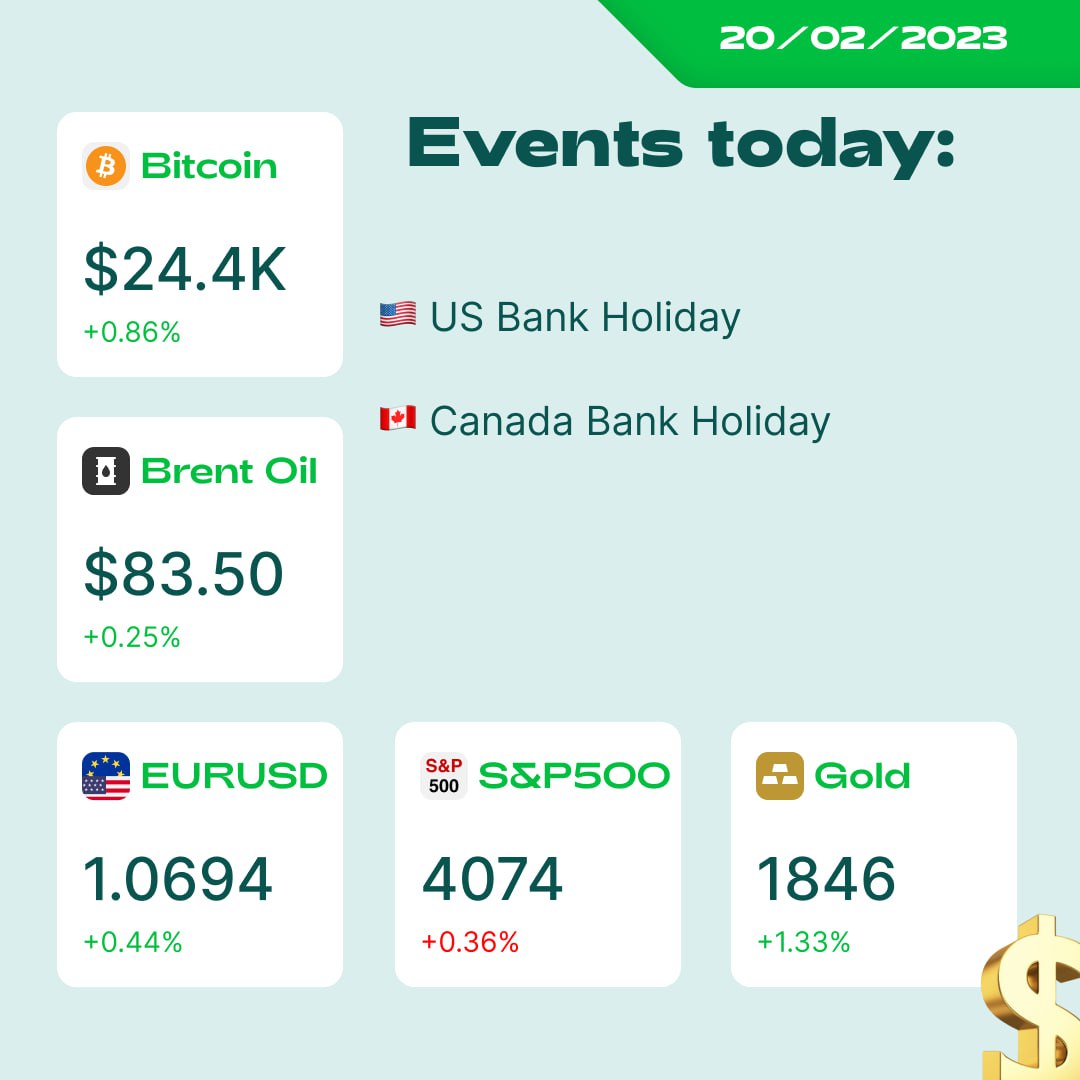
US and Canada bank holidays. Expect low liquidity and irregular volatility in USD and CAD pairs.
2️⃣ Tuesday:
10:15, French Flash Manufacturing and Services PMI
10:30, German Flash Manufacturing and Services PMI
11:30, UK Flash Manufacturing and Services PMI
15:30, Canada CPI, Median, Trimmed, and Common CPI m/m
16:45, US Flash Manufacturing Services PMI
3️⃣ Wednesday:
Day 1 of G20 Meetings
02:30, Australian Wage Price Index q/q
03:00, RBNZ Rate Statement and Cash Rate
21:00, FOMC Meeting Minutes
4️⃣ Thursday:
Day 2 of G20 Meetings
BOJ holiday
15:30, US Prelim GDP q/q
5️⃣ Friday:
Day 3 of G20 Meetings
BOJ Gov-Designate Ueda Speaks
15:30, US Core PCE Price Index m/m
💎 Also, here is news for you to feel the market sentiment:
🇨🇳 Chinese central bank (PBOC) injected $92 billion into the Chinese stock market last Friday to maintain the normal functioning of the market. Chinese stocks now may seem like a low-risk opportunity.
🇳🇿New Zealand government announces a $50 million support package for companies suffering from recent Cyclone Gabriele. NZDUSD is up 440 points.
💸 Crypto enthusiasts started to inject NFTs into the Bitcoin blockchain. Because of their actions, an average block size increased from 170MB to 340MB, making transactions more expensive.
🇬🇧 The UK Prime Minister Rishi Sunak may establish a new deal with the EU three years after Brexit. He’s opposed by his party is against such agreements.
🌐 Facebook parent company Meta Platforms is launching a subscription service called Meta Verified. You’ll get a handful of creative options for $11.99/month.
🇮🇷 It turned out Iran accumulated enriched to 84% purity uranium. This level is just below what is needed to create nuclear weapons. Iran had previously said it wouldn’t enrich uranium above 60%.
🏆 Gold bounced from $1825 and may reach $1860 in the short term. Will you trade it today?
💚Happy trading!
☀️ Hello, dear traders! Here’s what you’ll encounter on your trading journey this week:
(All times are given in GGMT+2 time zone)
1️⃣ Monday:
US and Canada bank holidays. Expect low liquidity and irregular volatility in USD and CAD pairs.
2️⃣ Tuesday:
10:15, French Flash Manufacturing and Services PMI
10:30, German Flash Manufacturing and Services PMI
11:30, UK Flash Manufacturing and Services PMI
15:30, Canada CPI, Median, Trimmed, and Common CPI m/m
16:45, US Flash Manufacturing Services PMI
3️⃣ Wednesday:
Day 1 of G20 Meetings
02:30, Australian Wage Price Index q/q
03:00, RBNZ Rate Statement and Cash Rate
21:00, FOMC Meeting Minutes
4️⃣ Thursday:
Day 2 of G20 Meetings
BOJ holiday
15:30, US Prelim GDP q/q
5️⃣ Friday:
Day 3 of G20 Meetings
BOJ Gov-Designate Ueda Speaks
15:30, US Core PCE Price Index m/m
💎 Also, here is news for you to feel the market sentiment:
🇨🇳 Chinese central bank (PBOC) injected $92 billion into the Chinese stock market last Friday to maintain the normal functioning of the market. Chinese stocks now may seem like a low-risk opportunity.
🇳🇿New Zealand government announces a $50 million support package for companies suffering from recent Cyclone Gabriele. NZDUSD is up 440 points.
💸 Crypto enthusiasts started to inject NFTs into the Bitcoin blockchain. Because of their actions, an average block size increased from 170MB to 340MB, making transactions more expensive.
🇬🇧 The UK Prime Minister Rishi Sunak may establish a new deal with the EU three years after Brexit. He’s opposed by his party is against such agreements.
🌐 Facebook parent company Meta Platforms is launching a subscription service called Meta Verified. You’ll get a handful of creative options for $11.99/month.
🇮🇷 It turned out Iran accumulated enriched to 84% purity uranium. This level is just below what is needed to create nuclear weapons. Iran had previously said it wouldn’t enrich uranium above 60%.
🏆 Gold bounced from $1825 and may reach $1860 in the short term. Will you trade it today?
💚Happy trading!
👍35🔥7❤🔥5🐳4❤3😍2
GBPJPY looks bullish!
The price is consolidating above the 100-hour moving average and it looks like buyers won't give up this support.
🎯TP: 161.70, 162.00
Please open Telegram to view this post
VIEW IN TELEGRAM
👍43❤9🔥8😭6🕊3🐳3🏆2❤🔥1👌1😍1
🇺🇸🇨🇭#USDCHF
🔥USDCHF looks bullish!
The price has formed a bullish falling wedge. Consider buying USDCHF after a breakout.
🔼 Trade: Buy USDCHF on a breakout
🎯TP: 0.9285
❌ SL: Below the recent low
Do you agree?
✅ TRADE WITH FBS✅
🔥USDCHF looks bullish!
The price has formed a bullish falling wedge. Consider buying USDCHF after a breakout.
🎯TP: 0.9285
Do you agree?
Please open Telegram to view this post
VIEW IN TELEGRAM
👍55🔥8❤🔥6👌5❤4🕊3😍3🥱2
#Education
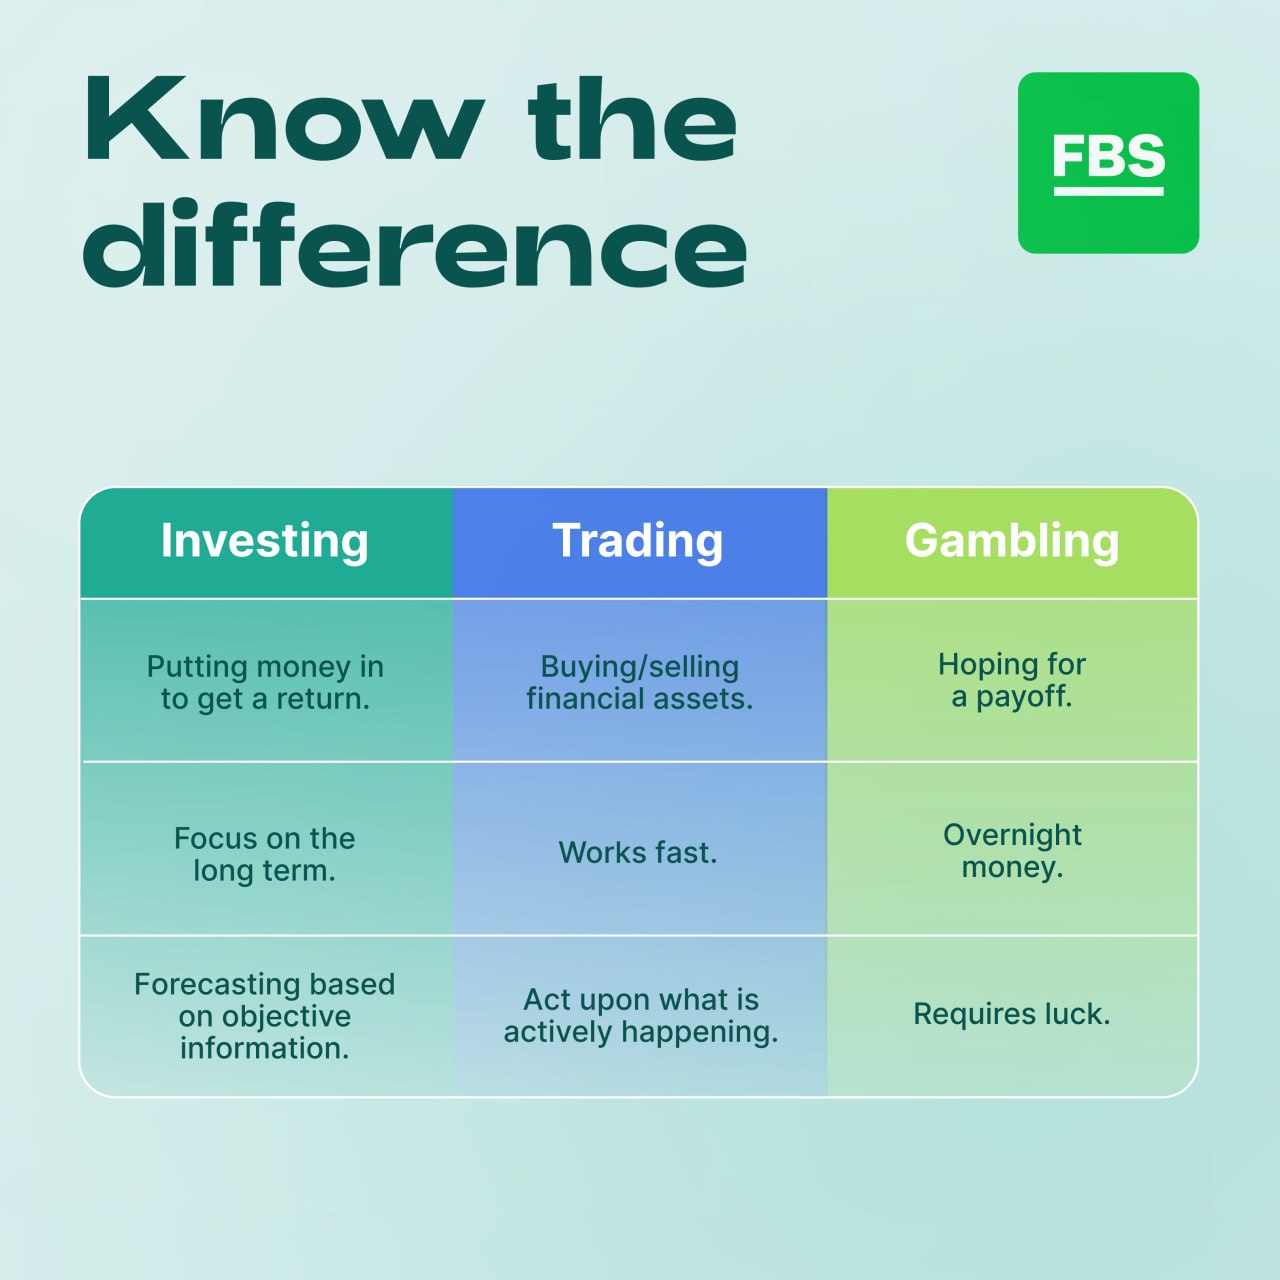
👍Know the difference!
Investing, trading, and gambling are all different ways of trying to make money, but they are not the same thing.
📈Investing involves buying and holding assets with the expectation of generating a return over a long period of time. This typically involves buying stocks, bonds, or real estate to hold onto them for several years or even decades. The goal of investing is to build wealth gradually over time, and it usually involves doing research, analyzing financial statements, and diversifying your portfolio to manage risk.
👨💻Trading is the act of buying and selling assets to make a profit in the short term. This can involve buying and selling stocks, currencies, or other financial instruments multiple times a day or week to make a quick profit. Trading requires more active management than investing and often involves using technical analysis to identify trends and patterns in the market.
🎰Gambling is the act of placing a bet or taking a risk in the hope of winning money. Unlike investing or trading, gambling is based purely on chance and luck, and there is no guarantee of a return on investment. Gambling can take many forms, including sports betting, casino games, and lottery tickets.
❗️Investing, trading, and gambling are different approaches to making money but have different goals, time horizons, and risk profiles. That's why you should never turn trading into gambling, as it might cause unwanted losses.
👍Know the difference!
Investing, trading, and gambling are all different ways of trying to make money, but they are not the same thing.
📈Investing involves buying and holding assets with the expectation of generating a return over a long period of time. This typically involves buying stocks, bonds, or real estate to hold onto them for several years or even decades. The goal of investing is to build wealth gradually over time, and it usually involves doing research, analyzing financial statements, and diversifying your portfolio to manage risk.
👨💻Trading is the act of buying and selling assets to make a profit in the short term. This can involve buying and selling stocks, currencies, or other financial instruments multiple times a day or week to make a quick profit. Trading requires more active management than investing and often involves using technical analysis to identify trends and patterns in the market.
🎰Gambling is the act of placing a bet or taking a risk in the hope of winning money. Unlike investing or trading, gambling is based purely on chance and luck, and there is no guarantee of a return on investment. Gambling can take many forms, including sports betting, casino games, and lottery tickets.
❗️Investing, trading, and gambling are different approaches to making money but have different goals, time horizons, and risk profiles. That's why you should never turn trading into gambling, as it might cause unwanted losses.
👍80❤24🔥15❤🔥6😍6🐳5✍1🥱1