
The price has formed a "cup with handle" pattern. Consider buying the pair after a breakout of the handle's upper.
🎯Target: 135.75
Please open Telegram to view this post
VIEW IN TELEGRAM
👍22❤3❤🔥3👌2👎1🔥1😍1🏆1
#MarketNews
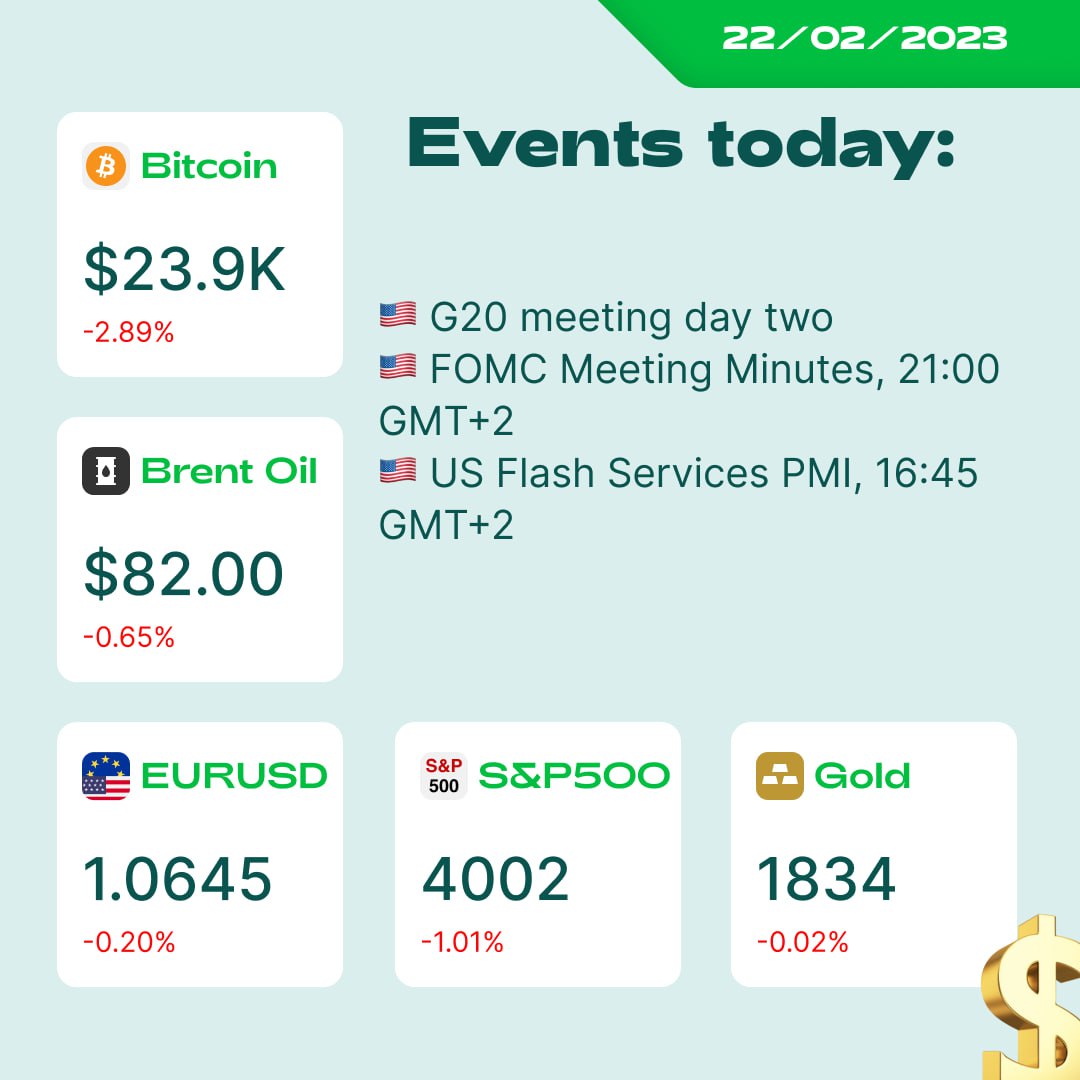
🚀 A fantastic day for trading! Markets are volatile, and we have a lot to share with you:
🇫🇷🇩🇪French and German Manufacturing and Services PMI results are mixed. Some of them are above expectations, while others are below them. EURUSD was up 500 points and down 600 points over the day.
🇬🇧 UK Flash Manufacturing and Services PMI surpassed expectations and pushed the GBPUSD pair up 1400 points.
🇨🇦Canada CPI results are below expectations, showing the BOC is on its way to success. CADJPY is down 870 points.
🇺🇸 US Flash Manufacturing and Services PMI are higher than expected. The broad market doesn’t believe that the recession will continue. Gold jumped 1000 points on the release but returned to the initial level later.
🇦🇺 RBNZ released the Cash Rate according to the expectations (a 50-basis-point increase). The bank expects a recession over a 9-12 month period. NZDUSD is falling, already down 300 points.
💸Mastercard will allow crypto payments in Web3 via USDC (a stablecoin).
🏦 Don’t miss the FOMC meeting minutes that will add volatility to gold, the USD, and other assets.
💚Have a profitable day!
🚀 A fantastic day for trading! Markets are volatile, and we have a lot to share with you:
🇫🇷🇩🇪French and German Manufacturing and Services PMI results are mixed. Some of them are above expectations, while others are below them. EURUSD was up 500 points and down 600 points over the day.
🇬🇧 UK Flash Manufacturing and Services PMI surpassed expectations and pushed the GBPUSD pair up 1400 points.
🇨🇦Canada CPI results are below expectations, showing the BOC is on its way to success. CADJPY is down 870 points.
🇺🇸 US Flash Manufacturing and Services PMI are higher than expected. The broad market doesn’t believe that the recession will continue. Gold jumped 1000 points on the release but returned to the initial level later.
🇦🇺 RBNZ released the Cash Rate according to the expectations (a 50-basis-point increase). The bank expects a recession over a 9-12 month period. NZDUSD is falling, already down 300 points.
💸Mastercard will allow crypto payments in Web3 via USDC (a stablecoin).
🏦 Don’t miss the FOMC meeting minutes that will add volatility to gold, the USD, and other assets.
💚Have a profitable day!
❤🔥19👍17❤7🔥2😍2
#education
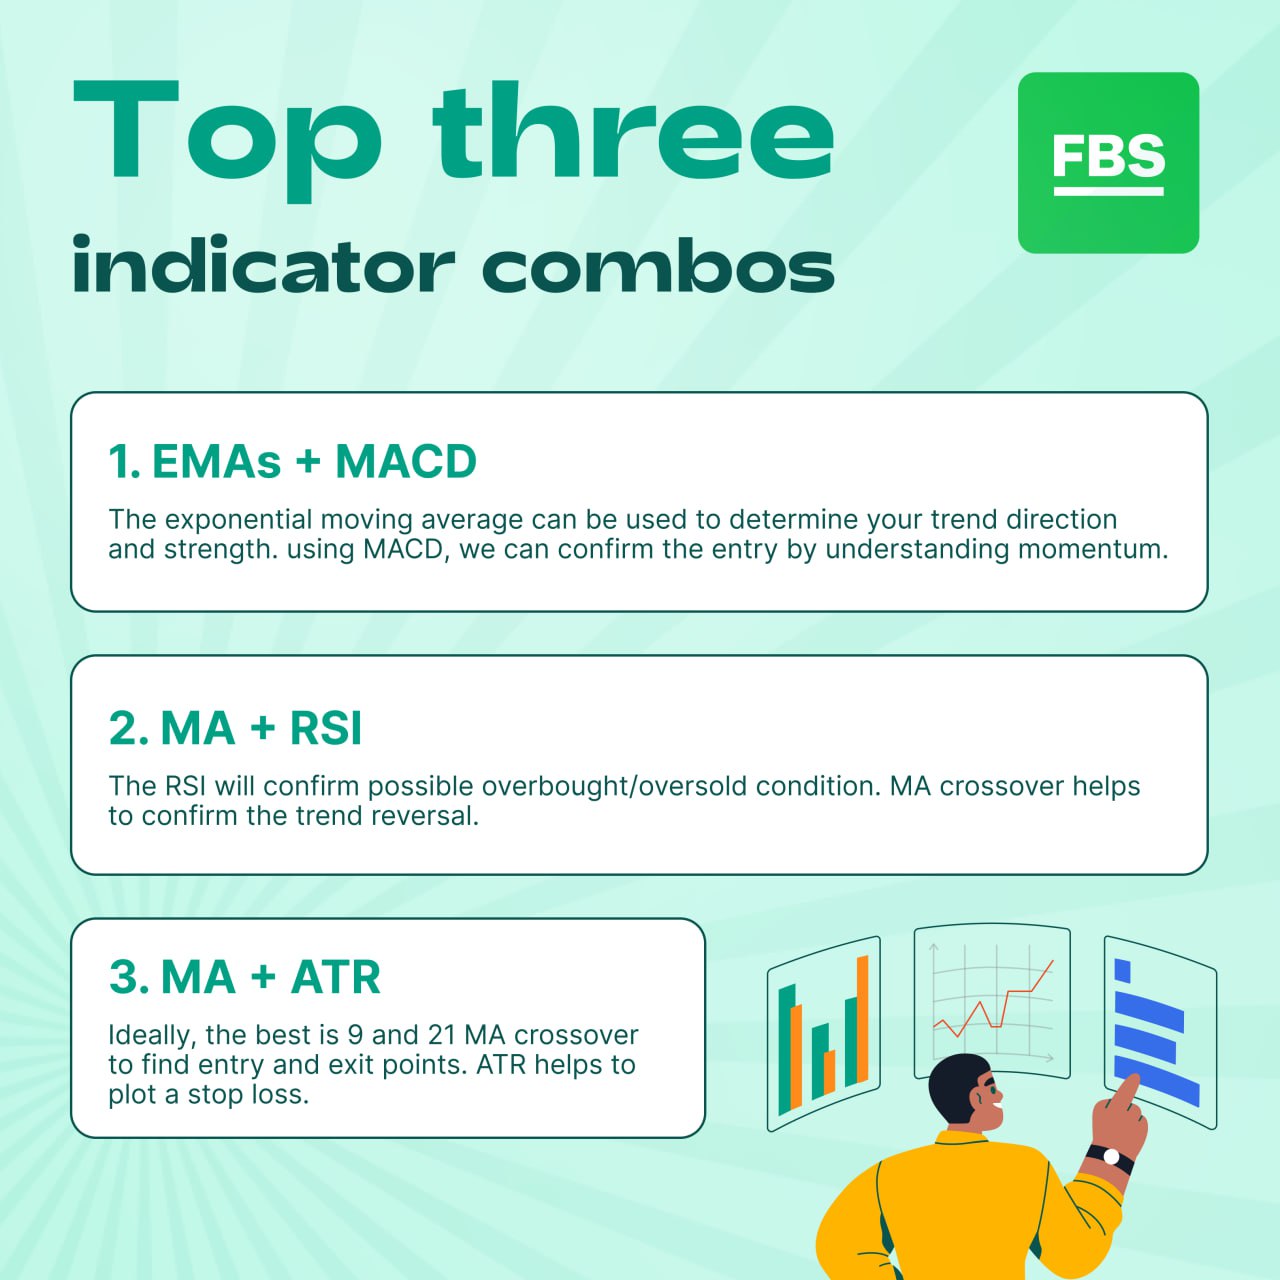
🚀One of the keys to success in trading is to use trading indicators to identify entry and exit points. Here are three indicator combos that you should try using together:
1️⃣ EMAs + MACD.
EMA is for trend indication, and the MACD is for market momentum. When you combine them, you get a powerful tool for trading! For example, it could be a good time to buy if the EMAs show an uptrend and the MACD is crossing above its signal line.
2️⃣MA + RSI.
Combining these two indicators allows you to search for perfect trend trades. If the price touches the MA from above and the RSI is below 30 (oversold zone), traders enter the Buy trade. Also, you can seek reversals with RSI.
3️⃣ MA + ATR.
ATR, or Average True Range, is a volatility indicator that can help you identify the range of price movement. The best way to find an entry point is to use 9 and 21 MAs’ crossover. ATR will help you to set and adjust your Stop Loss.
💸Combine different trading indicators, and get a more comprehensive view of market trends. Try using these indicator combos together and see if they work for you!
🤔 Do you combine indicators in your trading?
🚀One of the keys to success in trading is to use trading indicators to identify entry and exit points. Here are three indicator combos that you should try using together:
1️⃣ EMAs + MACD.
EMA is for trend indication, and the MACD is for market momentum. When you combine them, you get a powerful tool for trading! For example, it could be a good time to buy if the EMAs show an uptrend and the MACD is crossing above its signal line.
2️⃣MA + RSI.
Combining these two indicators allows you to search for perfect trend trades. If the price touches the MA from above and the RSI is below 30 (oversold zone), traders enter the Buy trade. Also, you can seek reversals with RSI.
3️⃣ MA + ATR.
ATR, or Average True Range, is a volatility indicator that can help you identify the range of price movement. The best way to find an entry point is to use 9 and 21 MAs’ crossover. ATR will help you to set and adjust your Stop Loss.
💸Combine different trading indicators, and get a more comprehensive view of market trends. Try using these indicator combos together and see if they work for you!
🤔 Do you combine indicators in your trading?
👍23❤🔥22🔥9✍5😍4🏆4🐳2
#Announcements
🔥 Did you know that we added the RSI indicator to the FBS Trader? Now you can get better insights on the market situation with this awesome indicator!
The RSI (Relative Strength Index) indicator is a powerful technical analysis tool used by traders to measure market momentum and identify potential trend reversals.
Check the pictures to see all its benefits and try it out in
✅ FBS Trader ✅
The RSI (Relative Strength Index) indicator is a powerful technical analysis tool used by traders to measure market momentum and identify potential trend reversals.
Check the pictures to see all its benefits and try it out in
Please open Telegram to view this post
VIEW IN TELEGRAM
Please open Telegram to view this post
VIEW IN TELEGRAM
👍55🔥10❤5🐳5🏆5🦄5❤🔥1💩1🍓1
#MarketNews
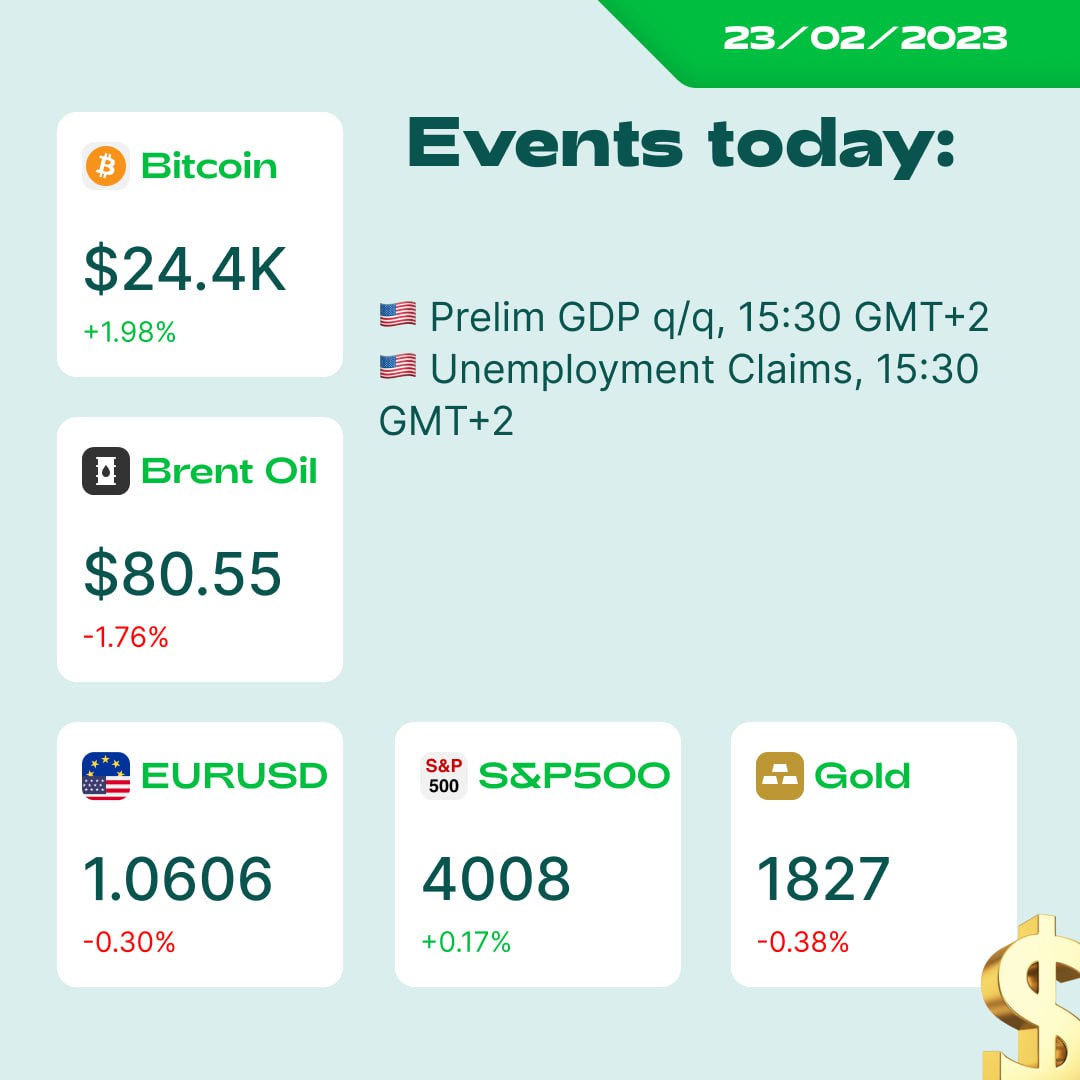
Long story short:
🏦 Fed minutes participants said that inflation in the last three months has eased, but they need to see more progress. They will increase the rate by 25 basis points at the next meeting, and they may increase the rate by 50 basis points if needed. Recession risks are still present.
📈 Indices took the FOMC meeting minutes quite positively. US500 fell 0.72% and then reversed back up. Bitcoin rose 4% from the day’s low.
🇳🇿 RBNZ’s Governor Orr: There are early indications that inflation is slowing. RBNZ expects the recession to come in the next 9-12 months.
👷♀️ Wells Fargo cuts more than 500 mortgage staff on strategy shift.
🇰🇷 The Bank of Korea paused interest-rate increases for the first time in a year and said inflation would likely decelerate slower than other economies.
🍺 Bill Gates buys a stake in Heineken for $902 million.
🔫 Finland is ready to join NATO even without Sweden. So far, Turkey continues to pose an obstacle to Sweden.
🇬🇧 BOE board said it might need to cut costs and tighten its budget.
🐦 Twitter has started testing the new payment method inside the social network. Probably, it will use “Twitter coins.” However, as Elon Musk is the CEO, he may add DOGE support soon, sending the coin to the moon.
🇨🇳 Many schools across China halted classes earlier this week to stem the spread of Covid.
💚 What do you think about the market today?
Long story short:
🏦 Fed minutes participants said that inflation in the last three months has eased, but they need to see more progress. They will increase the rate by 25 basis points at the next meeting, and they may increase the rate by 50 basis points if needed. Recession risks are still present.
📈 Indices took the FOMC meeting minutes quite positively. US500 fell 0.72% and then reversed back up. Bitcoin rose 4% from the day’s low.
🇳🇿 RBNZ’s Governor Orr: There are early indications that inflation is slowing. RBNZ expects the recession to come in the next 9-12 months.
👷♀️ Wells Fargo cuts more than 500 mortgage staff on strategy shift.
🇰🇷 The Bank of Korea paused interest-rate increases for the first time in a year and said inflation would likely decelerate slower than other economies.
🍺 Bill Gates buys a stake in Heineken for $902 million.
🔫 Finland is ready to join NATO even without Sweden. So far, Turkey continues to pose an obstacle to Sweden.
🇬🇧 BOE board said it might need to cut costs and tighten its budget.
🐦 Twitter has started testing the new payment method inside the social network. Probably, it will use “Twitter coins.” However, as Elon Musk is the CEO, he may add DOGE support soon, sending the coin to the moon.
🇨🇳 Many schools across China halted classes earlier this week to stem the spread of Covid.
💚 What do you think about the market today?
👍24🔥10❤🔥4❤3😍2👎1
🇪🇺🇺🇸 #EURUSD
🔥 EURUSD might reverse soon!
The price reached the lower border of the descending channel + the 1.0585 support level. Consider looking for buy trades around this level with the target at 1.0630.
🔼 Trade: Buy EURUSD
🎯Target: 1.0685
Are you bullish or bearish on EURUSD?
✅ TRADE WITH FBS✅
The price reached the lower border of the descending channel + the 1.0585 support level. Consider looking for buy trades around this level with the target at 1.0630.
🎯Target: 1.0685
Are you bullish or bearish on EURUSD?
Please open Telegram to view this post
VIEW IN TELEGRAM
❤🔥33👍29🔥9❤3👌3😍2🙏1
🇺🇸🇨🇭#USDCHF
🔥USDCHF might move higher!
Buyers squeeze USDCHF to the resistance level of 0.9330. If a breakout happens, the pair might quickly reach 0.9370.
❗️The trade will be active only after a breakout!
✅TRADE WITH FBS✅
🔥USDCHF might move higher!
Buyers squeeze USDCHF to the resistance level of 0.9330. If a breakout happens, the pair might quickly reach 0.9370.
❗️The trade will be active only after a breakout!
✅TRADE WITH FBS✅
👍36❤6🔥4❤🔥3
#Announcements
🤩 Now you can trade more indices, energies, and crypto assets in MetaTrader4.
US30, US100, XBRUSD, XNGUSD, and 10 more assets + 5 cryptos, including BTCUSD are available on MT4 accounts!
✅ Try it now with FBS!✅
US30, US100, XBRUSD, XNGUSD, and 10 more assets + 5 cryptos, including BTCUSD are available on MT4 accounts!
Please open Telegram to view this post
VIEW IN TELEGRAM
👍60🔥16😍11🎉9❤🔥7🐳4❤3😘1
🇬🇧🇯🇵#GBPJPY
🔥 GBPJPY looks bullish!
The pair is breaking through the descending resistance line. If the breakout confirms, the price will fly to 163.55.
Do you agree?
✅TRADE WITH FBS✅
The pair is breaking through the descending resistance line. If the breakout confirms, the price will fly to 163.55.
Do you agree?
✅TRADE WITH FBS✅
Please open Telegram to view this post
VIEW IN TELEGRAM
👍27🔥8🐳4👎3❤🔥1🏆1
#MarketNews
☀️ Happy Friday, dear traders! How is your trading week so far? Let's check the news moving the markets today:
🇺🇸Vanda Research notes a surge in bullish sentiment and retail traders' record buying of US stocks, with meme stocks in favor again. In general, everything is usually observed in an overheated market.
🏦Some of the world’s top investors are betting the USD started a multi-year decline amid hawkish Fed and roaring inflation. Some of the world’s top investors are betting the USD started a multi-year decline amid hawkish Fed and roaring inflation.
🇯🇵The Central Bank of Japan continues to buy government bonds rapidly and in record volumes. USDJPY is up by 0.4% today.
💰Sentiment in BTC: wallets with a balance of 1 000 - 100 000 BTC are selling. Wallets with a balance of 100 - 1000 BTC do nothing. Wallets with a balance of 10 - 100 BTC accumulate. The overall situation is bearish for BTCUSD.
🏦JPMorgan CEO believes the Fed may raise the key rate to 6%.
Consumer confidence in Germany remains on the path to recovery in February, with economic and income expectations showing a significant increase.Consumer confidence in Germany remains on the path to recovery in February, with economic and income expectations showing a significant increase.
🥇XAUUSD is holding the 1821.00 support. A breakout below might send gold to 1814.00.
Are you going to trade the🇺🇸 US Core PCE Price Index report today?
☀️ Happy Friday, dear traders! How is your trading week so far? Let's check the news moving the markets today:
🇺🇸Vanda Research notes a surge in bullish sentiment and retail traders' record buying of US stocks, with meme stocks in favor again. In general, everything is usually observed in an overheated market.
🏦Some of the world’s top investors are betting the USD started a multi-year decline amid hawkish Fed and roaring inflation. Some of the world’s top investors are betting the USD started a multi-year decline amid hawkish Fed and roaring inflation.
🇯🇵The Central Bank of Japan continues to buy government bonds rapidly and in record volumes. USDJPY is up by 0.4% today.
💰Sentiment in BTC: wallets with a balance of 1 000 - 100 000 BTC are selling. Wallets with a balance of 100 - 1000 BTC do nothing. Wallets with a balance of 10 - 100 BTC accumulate. The overall situation is bearish for BTCUSD.
🏦JPMorgan CEO believes the Fed may raise the key rate to 6%.
Consumer confidence in Germany remains on the path to recovery in February, with economic and income expectations showing a significant increase.Consumer confidence in Germany remains on the path to recovery in February, with economic and income expectations showing a significant increase.
🥇XAUUSD is holding the 1821.00 support. A breakout below might send gold to 1814.00.
Are you going to trade the
Please open Telegram to view this post
VIEW IN TELEGRAM
👍36❤3🐳2
🇪🇺🇺🇸#EURUSD
🔥 EURUSD looks bullish!
Buyers are successfully holding the 1.0585 support level so far. Thus, we suggest looking for buy trades here with the target at 1.0630. If the price breaks above 1.0630, it will move to 1.0665.
🔼 Trade: Buy EURUSD
🎯Target: 1.0630, 1.0665
❌ SL: below 1.0573
✅ TRADE WITH FBS✅
Buyers are successfully holding the 1.0585 support level so far. Thus, we suggest looking for buy trades here with the target at 1.0630. If the price breaks above 1.0630, it will move to 1.0665.
🎯Target: 1.0630, 1.0665
Please open Telegram to view this post
VIEW IN TELEGRAM
👍23🔥6❤5🥰3👎2
The price is located below the dynamic trendline. Consolidation is not the best time to open a trade. Therefore, we see two probable options for you
🎯 Target: $1800
Please open Telegram to view this post
VIEW IN TELEGRAM
🔥43👍24👎6❤3😍3🐳3❤🔥2🤔2🤯2🥱1🏆1
📍 Checklist for traders
⤵️ Trading Forex can seem complex, especially if you’re a beginner. To help you out, FBS analysts have created a checklist.
🎞 Watch the video to know what to do when trading and to download a checklist
https://bit.ly/3SwqNUE
⤵️ Trading Forex can seem complex, especially if you’re a beginner. To help you out, FBS analysts have created a checklist.
https://bit.ly/3SwqNUE
Please open Telegram to view this post
VIEW IN TELEGRAM
YouTube
How to Start Forex Trading. Checklist for Beginner Traders
DOWNLOAD THE BEGINNER TRADER CHECKLIST FOR FREE HERE: https://bit.ly/3SdZflz
Download the FBS Personal Area app:
Worldwide https://bit.ly/36qlgeC
Indonesia https://bit.ly/3qxOQFQ
Visit our website for more information: https://bit.ly/3vIzmR1
Follow us…
Download the FBS Personal Area app:
Worldwide https://bit.ly/36qlgeC
Indonesia https://bit.ly/3qxOQFQ
Visit our website for more information: https://bit.ly/3vIzmR1
Follow us…
👍26🔥5❤🔥3✍2🐳2❤1⚡1😍1
US stocks are in danger
⚠️ This movement may pull gold and the EUR down, too!
Please open Telegram to view this post
VIEW IN TELEGRAM
❤🔥38👍28🔥8🐳6🤪5🏆3✍2💩2
#education
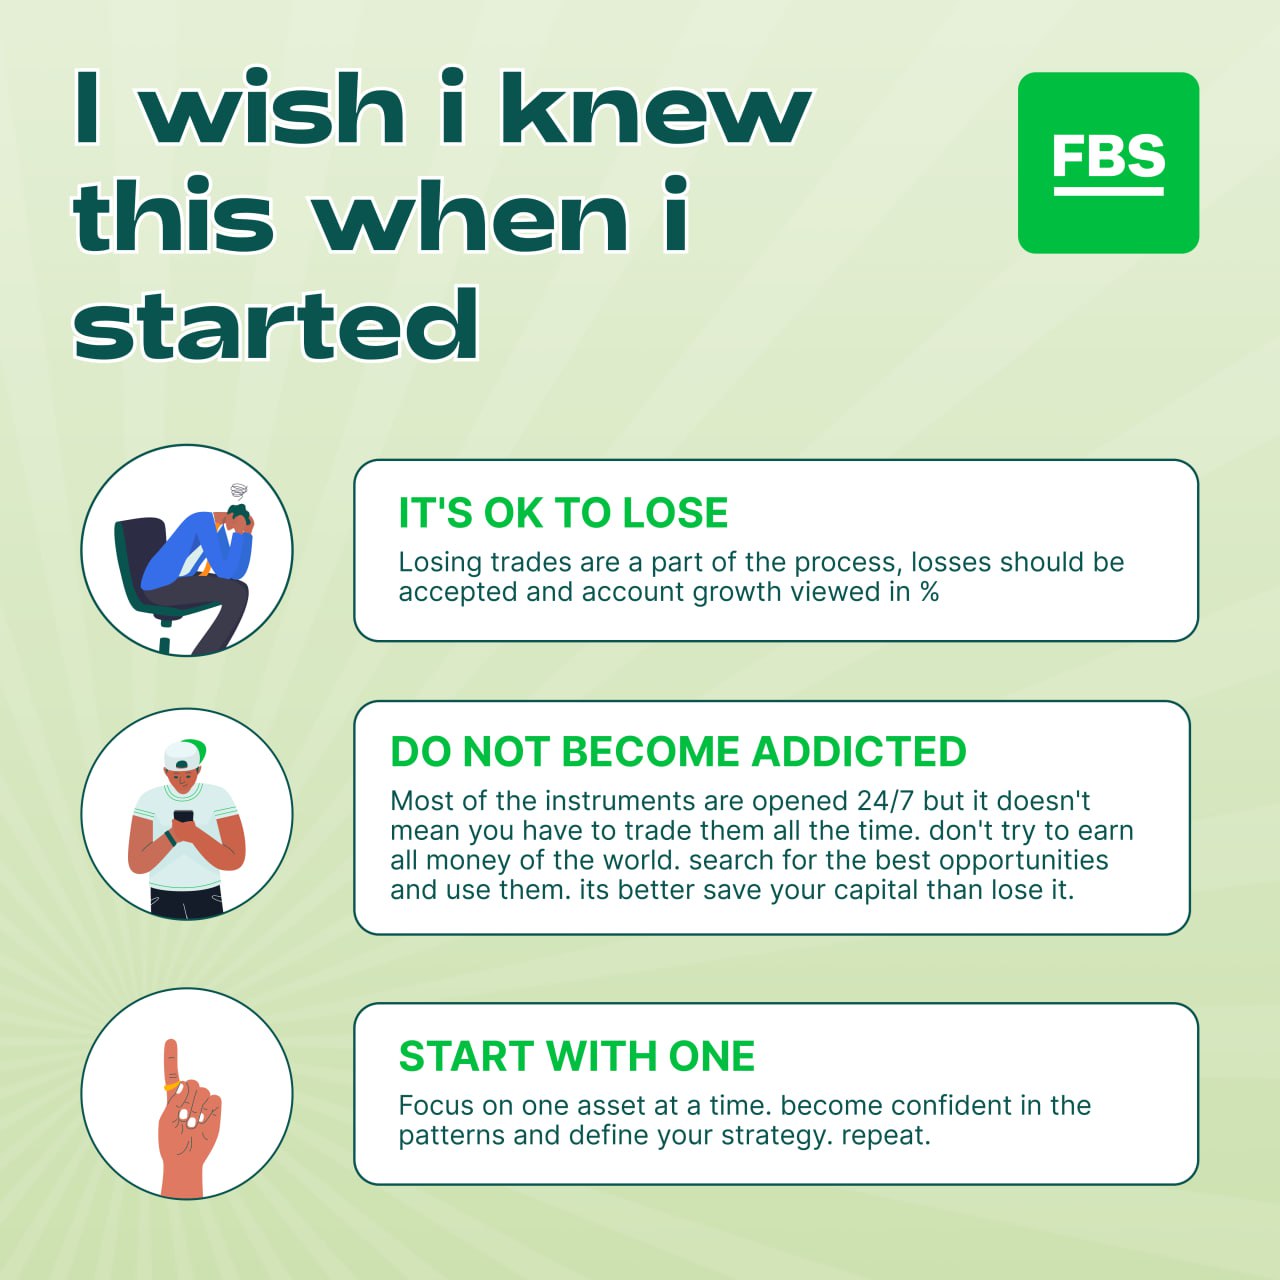
Even though FBS analysts feel confident in the market, it wasn't like that forever. We had our ups and downs, too. In this post, we share three things we wish we had known at the beginning of our journey.
1️⃣ It's okay to lose: Trading forex comes with inherent risks, and no one can win every trade. Losses are part of the game! Instead of focusing solely on avoiding losses, develop your psychology and risk management strategies to minimize losses and maximize gains. Accept losses as a natural part of trading and learn from them.
2️⃣ Do not become addicted to trading: Trading is often emotional, and emotions lead to addiction. In turn, addiction leads to impulsive decision-making, excessive trading, and, ultimately, significant losses. It's essential to take breaks, enjoy hobbies outside of trading, and not check the charts when it's not your trading time.
3️⃣ Start with one: Forex trading can be complex, and it's easy to get overwhelmed when starting. Try to focus on one asset or currency pair at a time and understand its movements and patterns. This approach will give you confidence and better results. Once you master one asset, expand your portfolio further.
❓ What things about trading you wish you had known at the start?
Even though FBS analysts feel confident in the market, it wasn't like that forever. We had our ups and downs, too. In this post, we share three things we wish we had known at the beginning of our journey.
1️⃣ It's okay to lose: Trading forex comes with inherent risks, and no one can win every trade. Losses are part of the game! Instead of focusing solely on avoiding losses, develop your psychology and risk management strategies to minimize losses and maximize gains. Accept losses as a natural part of trading and learn from them.
2️⃣ Do not become addicted to trading: Trading is often emotional, and emotions lead to addiction. In turn, addiction leads to impulsive decision-making, excessive trading, and, ultimately, significant losses. It's essential to take breaks, enjoy hobbies outside of trading, and not check the charts when it's not your trading time.
3️⃣ Start with one: Forex trading can be complex, and it's easy to get overwhelmed when starting. Try to focus on one asset or currency pair at a time and understand its movements and patterns. This approach will give you confidence and better results. Once you master one asset, expand your portfolio further.
❓ What things about trading you wish you had known at the start?
👍65❤18🔥5❤🔥4🐳3🏆2🍓2🦄2😁1😍1
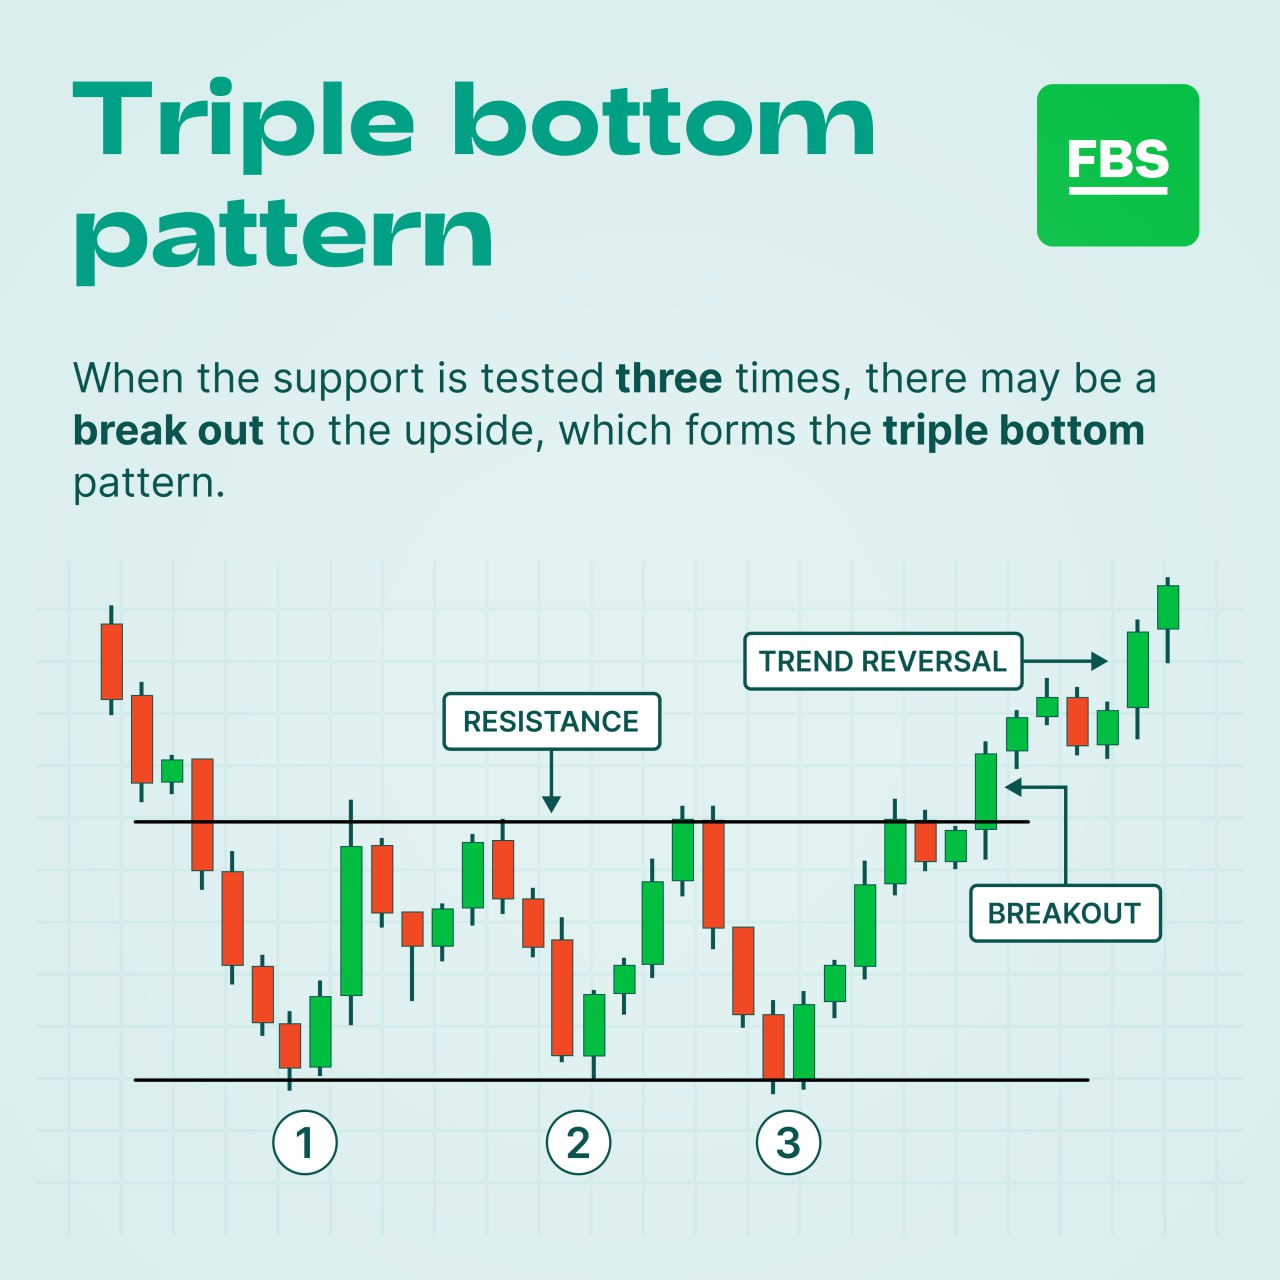
📈Triple bottom pattern📈
👆A triple bottom is a visual pattern that shows the buyers (bulls) taking control of the price action from the sellers (bears). Here's a five-step guide on how to trade a triple bottom pattern:
✅Step 1: Identify the pattern
The first step is identifying a triple bottom pattern on a price chart. A triple bottom is a bullish reversal pattern that forms after a downtrend. It consists of three lows that are roughly equal in price, with the middle low being the lowest. The pattern is confirmed when the price breaks above the resistance level formed by the highs between the three lows.
✅Step 2: Confirm the pattern
Once you have identified a potential triple bottom pattern, it's essential to confirm it by analyzing other technical indicators, such as the relative strength index (RSI) or moving averages. Look for a bullish divergence between the price and the indicator, which indicates that the price may reverse higher.
✅Step 3: Set your entry point
The next step is to set your entry point. You should enter the trade once the price breaks above the resistance level formed by the highs between the three lows. It's crucial to wait for the breakout confirmation to ensure the pattern is valid.
✅Step 4: Set your stop loss and take profit levels
Set your stop loss level below the lowest point of the pattern. This will limit your potential losses if the price moves against you. Set your take profit level at least equal to the distance between the resistance level and the lowest point of the pattern.
✅Step 5: Monitor the trade
Once you have entered the trade, monitor it closely. Look for signs of a reversal, such as a bearish divergence between the price and the RSI. If the price moves in your favor, consider trailing your stop loss to lock in profits and protect against losses.
❗️Remember that trading is risky, and no strategy can guarantee profits. It's essential to manage your risk carefully and clearly understand your trading plan before entering any trades.
👆A triple bottom is a visual pattern that shows the buyers (bulls) taking control of the price action from the sellers (bears). Here's a five-step guide on how to trade a triple bottom pattern:
✅Step 1: Identify the pattern
The first step is identifying a triple bottom pattern on a price chart. A triple bottom is a bullish reversal pattern that forms after a downtrend. It consists of three lows that are roughly equal in price, with the middle low being the lowest. The pattern is confirmed when the price breaks above the resistance level formed by the highs between the three lows.
✅Step 2: Confirm the pattern
Once you have identified a potential triple bottom pattern, it's essential to confirm it by analyzing other technical indicators, such as the relative strength index (RSI) or moving averages. Look for a bullish divergence between the price and the indicator, which indicates that the price may reverse higher.
✅Step 3: Set your entry point
The next step is to set your entry point. You should enter the trade once the price breaks above the resistance level formed by the highs between the three lows. It's crucial to wait for the breakout confirmation to ensure the pattern is valid.
✅Step 4: Set your stop loss and take profit levels
Set your stop loss level below the lowest point of the pattern. This will limit your potential losses if the price moves against you. Set your take profit level at least equal to the distance between the resistance level and the lowest point of the pattern.
✅Step 5: Monitor the trade
Once you have entered the trade, monitor it closely. Look for signs of a reversal, such as a bearish divergence between the price and the RSI. If the price moves in your favor, consider trailing your stop loss to lock in profits and protect against losses.
❗️Remember that trading is risky, and no strategy can guarantee profits. It's essential to manage your risk carefully and clearly understand your trading plan before entering any trades.
👍38❤🔥17❤10✍2🥰2🏆1
👋Let's practice!
Have you noticed a triple bottom pattern on the charts? Or have you noticed any other patterns recently?
Share the screenshots of your technical analysis in the comments under the post, helping each other to achieve the results! 🏆
Have you noticed a triple bottom pattern on the charts? Or have you noticed any other patterns recently?
Share the screenshots of your technical analysis in the comments under the post, helping each other to achieve the results! 🏆
🔥18👍7🐳5❤4🥱1