
#MarketNews
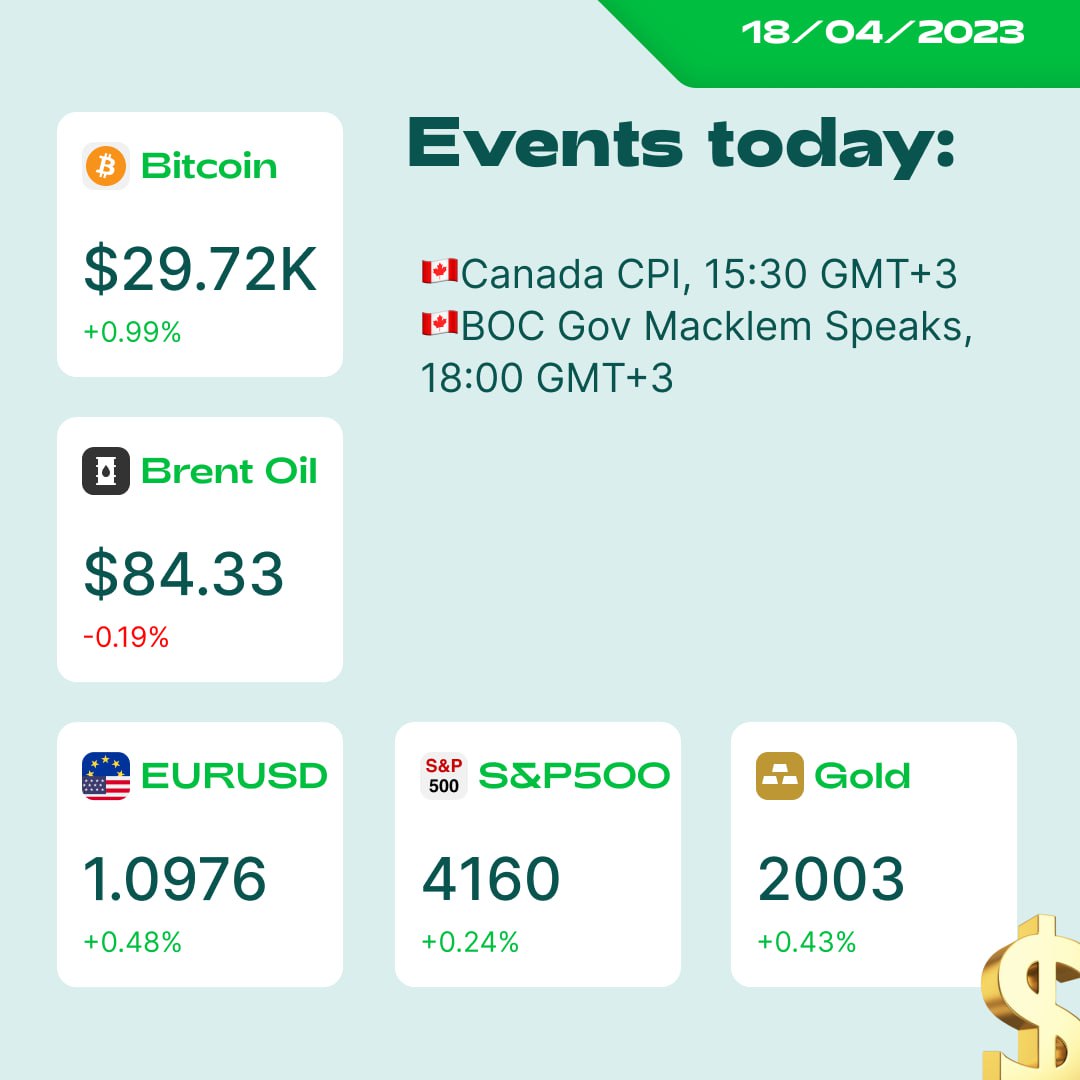
☀️Happy Tuesday, dear traders! Let's check what news is moving the markets right now!
🇨🇳JPMorgan raised its forecast for China's GDP growth in 2023 to 6.4% from 6% earlier.
☣️Today, the head of the SEC will speak in front of the US Congress about regulating cryptocurrencies. According to the prepared text, he plans to repeat the thesis that crypto needs to be regulated like securities.
🇨🇳According to the International Monetary Fund, China will become the largest driver of global economic growth in the next five years, two times the contribution of the US economy.
🏦Morgan Stanley: the crisis has begun as banks cut lending to record levels.
📈Alphabet (GOOGLE) lost $55 billion in market value after Samsung said it wanted to replace Google with Bing on its phones.
🤖Elon Musk wants to launch an alternative to ChatGPT for finding the truth and exploring the universe - TruthGPT.
Do you want to get an analysis on USDJPY?
➡️Read the report: https://bit.ly/41dbNym
☀️Happy Tuesday, dear traders! Let's check what news is moving the markets right now!
🇨🇳JPMorgan raised its forecast for China's GDP growth in 2023 to 6.4% from 6% earlier.
☣️Today, the head of the SEC will speak in front of the US Congress about regulating cryptocurrencies. According to the prepared text, he plans to repeat the thesis that crypto needs to be regulated like securities.
🇨🇳According to the International Monetary Fund, China will become the largest driver of global economic growth in the next five years, two times the contribution of the US economy.
🏦Morgan Stanley: the crisis has begun as banks cut lending to record levels.
📈Alphabet (GOOGLE) lost $55 billion in market value after Samsung said it wanted to replace Google with Bing on its phones.
🤖Elon Musk wants to launch an alternative to ChatGPT for finding the truth and exploring the universe - TruthGPT.
Do you want to get an analysis on USDJPY?
➡️Read the report: https://bit.ly/41dbNym
👍47❤7❤🔥4🔥3🌭2✍1🌚1
#XAUUSD
➡️ TRADE WITH FBS
Please open Telegram to view this post
VIEW IN TELEGRAM
👍81❤🔥17❤15🔥6⚡5🌚4😍3🐳3🤩2💩2🥴1
This media is not supported in your browser
VIEW IN TELEGRAM
#stocks
🔥Earnings season goes on🔥
🚀Bank of America (BAC) and Johson&Johnson (JNJ) reported revenue growth🚀
🏦BAC earned 26.3B VS 25.25B in the forecast
💊JNJ earned 24.7B VS 23.61B in the forecast
On the pre-market stocks, prices are growing📈
🧐And we are waiting for the reports from Netflix and Goldman Sachs (GS)💶
✅ TRADE WITH FBS ✅
🔥Earnings season goes on🔥
🚀Bank of America (BAC) and Johson&Johnson (JNJ) reported revenue growth🚀
🏦BAC earned 26.3B VS 25.25B in the forecast
💊JNJ earned 24.7B VS 23.61B in the forecast
On the pre-market stocks, prices are growing📈
🧐And we are waiting for the reports from Netflix and Goldman Sachs (GS)💶
✅ TRADE WITH FBS ✅
👍34❤10❤🔥5🔥4⚡2😍2
#EURUSD
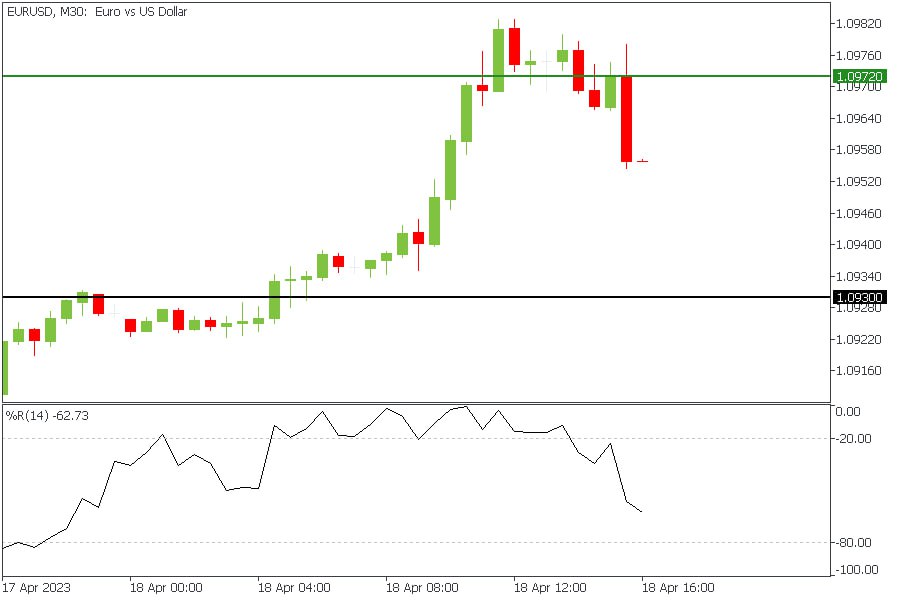
🏠Building permits in the US were released lower than expected. The fact was +1.413M VS 1.450M in the forecast📉
🏠Housing starts slightly increased in March 📈
📉EURUSD started falling and went below 1.0972 again📉
The movement down🔻 may continue.
🤔Do you trade EURUSD?
✅ TRADE WITH FBS ✅
🏠Building permits in the US were released lower than expected. The fact was +1.413M VS 1.450M in the forecast📉
🏠Housing starts slightly increased in March 📈
📉EURUSD started falling and went below 1.0972 again📉
The movement down🔻 may continue.
🤔Do you trade EURUSD?
✅ TRADE WITH FBS ✅
❤26👍20✍4❤🔥2⚡1🔥1
#Education
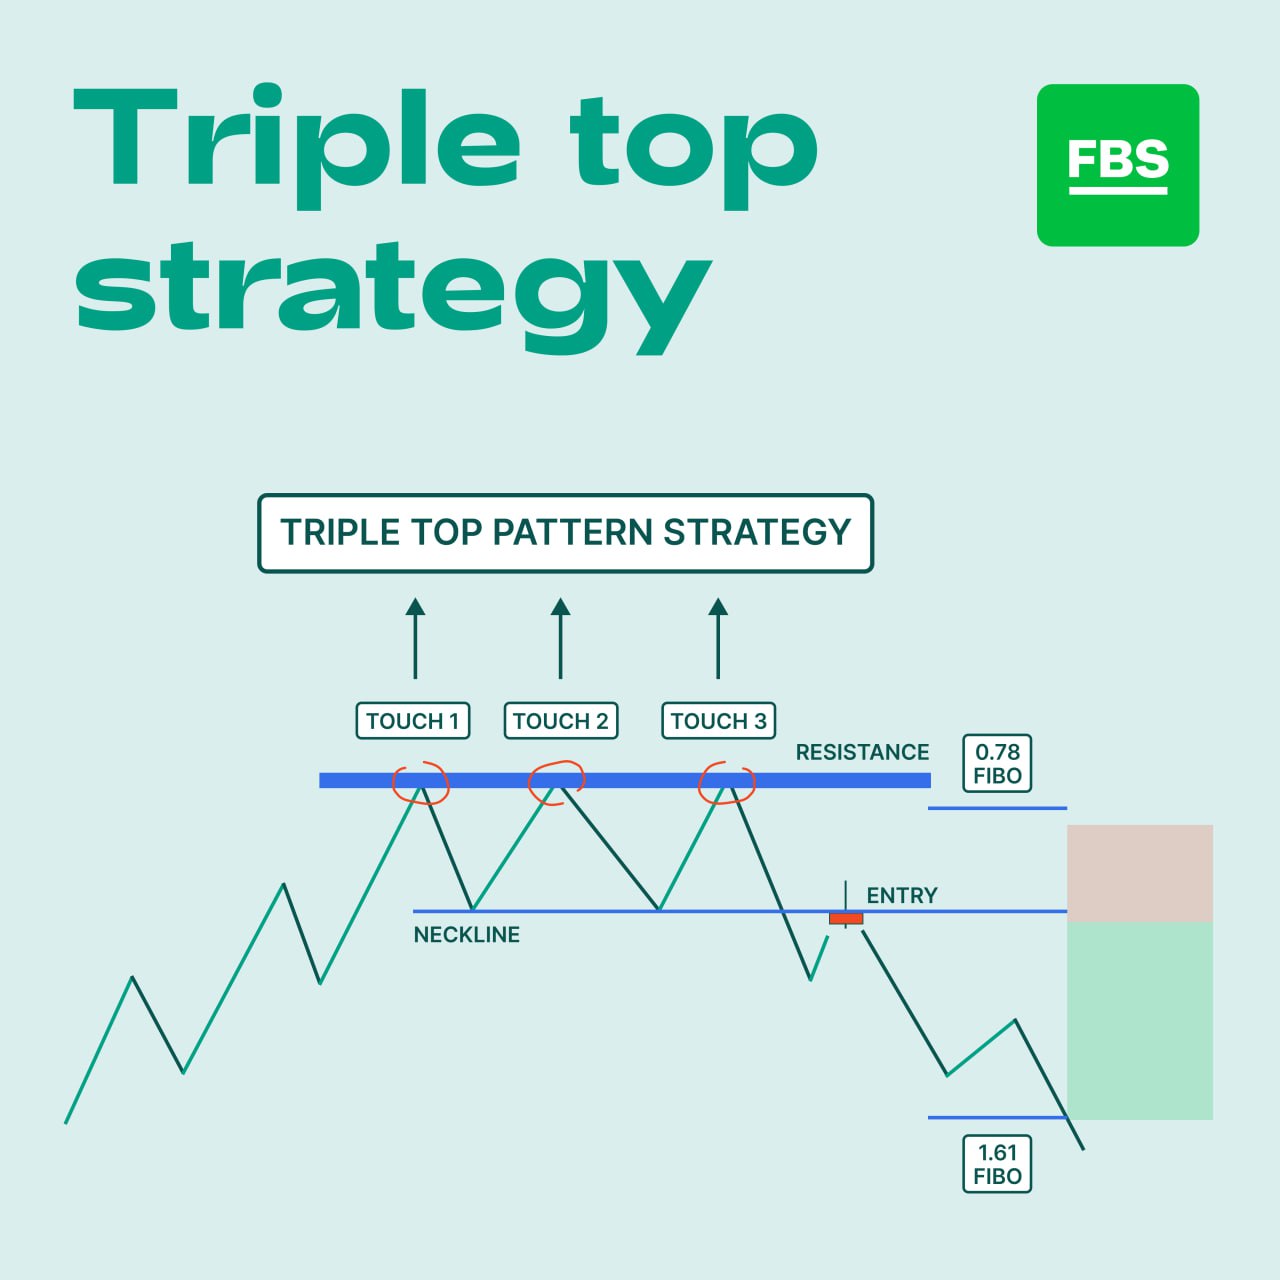
🔝Looking for a powerful strategy to boost your trading? Look no further! Introducing the Triple Top Strategy combined with Fibonacci retracement, a winning combination for identifying trend reversals and maximizing your profits!
The Triple Top pattern is a technical chart pattern that signals a potential trend reversal from bullish to bearish. It occurs when an asset's price reaches a resistance level three times, forming three consecutive peaks at nearly the same level. This pattern suggests that buyers are struggling to push the price higher, and sellers may take control soon.
But that's not all! By combining the Triple Top pattern with Fibonacci retracement, you can enhance your trading strategy even further. Fibonacci retracement is a powerful tool that helps identify potential support and resistance levels based on the Fibonacci sequence, a mathematical pattern found in nature and financial markets.
Here's how you can use this powerful combination:
1️⃣ Identify an uptrend on the chart and notice a Triple Top pattern's formation.
2️⃣ Use Fibonacci retracement to draw retracement levels from the highest point.
3️⃣ Wait for the third peak to be confirmed after the price crosses 0.78 Fibo level.
4️⃣ Enter the market when the price breaks below the neckline of the Triple Top pattern and retests it.
5️⃣Close your position when the price reaches the 1.61 Fibo level.
If you want to learn more about Fibonacci tools, visit our website: https://bit.ly/3KJEJXJ
🔝Looking for a powerful strategy to boost your trading? Look no further! Introducing the Triple Top Strategy combined with Fibonacci retracement, a winning combination for identifying trend reversals and maximizing your profits!
The Triple Top pattern is a technical chart pattern that signals a potential trend reversal from bullish to bearish. It occurs when an asset's price reaches a resistance level three times, forming three consecutive peaks at nearly the same level. This pattern suggests that buyers are struggling to push the price higher, and sellers may take control soon.
But that's not all! By combining the Triple Top pattern with Fibonacci retracement, you can enhance your trading strategy even further. Fibonacci retracement is a powerful tool that helps identify potential support and resistance levels based on the Fibonacci sequence, a mathematical pattern found in nature and financial markets.
Here's how you can use this powerful combination:
1️⃣ Identify an uptrend on the chart and notice a Triple Top pattern's formation.
2️⃣ Use Fibonacci retracement to draw retracement levels from the highest point.
3️⃣ Wait for the third peak to be confirmed after the price crosses 0.78 Fibo level.
4️⃣ Enter the market when the price breaks below the neckline of the Triple Top pattern and retests it.
5️⃣Close your position when the price reaches the 1.61 Fibo level.
If you want to learn more about Fibonacci tools, visit our website: https://bit.ly/3KJEJXJ
❤49👍40🔥9✍6❤🔥4👏2
🐸 It’s Wednesday, traders! Here’s what we follow:
🇨🇦 Canada’s CPI turned out to be mixed. CPI is 0.5% vs. 0.6%; Median CPI is 0.1% above; Trimmed CPI is as expected, and Common CPI is 0.1% below. NZDCAD fell by 170 points.
🚗 Tesla cut prices in the US for the sixth time this year.
🇬🇧 UK annual inflation is still double-digit. The reading is at 10.1% vs. the 9.8% expected. GBPUSD is up 500 points.
🎬 Netflix shares lost 12% due to low revenue forecast for Q2 2023. They reversed back up very fast, though.
⛽️ Natural gas prices in the US (XNGUSD) rose 21% from their bottom and reached $2.50.
📈 For the first time since 1945, US stocks are trying to ignore the risk of the recession.
💸 Bitcoin whales started buying again. They bought 20 000 BTC over the last two days.
👨💻 Meta prepares new layoffs in Facebook, WhatsApp, and Instagram.
🐶 Tomorrow is International DOGE Day. All the Dogecoin community is waiting for a DOGE pump.
🏆 Gold is falling to the support of $1986. The breakout will open a road to $1978.
Find our daily trading signal here:
➡️ https://bit.ly/40jEIzI
Happy trading!
🇨🇦 Canada’s CPI turned out to be mixed. CPI is 0.5% vs. 0.6%; Median CPI is 0.1% above; Trimmed CPI is as expected, and Common CPI is 0.1% below. NZDCAD fell by 170 points.
🚗 Tesla cut prices in the US for the sixth time this year.
🇬🇧 UK annual inflation is still double-digit. The reading is at 10.1% vs. the 9.8% expected. GBPUSD is up 500 points.
🎬 Netflix shares lost 12% due to low revenue forecast for Q2 2023. They reversed back up very fast, though.
⛽️ Natural gas prices in the US (XNGUSD) rose 21% from their bottom and reached $2.50.
📈 For the first time since 1945, US stocks are trying to ignore the risk of the recession.
💸 Bitcoin whales started buying again. They bought 20 000 BTC over the last two days.
👨💻 Meta prepares new layoffs in Facebook, WhatsApp, and Instagram.
🐶 Tomorrow is International DOGE Day. All the Dogecoin community is waiting for a DOGE pump.
🏆 Gold is falling to the support of $1986. The breakout will open a road to $1978.
Find our daily trading signal here:
➡️ https://bit.ly/40jEIzI
Happy trading!

❤31👍25❤🔥7🔥6⚡2😍2🎉1
🇺🇸🇨🇦#USDCAD
🔥 USDCAD is bullish!
The price broke above the resistance trendline on the H4 timeframe. Now, if the price declines for a retest of this breakout we can look for buy trades inside the 1.3388 - 1.3414 support range.
The major short term target for USDCAD is 1.3550.
Do you agree?
✅ TRADE WITH FBS ✅
The price broke above the resistance trendline on the H4 timeframe. Now, if the price declines for a retest of this breakout we can look for buy trades inside the 1.3388 - 1.3414 support range.
The major short term target for USDCAD is 1.3550.
Do you agree?
✅ TRADE WITH FBS ✅
Please open Telegram to view this post
VIEW IN TELEGRAM
❤40👍33🔥7🌚5🏆4👎3
🇺🇸#US500
🔥 The US500 might fall shortly!
S&P500 (US500) reached the resistance block around 4170.00. We noticed sellers are trying to defend this level as the price already shows signs of a potential reversal.
Thus, swing traders might consider selling the index around 4170.00, with the closest target at 3800.00.
What will be the lowest point for US500 in 2023? What do you think?
✅ TRADE WITH FBS ✅
S&P500 (US500) reached the resistance block around 4170.00. We noticed sellers are trying to defend this level as the price already shows signs of a potential reversal.
Thus, swing traders might consider selling the index around 4170.00, with the closest target at 3800.00.
What will be the lowest point for US500 in 2023? What do you think?
✅ TRADE WITH FBS ✅
Please open Telegram to view this post
VIEW IN TELEGRAM
👍35🔥8❤6✍4⚡3❤🔥2
How many trades do you usually open every day?
Anonymous Poll
10%
Less than 1 trade per day
28%
1-2 trades
28%
3-5 trades
14%
5-10 trades
8%
10-15 trades
12%
More than 15 trades per day
❤72⚡14👍10🆒7❤🔥6👎6✍3🦄1
🥇#XAUUSD
🔥XAUUSD is aiming for the breakout!
The price has formed an inverse rising wedge, which is usually a bullish pattern. Moreover, we notice a massive resistance block between 2006.00 and 2010.00.
We believe XAUUSD will break above this resistance soon. Thus, we suggest you look for buy trades with a target of 2032.00 after this breakout.
🔼Trade: Buy XAUUSD
😉Entry: After the breakout above the 2006.00 - 2010.00 resistance range
🎯TP: 2032.00
What is your analysis of XAUUSD?
✅ TRADE WITH FBS ✅
🔥XAUUSD is aiming for the breakout!
The price has formed an inverse rising wedge, which is usually a bullish pattern. Moreover, we notice a massive resistance block between 2006.00 and 2010.00.
We believe XAUUSD will break above this resistance soon. Thus, we suggest you look for buy trades with a target of 2032.00 after this breakout.
🔼Trade: Buy XAUUSD
😉Entry: After the breakout above the 2006.00 - 2010.00 resistance range
🎯TP: 2032.00
What is your analysis of XAUUSD?
✅ TRADE WITH FBS ✅
👍73❤18✍4🐳4🔥3🌚2❤🔥1🌭1
Share your views on the markets in the comments and leave a
For more analytics, visit the FBS website: https://bit.ly/3N05iLc
Please open Telegram to view this post
VIEW IN TELEGRAM
👍39❤19🔥8❤🔥6💯2🦄2😍1
☣️#BTCUSD
🔥 BTCUSD looks bullish!
The price reached the major support level of 28 700 and the 200-period moving average. Moreover, the price is trading inside the bullish falling wedge on the lower timeframe. Thus, you might open a buy trade on the breakout of this wedge.
🔼 Trade: Buy BTCUSD on the breakout of the wedge
🎯TP: 30 400, 31 000
Do you trade Bitcoin with FBS?
✅ TRADE WITH FBS ✅
The price reached the major support level of 28 700 and the 200-period moving average. Moreover, the price is trading inside the bullish falling wedge on the lower timeframe. Thus, you might open a buy trade on the breakout of this wedge.
🎯TP: 30 400, 31 000
Do you trade Bitcoin with FBS?
✅ TRADE WITH FBS ✅
Please open Telegram to view this post
VIEW IN TELEGRAM
👍39❤8🔥4✍1
☝️Double confirmation is the key!
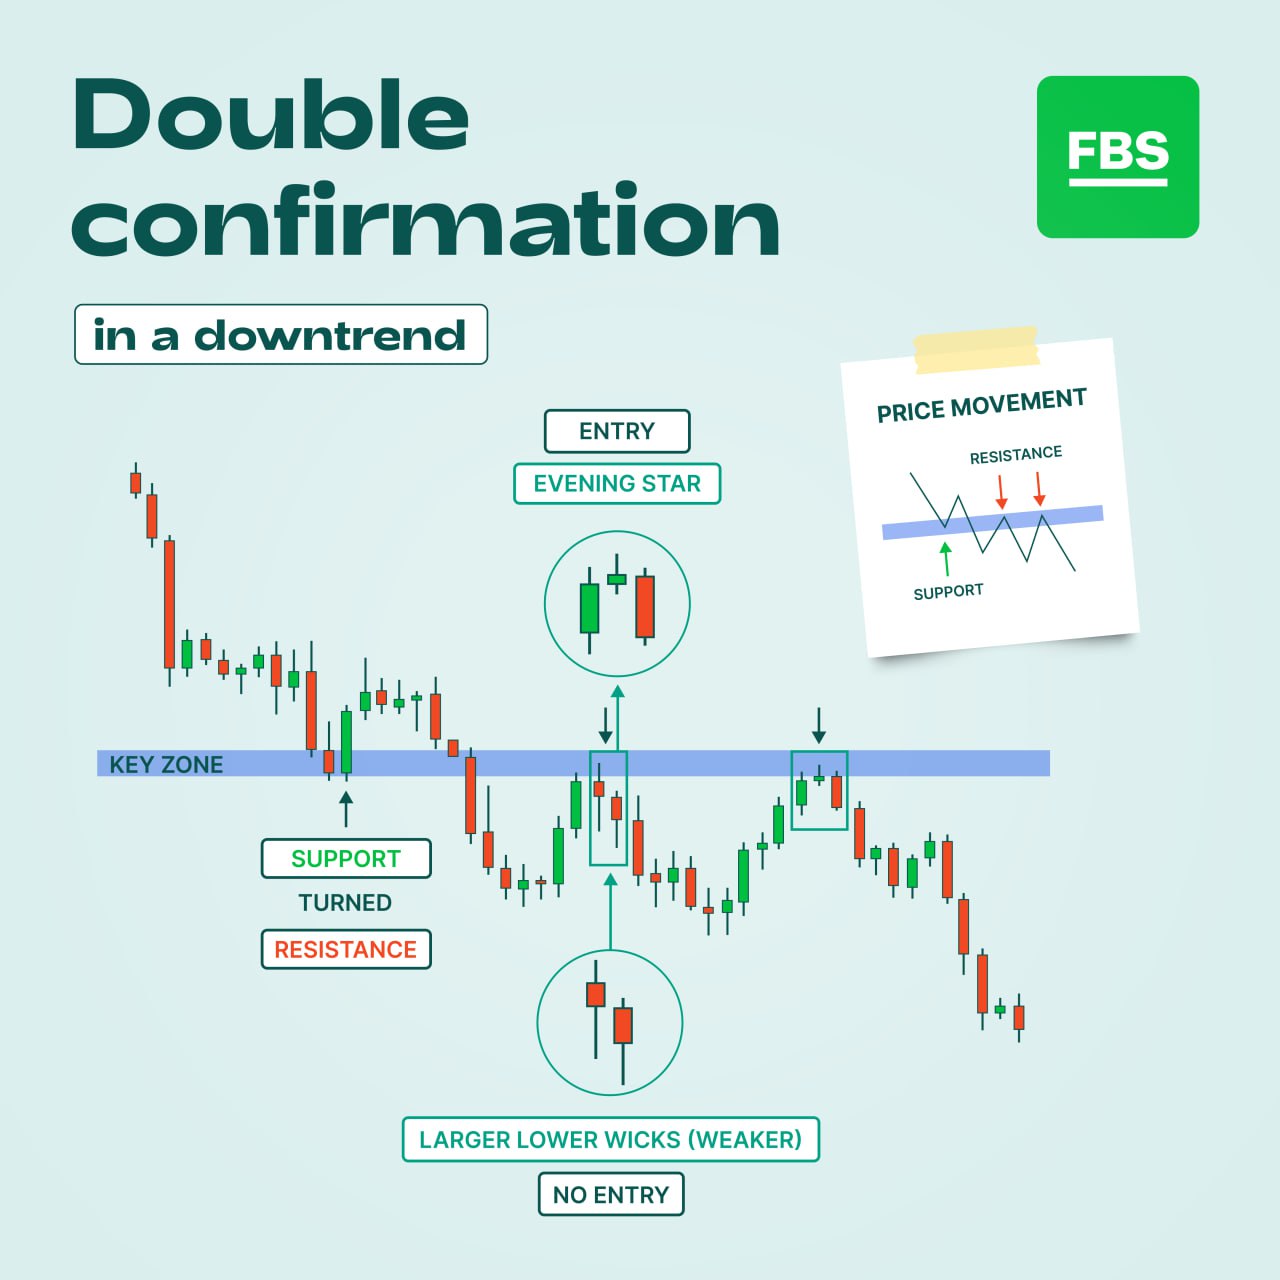
Double confirmation setup in trading is technique traders use to minimize the risk of false trading signals and increase the likelihood of profitable trades. This approach involves waiting for two indicators or signals to confirm a trading decision before entering a trade.
For example, a trader may use a technical indicator such as the Relative Strength Index (RSI) to identify oversold or overbought conditions in a particular asset. However, instead of solely relying on the RSI signal to make a trading decision, the trader may also wait for a second signal or confirmation from another indicator, such as a moving average crossover or a trendline break, before entering into a trade.
Double confirmation setup also strongly works on candlestick charts. If the price bounces off the same level twice, it increases the probability that the price will move away but not break this level through.
By waiting for multiple signals to confirm a trading decision, the trader aims to reduce the probability of entering a trade based on a false signal or market noise. You can use the double confirmation setup in various trading strategies, including swing, day, and position trading.
🤔Do you want to learn more about technical analysis?
➡️Read the article: https://bit.ly/41LiBmC
Double confirmation setup in trading is technique traders use to minimize the risk of false trading signals and increase the likelihood of profitable trades. This approach involves waiting for two indicators or signals to confirm a trading decision before entering a trade.
For example, a trader may use a technical indicator such as the Relative Strength Index (RSI) to identify oversold or overbought conditions in a particular asset. However, instead of solely relying on the RSI signal to make a trading decision, the trader may also wait for a second signal or confirmation from another indicator, such as a moving average crossover or a trendline break, before entering into a trade.
Double confirmation setup also strongly works on candlestick charts. If the price bounces off the same level twice, it increases the probability that the price will move away but not break this level through.
By waiting for multiple signals to confirm a trading decision, the trader aims to reduce the probability of entering a trade based on a false signal or market noise. You can use the double confirmation setup in various trading strategies, including swing, day, and position trading.
🤔Do you want to learn more about technical analysis?
➡️Read the article: https://bit.ly/41LiBmC
👍51❤15🥰4⚡1✍1👌1🌚1
#strategy
🔥Here we go, guys! Catch our new strategy for trading
🎉We would like to present a new trading strategy based on RSI and Bollinger Bands. Do you want to be more effective? Include this one into your trading toolkit: New Counter-Trend Strategy
🚀Don’t miss it🚀
➡️https://bit.ly/3mVUCCh
🔥Here we go, guys! Catch our new strategy for trading
🎉We would like to present a new trading strategy based on RSI and Bollinger Bands. Do you want to be more effective? Include this one into your trading toolkit: New Counter-Trend Strategy
🚀Don’t miss it🚀
➡️https://bit.ly/3mVUCCh
❤25❤🔥4👌4😍2👎1
What device do you use for trading?
Anonymous Poll
69%
Mobile phone
7%
Desktop computer
24%
Both mobile phone and desktop computer
❤🔥31👍17⚡5🆒3🤝2😍1🐳1🌭1
If you use a mobile phone, what tasks do you typically perform on it while trading?
Anonymous Poll
26%
Viewing quotes
44%
Conducting technical analysis
50%
Setting Stop Loss and Take Profit levels
35%
Reading trading signals and news
34%
Using an economic calendar
59%
Opening and closing trades
25%
Reviewing trade history and performance
21%
Communicating with other traders or brokers
38%
Monitoring market volatility
37%
Performing urgent operations, such as closing a trade in response to breaking news
👍80❤15🔥14😍9❤🔥7✍5🆒4🌚3⚡2🌭1
#MarketNews
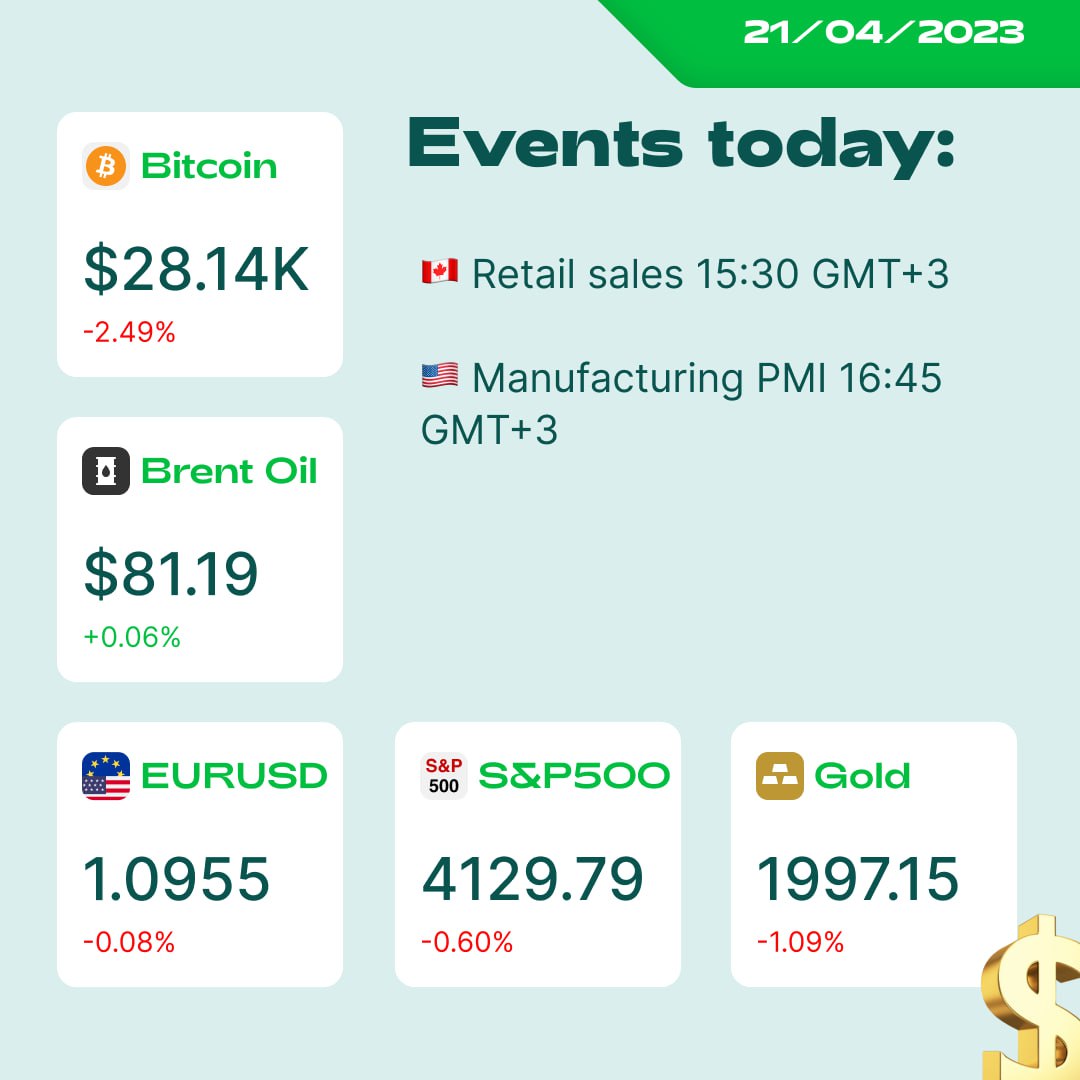
🎉Happy Friday, dears! This week was full of news. Reports season is shaking the stock markets; pairs fluctuate, and Gold is falling. What’s going on? Let’s check
🇺🇸The US Initial Jobless Claims was released worse than the forecast. The fact was 245K against 240K in the forecast. Continuing jobless claims increased as well. The situation in the labor market is worsening, and waiting impatiently for the unemployment rate for April.
🇺🇸Existing home sales decreased. 4.44M for March. That was logical, considering the situation with the new home sales. The mortgage rate in the US is beating its record highs. Slowing in consumption may push the Fed for future monetary easing. In this case, USD will start falling again, while XAUUSD may start rising.
🇺🇸Rumors around the Governmental debt ceiling resumed. Goldman Sachs: ‘The day X, when the U.S. will lose solvency due to the debt ceiling, may come earlier than planned (namely, in August)’😱 Bad news for the dollar and American indices. Good news for Gold again.
🇬🇧The UK retail sales decreased in March by 0.9%. UBS and BofA expect the Bank of England to raise rates by 0.25% in May. It also predicts the rate to peak at 4.5%.
🇩🇪German Manufacturing PMI is falling. PMI stands for Purchasing Manager Index and reflects the purchasing managers’ activity situation. The higher – the better. If PMI is above 50 – the economy is stable. If below – the recession is expected. German PMI is 44 points now.
🥇BTC is returning to 26700. 200MA on the W1 time frame is heading down. The trend is primarily bearish.
🏆XAUUSD on the H4 time frame dropped below 200MA again. The nearest support level is approximately $1980.50. Shorts are preferable. Do you agree with that?
🔥That’s it for today, dears. Give us ❤️ if you liked the digest! Good luck!
✅ TRADE WITH FBS ✅
🎉Happy Friday, dears! This week was full of news. Reports season is shaking the stock markets; pairs fluctuate, and Gold is falling. What’s going on? Let’s check
🇺🇸The US Initial Jobless Claims was released worse than the forecast. The fact was 245K against 240K in the forecast. Continuing jobless claims increased as well. The situation in the labor market is worsening, and waiting impatiently for the unemployment rate for April.
🇺🇸Existing home sales decreased. 4.44M for March. That was logical, considering the situation with the new home sales. The mortgage rate in the US is beating its record highs. Slowing in consumption may push the Fed for future monetary easing. In this case, USD will start falling again, while XAUUSD may start rising.
🇺🇸Rumors around the Governmental debt ceiling resumed. Goldman Sachs: ‘The day X, when the U.S. will lose solvency due to the debt ceiling, may come earlier than planned (namely, in August)’😱 Bad news for the dollar and American indices. Good news for Gold again.
🇬🇧The UK retail sales decreased in March by 0.9%. UBS and BofA expect the Bank of England to raise rates by 0.25% in May. It also predicts the rate to peak at 4.5%.
🇩🇪German Manufacturing PMI is falling. PMI stands for Purchasing Manager Index and reflects the purchasing managers’ activity situation. The higher – the better. If PMI is above 50 – the economy is stable. If below – the recession is expected. German PMI is 44 points now.
🥇BTC is returning to 26700. 200MA on the W1 time frame is heading down. The trend is primarily bearish.
🏆XAUUSD on the H4 time frame dropped below 200MA again. The nearest support level is approximately $1980.50. Shorts are preferable. Do you agree with that?
🔥That’s it for today, dears. Give us ❤️ if you liked the digest! Good luck!
✅ TRADE WITH FBS ✅
❤39👍33❤🔥3🕊3⚡2✍1🌭1🆒1
#XBRUSD
Please open Telegram to view this post
VIEW IN TELEGRAM
❤47👍20🔥3😍3❤🔥2🌚2
🥇#XAUUSD
🔥 XAUUSD might form a bullish pattern!
Currently, the price is trading right above the 1983.00 support level. As you can see, the price can form an inverted Head and Shoulders pattern with the target at 2031.00 if it breaks above 2010.00. Thus, we suggest you look for buy trades in XAUUSD with the SL below 1980.00.
Are you bullish or bearish on gold?
✅ TRADE WITH FBS ✅
Currently, the price is trading right above the 1983.00 support level. As you can see, the price can form an inverted Head and Shoulders pattern with the target at 2031.00 if it breaks above 2010.00. Thus, we suggest you look for buy trades in XAUUSD with the SL below 1980.00.
Are you bullish or bearish on gold?
✅ TRADE WITH FBS ✅
Please open Telegram to view this post
VIEW IN TELEGRAM
👍97👎23❤14🆒7🔥5🤮5✍3❤🔥2🎉1👌1👨💻1
#USDCAD
🇨🇦Core retail sales in Canada decreased by 0.7%.
USDCAD continued rising and broke the resistance level of 1.3515.
Meanwhile, RSI reached the overbought level and tried to return.
It looks like a reversal signal 📉
🧐What do you think about USDCAD, guys?
✅ TRADE WITH FBS ✅
🇨🇦Core retail sales in Canada decreased by 0.7%.
USDCAD continued rising and broke the resistance level of 1.3515.
Meanwhile, RSI reached the overbought level and tried to return.
It looks like a reversal signal 📉
🧐What do you think about USDCAD, guys?
✅ TRADE WITH FBS ✅

👍29❤10🆒2