
Actual — 0.2%
Expected — 0.2%
Previous — 0.2%
Actual — 3.2%
Expected — 3.3%
Previous — 3.0%
Actual — 0.2%
Expected — 0.2%
Previous — 0.2%
What do you trade?
Please open Telegram to view this post
VIEW IN TELEGRAM
👍80🔥24❤17⚡11❤🔥6🎉2😍2🆒2👎1🌭1
#MarketNews
☀️ The last day of the week doesn’t let us go without critical economic release. Let’s find out, what else should we expect today.
📊 Annual US CPI is below expectations (3.2% vs. 3.3%), which is positive for the stock market. After the reading, the USD index fell 770 points, pushing gold higher.
👷♂️ US unemployment claims are above expectations (248K vs. 231K). The reading didn’t have any impact on the market.
🇬🇧 The UK monthly GDP is above expectations (0.5% vs. 0.2%). Preliminary GDP is also higher (0.2% vs. 0.0%). GBPUSD is up 400 points.
🛢 Oil fell 2.2% on Friday ahead of a report from the International Energy Agency that will provide a snapshot of a crude market that’s tightening due to supply curbs.
🇪🇺 Economists believe the ECB will pause and not raise rates in September, but further hikes are possible.
What will you trade today? Like ❤️ if gold!
☀️ The last day of the week doesn’t let us go without critical economic release. Let’s find out, what else should we expect today.
📊 Annual US CPI is below expectations (3.2% vs. 3.3%), which is positive for the stock market. After the reading, the USD index fell 770 points, pushing gold higher.
👷♂️ US unemployment claims are above expectations (248K vs. 231K). The reading didn’t have any impact on the market.
🇬🇧 The UK monthly GDP is above expectations (0.5% vs. 0.2%). Preliminary GDP is also higher (0.2% vs. 0.0%). GBPUSD is up 400 points.
🛢 Oil fell 2.2% on Friday ahead of a report from the International Energy Agency that will provide a snapshot of a crude market that’s tightening due to supply curbs.
🇪🇺 Economists believe the ECB will pause and not raise rates in September, but further hikes are possible.
What will you trade today? Like ❤️ if gold!
❤63👍23❤🔥6🔥4
🔉Fair Value Gap: FBS Explains
🧠Fair Value Gap is a part of the Smart Money Concept (SMC). It's a market analysis method based on the big players' probable actions: banks, institutional investors, whales, market makers, and insiders. When a huge player wants to enter the game, it creates unusual price fluctuations because the big player moves the market because their orders are insanely large.
⚖️Fair Gap Value is also called an "Imbalance." You may find it all across different charts, from Forex and gold to crypto and stocks (although stocks have way more gaps because stock trading is time-barred).
🕯 Imbalance consists of three candles. The second candle is an impulse in any direction. The first and the third candles create the border of the Imbalance. The Imbalance has formed after the third candle closes.
☝️The bullish Imbalance locates between the first candle's highest and the third candle's lowest points. The bearish Imbalance locates between the first candle's lowest point and the third candle's highest point.
🧑💻 Traders consider the Imbalance strong when the price collected liquidity above the recent highs or below the recent lows before creating an imbalance.
❗️ FVG (Imbalance) works as a strong resistance/support area. Therefore, it is extremely useful for every trading strategy!
Try to find an Imbalance on the charts and share your ideas in the comments!
➡️ TRADE WITH FBS
@fbsanalytics
🧠Fair Value Gap is a part of the Smart Money Concept (SMC). It's a market analysis method based on the big players' probable actions: banks, institutional investors, whales, market makers, and insiders. When a huge player wants to enter the game, it creates unusual price fluctuations because the big player moves the market because their orders are insanely large.
⚖️Fair Gap Value is also called an "Imbalance." You may find it all across different charts, from Forex and gold to crypto and stocks (although stocks have way more gaps because stock trading is time-barred).
☝️The bullish Imbalance locates between the first candle's highest and the third candle's lowest points. The bearish Imbalance locates between the first candle's lowest point and the third candle's highest point.
Try to find an Imbalance on the charts and share your ideas in the comments!
@fbsanalytics
Please open Telegram to view this post
VIEW IN TELEGRAM
👍66❤14🔥7✍4❤🔥3🫡2🌚1
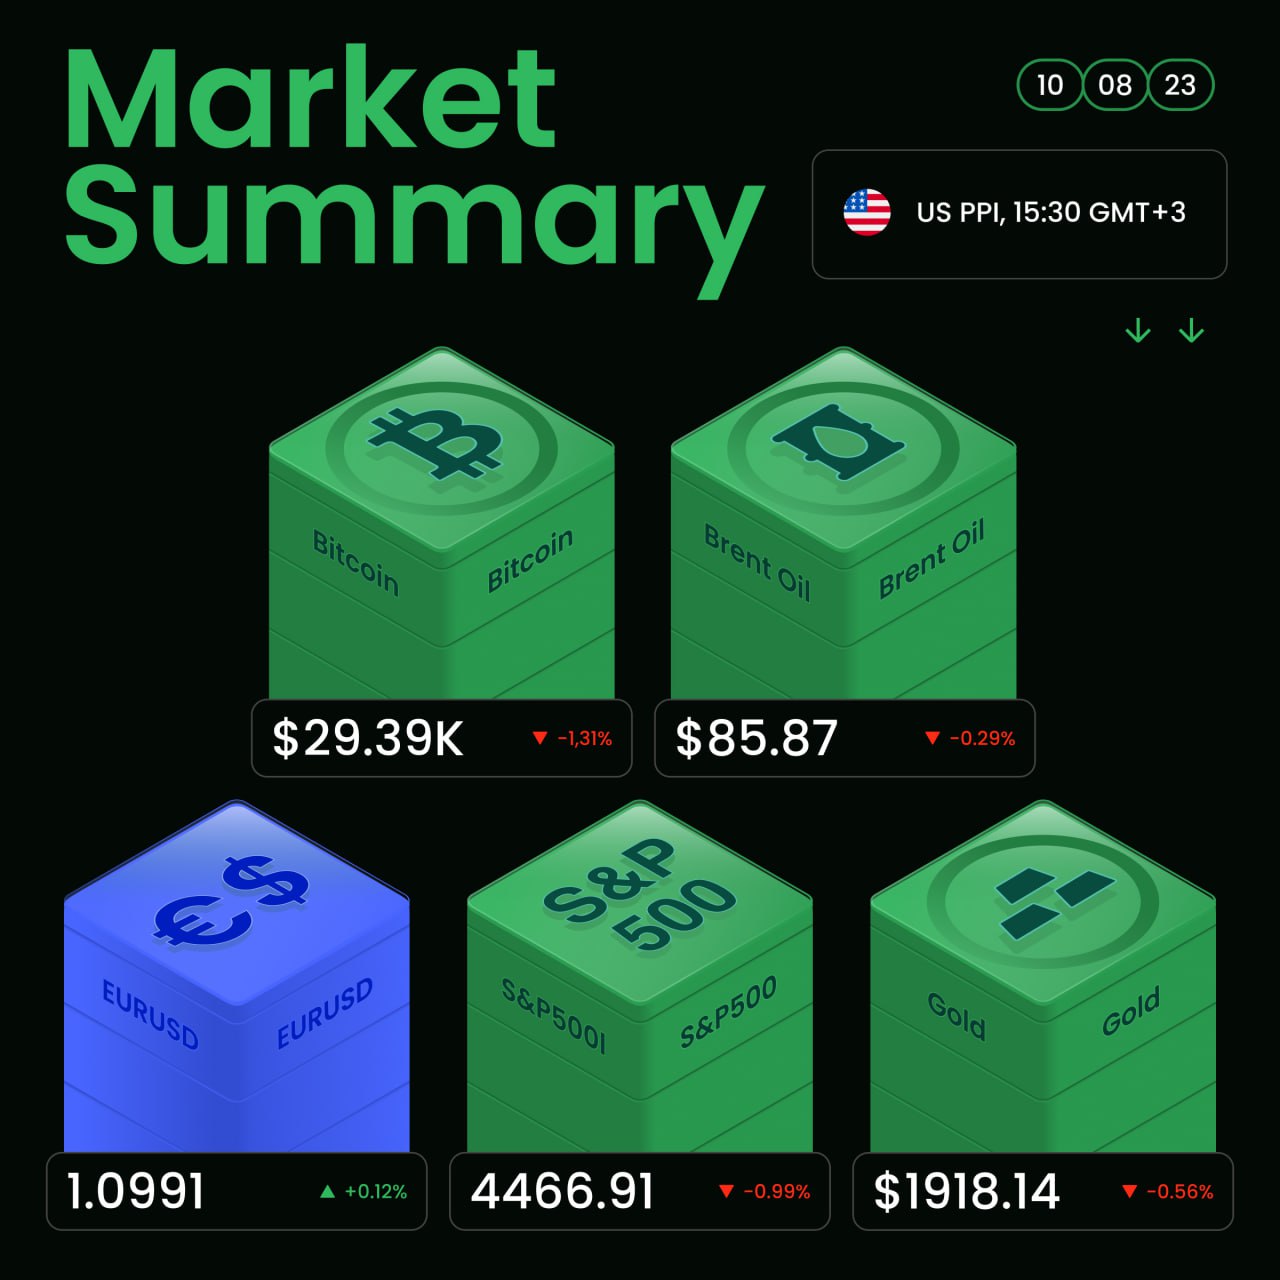
💣US PPI release💣
🔥PPI m/m (bullish for the USD)
Actual: 0.3%
Forecast: 0.2%
Previous: 0.1%
🔥Core PPI m/m (bullish for the USD)
Actual: 0.3%
Forecast: 0.2%
Previous: 0.1%
🔥PPI m/m (bullish for the USD)
Actual: 0.3%
Forecast: 0.2%
Previous: 0.1%
🔥Core PPI m/m (bullish for the USD)
Actual: 0.3%
Forecast: 0.2%
Previous: 0.1%
❤40👍21✍8🔥8❤🔥4😍1
🔥Hello, dears!
Our Trading Marathon is on its way🚀. Here are our Thursday leaders!
🎉Congratulations guys🎉
😲 Do you want to join FBS Trading Marathon?
Read the post: https://t.me/fbsanalytics/7001
➡️ TRADE WITH FBS
@fbsanalytics
Our Trading Marathon is on its way🚀. Here are our Thursday leaders!
🎉Congratulations guys🎉
Read the post: https://t.me/fbsanalytics/7001
@fbsanalytics
Please open Telegram to view this post
VIEW IN TELEGRAM
👍40⚡6🍌3🐳2🫡2❤1
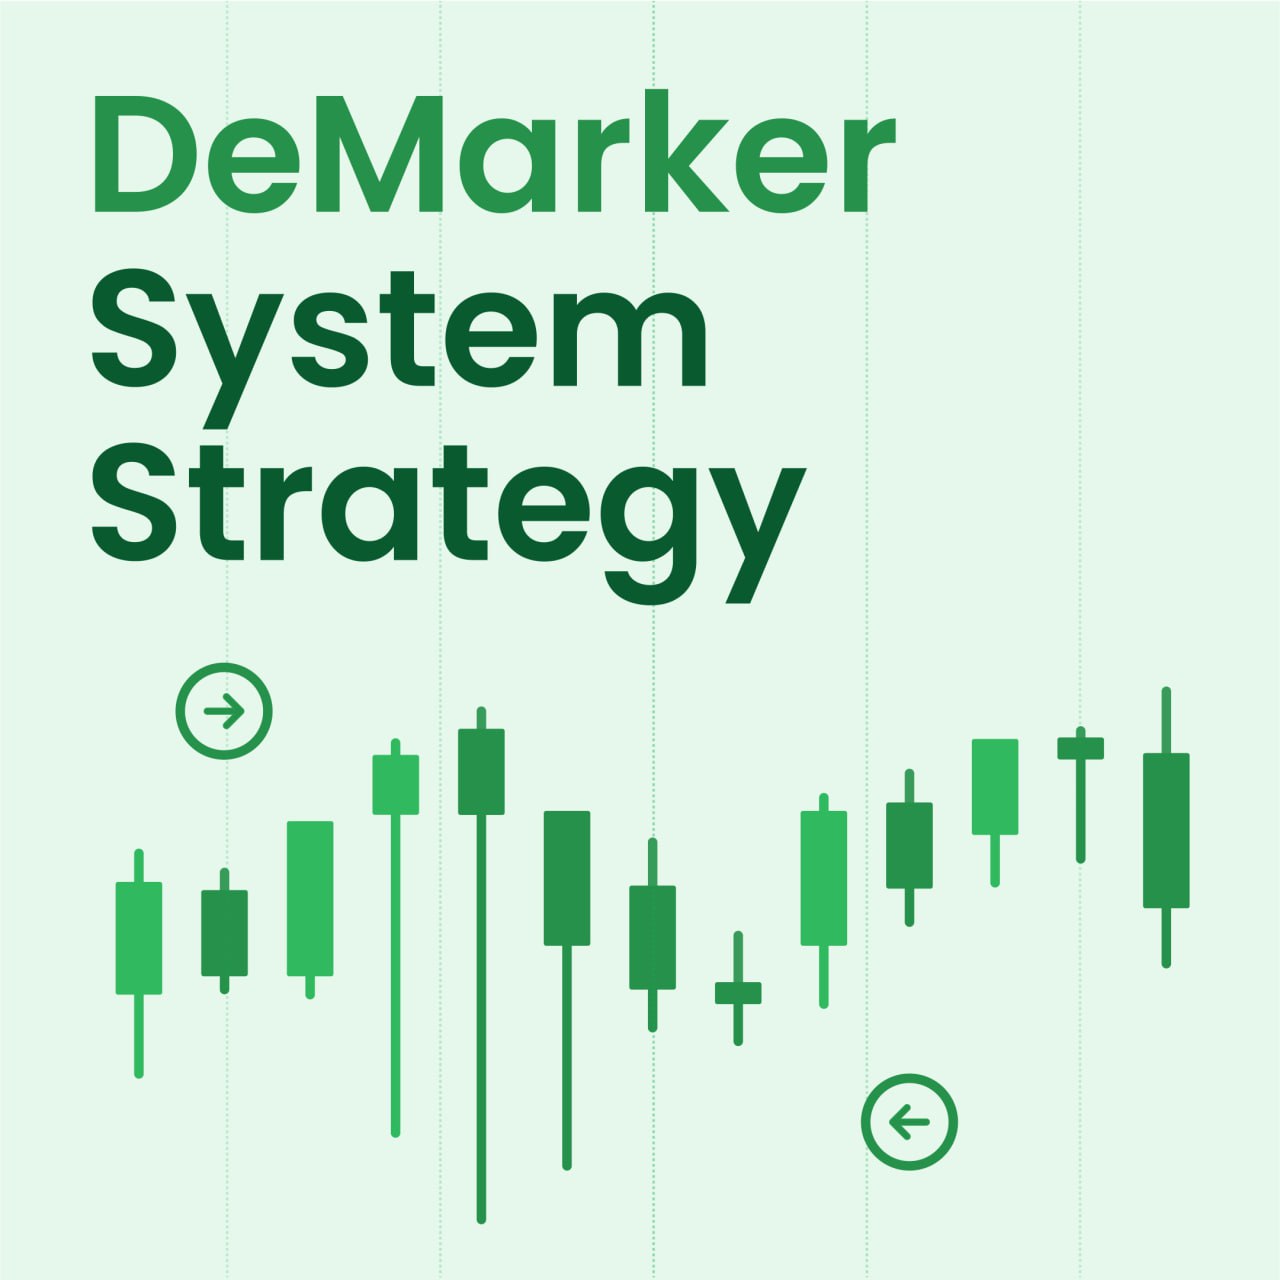
🚀Recently we’ve presented a new trading strategy that is called the DeMarker System Strategy.
Let’s check what are the main features of this trading system.
Use our short quiz to learn more about the strategy t.me/QuizBot?start=QGFrwyOj
✅TRADE WITH FBS✅
Let’s check what are the main features of this trading system.
Use our short quiz to learn more about the strategy t.me/QuizBot?start=QGFrwyOj
✅TRADE WITH FBS✅
❤55👍18❤🔥6💩5✍2🆒2⚡1🌚1
Please open Telegram to view this post
VIEW IN TELEGRAM
❤102💯20👍13❤🔥10🔥8✍5⚡3🍾3
Our new crypto course explains how to catch the next big bull market. We strongly recommend checking it while Bitcoin isn’t in the uptrend.
#crypto
Please open Telegram to view this post
VIEW IN TELEGRAM
👍45❤12❤🔥11🆒6✍3🌚3💩1
#MarketNews
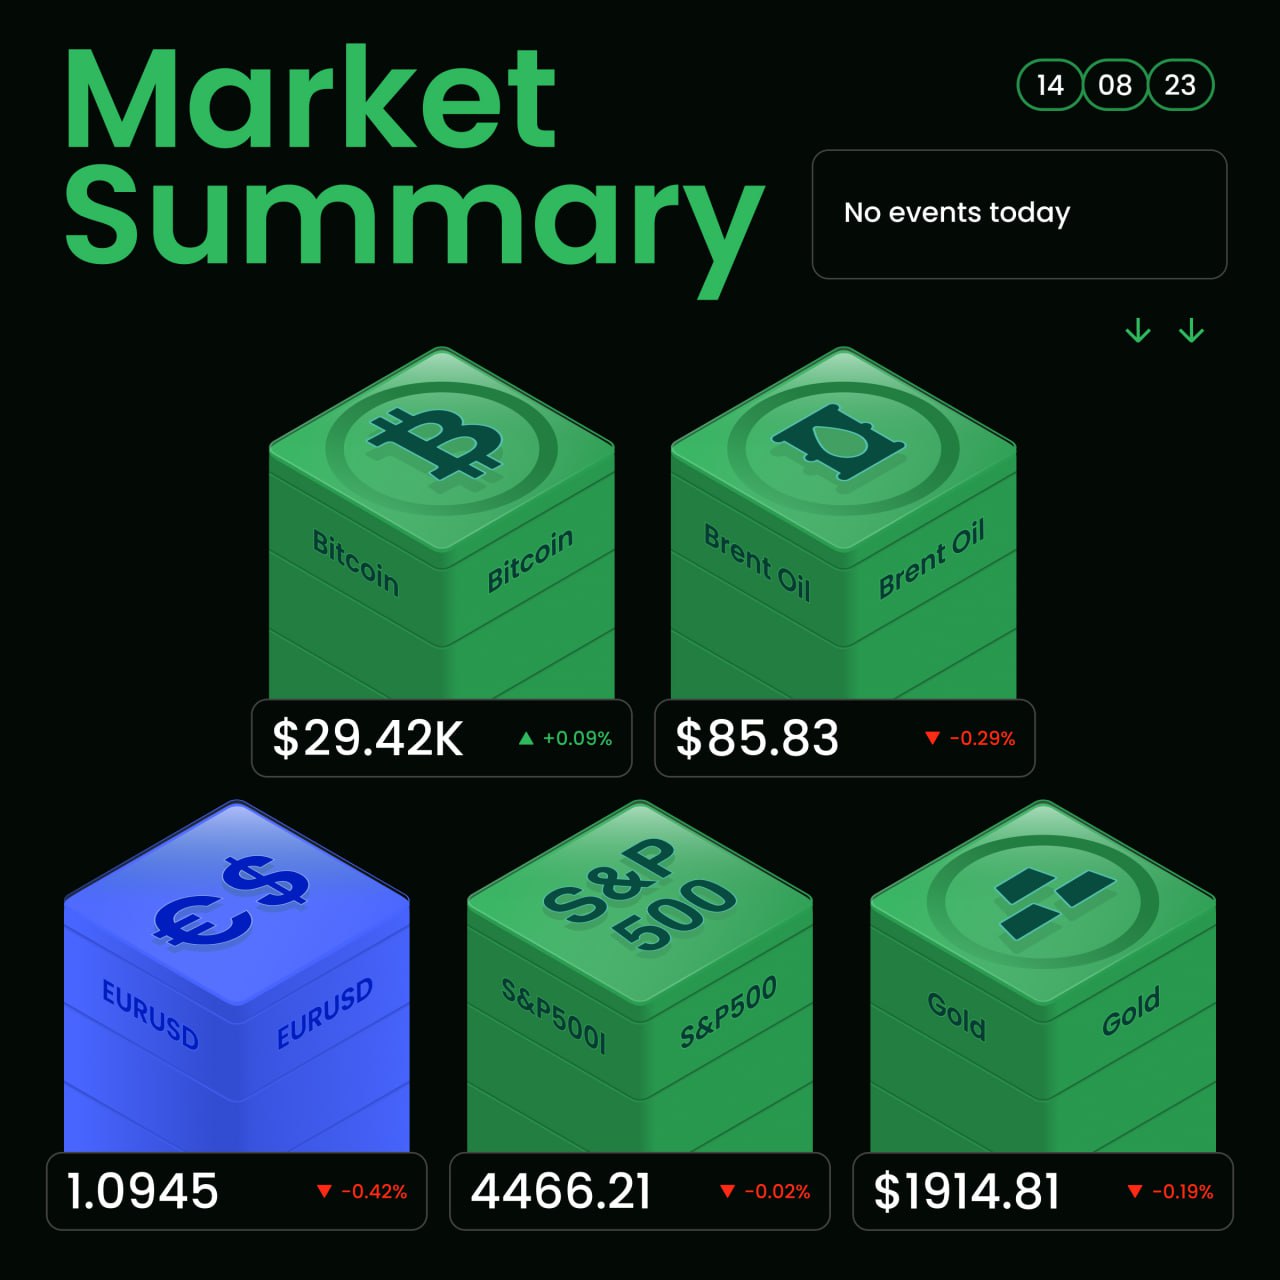
☀️ Monday, traders! Will the downtrend in gold change this week? What about oil? How long will it skyrocket? We have a lot to share with you. Take a look!
🗓 Economic calendar
The time zone is GMT+3. Check your time zone.
1️⃣ Monday:
No impactful events
2️⃣ Tuesday:
04:30, Australian Monetary Policy Meeting Minutes
05:00, China Industrial Production y/y
09:00, UK Claimant Count Change
15:30, Canada CPI (four readings)
15:30, US Retail Sales
3️⃣ Wednesday:
05:00, RBNZ Rate Statement and Cash Rate
09:00, UK CPI
21:00, FOMC Meeting Minutes
4️⃣ Thursday:
04:30, Australian Employment Change and Unemployment Rate
15:30, US Unemployment Claims
5️⃣ Friday:
09:00, UK Retail Sales m/m
🗞 Critical news of the week
🇯🇵 USDJPY reached 145.20, the highest since November 2022. Market now expects the BOJ to step in.
🇨🇳 USDCNH is gaining speed, rising 750 points over the last few days.
📉 The market sentiment regarding tech stocks is changing. Now, investors will probably sell the rally in technology stocks (bearish) and buy corrections in the energy sector (bullish). This change happened because of the rally in energy prices.
🇪🇺 According to analysts’ expectations, the ECB will raise the rate by 25 basis points in September. The same is expected in Swiss.
🏦 Ex-SEC representative expects the SEC to delay Bitcoin ETF from BlackRock, Invesco, and others. SEC will likely decide depending on the US Presidential election of 2024.
👊 Mark Zuckerberg says Elon Musk is not serious about fighting him, and it’s time to move on. Musk says that the fight should happen today. Meanwhile, Instagram’s Thread app lost 80% of its active user base.
🏆 Gold analysis for the week ahead
➡️ https://bit.ly/3OX107X
Have an amazing week!
☀️ Monday, traders! Will the downtrend in gold change this week? What about oil? How long will it skyrocket? We have a lot to share with you. Take a look!
🗓 Economic calendar
The time zone is GMT+3. Check your time zone.
1️⃣ Monday:
No impactful events
2️⃣ Tuesday:
04:30, Australian Monetary Policy Meeting Minutes
05:00, China Industrial Production y/y
09:00, UK Claimant Count Change
15:30, Canada CPI (four readings)
15:30, US Retail Sales
3️⃣ Wednesday:
05:00, RBNZ Rate Statement and Cash Rate
09:00, UK CPI
21:00, FOMC Meeting Minutes
4️⃣ Thursday:
04:30, Australian Employment Change and Unemployment Rate
15:30, US Unemployment Claims
5️⃣ Friday:
09:00, UK Retail Sales m/m
🗞 Critical news of the week
🇯🇵 USDJPY reached 145.20, the highest since November 2022. Market now expects the BOJ to step in.
🇨🇳 USDCNH is gaining speed, rising 750 points over the last few days.
📉 The market sentiment regarding tech stocks is changing. Now, investors will probably sell the rally in technology stocks (bearish) and buy corrections in the energy sector (bullish). This change happened because of the rally in energy prices.
🇪🇺 According to analysts’ expectations, the ECB will raise the rate by 25 basis points in September. The same is expected in Swiss.
🏦 Ex-SEC representative expects the SEC to delay Bitcoin ETF from BlackRock, Invesco, and others. SEC will likely decide depending on the US Presidential election of 2024.
👊 Mark Zuckerberg says Elon Musk is not serious about fighting him, and it’s time to move on. Musk says that the fight should happen today. Meanwhile, Instagram’s Thread app lost 80% of its active user base.
🏆 Gold analysis for the week ahead
➡️ https://bit.ly/3OX107X
Have an amazing week!
👍50🔥16❤9❤🔥9😍4✍2🆒1
The pair broke above the 200-period MA on the H4 timeframe and retested it from above. Therefore, we expect an uptrend to continue.
🎯TP: 0.8805, 0.8820
What do you think?
@fbsanalytics
Please open Telegram to view this post
VIEW IN TELEGRAM
❤🔥29👍18❤10🔥6👌2
The pair bounced from its 50 Moving Average.
The trend is bearish.📉
In H1 timeframe, Stochastic lines intersected and kept falling.
🎯TP: 1.09300, 1.09290
@fbsanalytics
Please open Telegram to view this post
VIEW IN TELEGRAM
👍49❤13❤🔥6🔥6✍2🥴2👎1
🇪🇺🇺🇸EURUSD. Both targets were hit!
Hope, that you managed to use the signal.
🤔What are you going to do now?
➡️ TRADE WITH FBS
@fbsanalytics
Hope, that you managed to use the signal.
🤔What are you going to do now?
@fbsanalytics
Please open Telegram to view this post
VIEW IN TELEGRAM
❤46👍19⚡8🐳4
🔥Hey-hi! Friday leaders are here!
🤔 Do you take part in our Trading Marathon, dears?
Are you still waiting? What a pity! Otherwise, you could have been here on our winner’s board! 🚀
🎉Congratulations, Friday Winners!
Join the Marathon here➡️
https://t.me/fbsanalytics/7001
➡️ TRADE WITH FBS
@fbsanalytics
🤔 Do you take part in our Trading Marathon, dears?
Are you still waiting? What a pity! Otherwise, you could have been here on our winner’s board! 🚀
🎉Congratulations, Friday Winners!
Join the Marathon here➡️
https://t.me/fbsanalytics/7001
@fbsanalytics
Please open Telegram to view this post
VIEW IN TELEGRAM
🔥12❤🔥5😍5❤2👍2🆒1
📈 Mastering Trading Patterns: Ascending Triangle
Hey Traders! Do you want to learn about an essential chart pattern? Let's dive into the Ascending Triangle!
The Ascending Triangle is a bullish continuation pattern, often indicating an upcoming price breakout. Here's how you can trade it effectively:
👀 Identify the Pattern: Look for a series of higher lows forming the ascending lower trendline and a horizontal upper resistance line. This suggests buyers are getting more aggressive as they push against the resistance.
🧐Waiting for the Breakout: Be patient! Wait for the price to break above the upper resistance line. This breakout signals a potential uptrend continuation.
📈Set Entry and Stop-Loss orders: Once a breakout occurs, enter a trade. Place a stop-loss order below the breakout candle to manage risk.
🎯Project the Target: Measure the height of the triangle's base and add it to the breakout point to estimate a potential target level.
👍Watch for Confirmation: Keep an eye on price action post-breakout. A pullback and successful retest of the upper resistance as support can provide a solid confirmation for your trade.
Remember, no pattern is foolproof, so use risk management strategies like proper position sizing and stop-loss placement.
➡️ TRADE WITH FBS
@fbsanalytics
Hey Traders! Do you want to learn about an essential chart pattern? Let's dive into the Ascending Triangle!
The Ascending Triangle is a bullish continuation pattern, often indicating an upcoming price breakout. Here's how you can trade it effectively:
🧐Waiting for the Breakout: Be patient! Wait for the price to break above the upper resistance line. This breakout signals a potential uptrend continuation.
📈Set Entry and Stop-Loss orders: Once a breakout occurs, enter a trade. Place a stop-loss order below the breakout candle to manage risk.
🎯Project the Target: Measure the height of the triangle's base and add it to the breakout point to estimate a potential target level.
👍Watch for Confirmation: Keep an eye on price action post-breakout. A pullback and successful retest of the upper resistance as support can provide a solid confirmation for your trade.
Remember, no pattern is foolproof, so use risk management strategies like proper position sizing and stop-loss placement.
@fbsanalytics
Please open Telegram to view this post
VIEW IN TELEGRAM
👍94❤21🔥21❤🔥12✍7👌4😁3🥴3⚡2
💥Market analysis!
Our financial expert and markets analyst, Adetola Freeman, shared his opinion regarding today's Retail Sales release!
➡️ Read the article: https://bit.ly/45nmYGg
Our financial expert and markets analyst, Adetola Freeman, shared his opinion regarding today's Retail Sales release!
Please open Telegram to view this post
VIEW IN TELEGRAM
FBS
Retail Sales Outlook for the US Dollar
Despite notable fluctuations, the USD is close to its position at the beginning of 2023. HSBC economists are examining the US Dollar's future prospects based on its performance so far. Recent data ind
❤26👍19🔥6⚡2🌭1
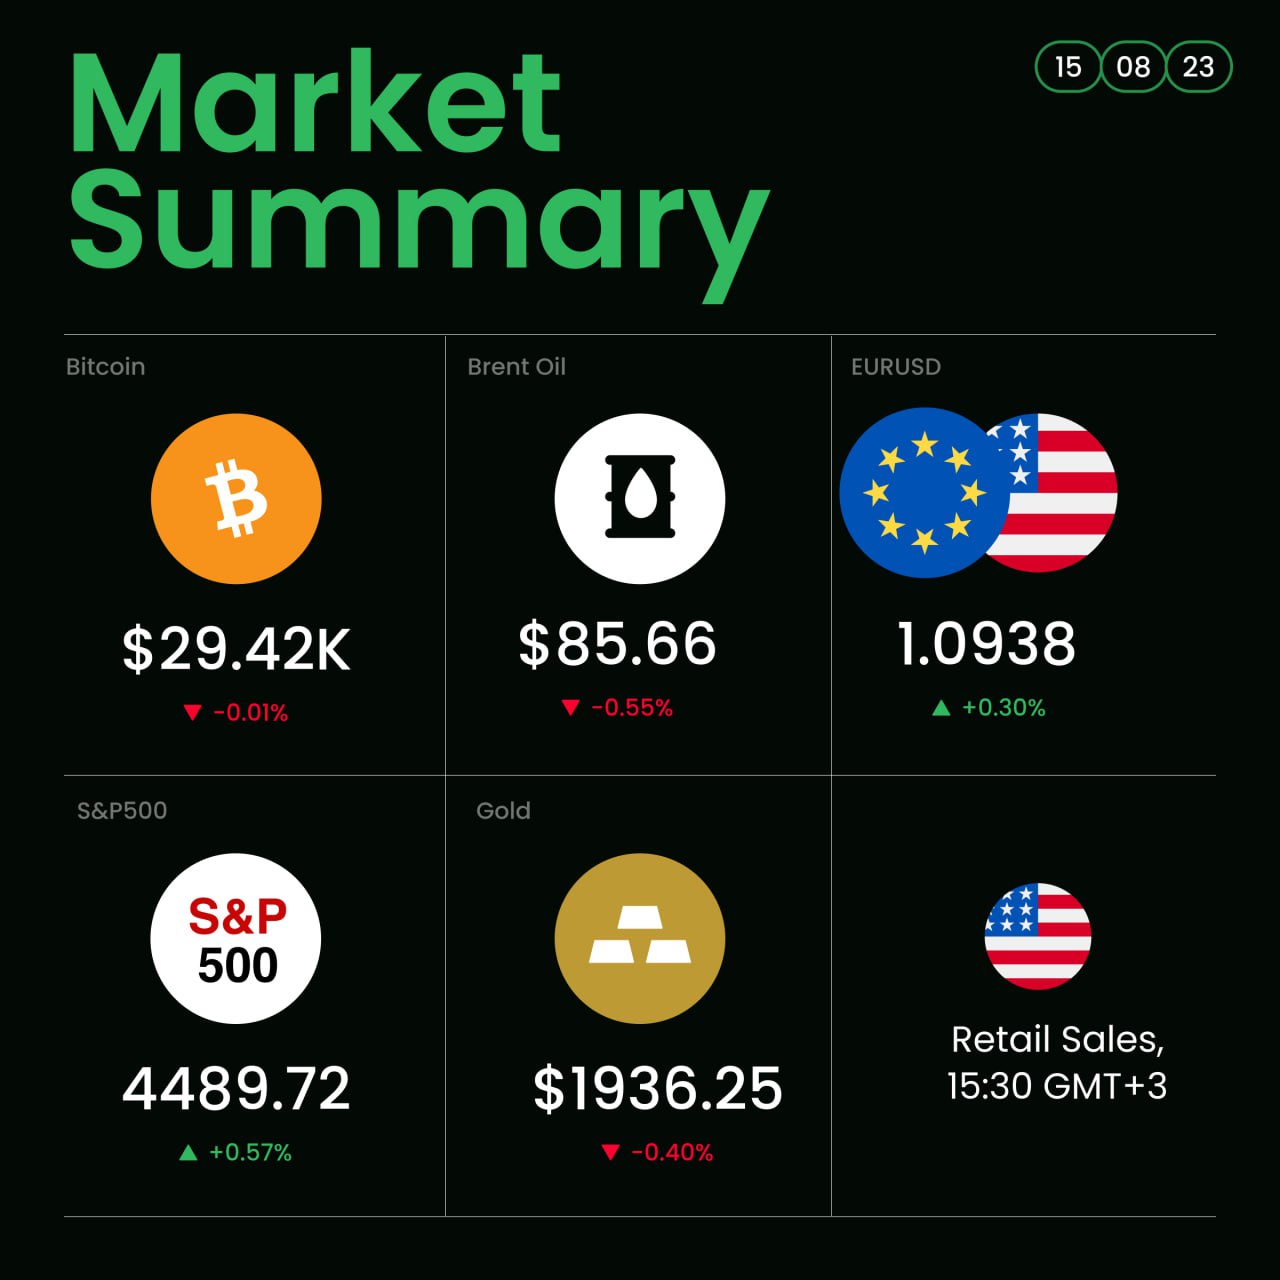
🎉Hello, dear friends! Tuesday is here with us. What’s going on in the markets? Let’s check!
🇯🇵Japanese GDP grew by 1.5% in the second quarter. Meanwhile, the Japanese Yen keeps falling. USDJPY is slowly approaching 151.90, where the Bank of Japan started currency interventions last year. The previous resistance line (145 JPY) was broken, which means this level is now a support level.
🔈BoJ Suzuki: sharp fluctuations in the yen are undesirable; the Central Bank adequately responds to excessive movements, and the Central Bank does not focus on the absolute yen levels during interventions.
🇦🇺RBA meeting minutes: further tightening of monetary policy may be needed - everything will depend on the incoming data, and inflation is expected to slow down.
What’s going on with AUDUSD? Check it out in our new review here➡️ https://tinyurl.com/5n77ryex
🇨🇭Swiss PPI was released at -0.6% YoY.
🇬🇧The unemployment rate in the UK was released worse than in the forecast. The rate for June was 4.2%. GBPUSD didn’t react much. The British pound keeps rising after touching the lower channel line.
🇺🇸The US S&P500 is returning to 4400 points. The index dropped down the trend line and kept falling. The semiconductors sector is in the falling leaders. Nvidia stocks have a large gap from 25th May. If the price drops, bears may try to close this gap and push the price to the range of $320 - $350
🏆BTCUSD is in flat. 100MA is moving sideways. But the global trend is still bullish. That’s why long positions are preferable to shorts.
🥇XAUUSD reached its 200MA ($1902.65). The price may try to reverse and rise. But before opening long positions, we should wait for confirmation signals. What are your ideas about gold, guys? Are you buying or selling it?
That’s it for today! We hope you enjoyed our review. Please give us your ❤️ if you liked it. See you soon.
🇯🇵Japanese GDP grew by 1.5% in the second quarter. Meanwhile, the Japanese Yen keeps falling. USDJPY is slowly approaching 151.90, where the Bank of Japan started currency interventions last year. The previous resistance line (145 JPY) was broken, which means this level is now a support level.
🔈BoJ Suzuki: sharp fluctuations in the yen are undesirable; the Central Bank adequately responds to excessive movements, and the Central Bank does not focus on the absolute yen levels during interventions.
🇦🇺RBA meeting minutes: further tightening of monetary policy may be needed - everything will depend on the incoming data, and inflation is expected to slow down.
What’s going on with AUDUSD? Check it out in our new review here➡️ https://tinyurl.com/5n77ryex
🇨🇭Swiss PPI was released at -0.6% YoY.
🇬🇧The unemployment rate in the UK was released worse than in the forecast. The rate for June was 4.2%. GBPUSD didn’t react much. The British pound keeps rising after touching the lower channel line.
🇺🇸The US S&P500 is returning to 4400 points. The index dropped down the trend line and kept falling. The semiconductors sector is in the falling leaders. Nvidia stocks have a large gap from 25th May. If the price drops, bears may try to close this gap and push the price to the range of $320 - $350
🏆BTCUSD is in flat. 100MA is moving sideways. But the global trend is still bullish. That’s why long positions are preferable to shorts.
🥇XAUUSD reached its 200MA ($1902.65). The price may try to reverse and rise. But before opening long positions, we should wait for confirmation signals. What are your ideas about gold, guys? Are you buying or selling it?
That’s it for today! We hope you enjoyed our review. Please give us your ❤️ if you liked it. See you soon.
👍65❤53✍6🔥5
💥Voice chat with FBS analysts!💥
Join Telegram Voice Chat with Adetola Freeman to trade Live on the US Retail Sales release today at 15:15 GMT+3.
➡️ TRADE WITH FBS
@fbsanalytics
Join Telegram Voice Chat with Adetola Freeman to trade Live on the US Retail Sales release today at 15:15 GMT+3.
@fbsanalytics
Please open Telegram to view this post
VIEW IN TELEGRAM
👍63❤21🔥9✍6❤🔥4👏3⚡1