
#TradeIdea
👉 💵 🇻🇦 🛸 👈 XBRUSD goes down!
🕯 On the H1, XBRUSD has formed a head and shoulders pattern and is now approaching the resistance level of 76.80, which corresponds to 23.6 Fibonacci. The moving averages only confirm the bearish sentiment.
🔽 Trade: Sell XBRUSD on a breakout below 76.80
🎯 TP: 75.40
Smash❤️ if you agree!
➡️ TRADE WITH FBS
@fbsanalytics
🎯 TP: 75.40
Smash
@fbsanalytics
Please open Telegram to view this post
VIEW IN TELEGRAM
👍64❤35✍10❤🔥8👎8⚡3🦄2
#TradeIdea
👉 🇨🇦 🇯🇵 🌠 👈 All eyes on CADJPY!
CADJPY has formed a bearish rising wedge pattern. A price breakout below the pattern's lower boundary and the support level of 108.600 could pave the way to the target level of 107.000.
🔽 Trade: Sell CADJPY on the breakout below 108.600;
🎯Targets: 107.00, 106.00.
Smash ❤️ if you trade cross-pairs.
➡️ TRADE WITH FBS
@fbsanalytics
CADJPY has formed a bearish rising wedge pattern. A price breakout below the pattern's lower boundary and the support level of 108.600 could pave the way to the target level of 107.000.
🎯Targets: 107.00, 106.00.
Smash ❤️ if you trade cross-pairs.
@fbsanalytics
Please open Telegram to view this post
VIEW IN TELEGRAM
👍57❤24✍13👎12⚡3🦄2🎉1
#TradeIdea
👉 🇪🇺 🇻🇦 👈 Key moment for EURUSD!
📊 On the H4, EURUSD is back in consolidation and has formed a triangle pattern. The moving averages are above the price and pointing downwards, which may signal a continuation of the downtrend. However, the price could also reverse and break the upper trend line.
🔼 If EURUSD breaks above the resistance at 1.0900, it will rise to 1.1000
🔽 However, if the price breaks below the trend line and overcomes the 1.0850 support, it will fall to 1.0750.
❓ Are you bullish or bearish on EURUSD? Share in the comments 👇
➡️ TRADE WITH FBS
@fbsanalytics
@fbsanalytics
Please open Telegram to view this post
VIEW IN TELEGRAM
👍72❤24❤🔥8🔥7✍3🆒3👎2🐳2🦄2⚡1
#TradeIdea
👉 🇻🇦 🇨🇦 👈 USDCAD Outlook!
🕯 USDCAD is forming a bearish rising wedge, with the price approaching the lower boundary of the pattern and a critical support level at 1.3510. The future price movement could unfold according to two scenarios:
🔽 If USDCAD breaks below the support level of 1.3510, it could pave the way to reach the golden Fibonacci ratio and 1.3450 level;
🔼 However, if the price breaks through the resistance level of 1.3530, the next target could be 1.3570.
🤔 What do you think of this idea? Share in the comments below👇
➡️ TRADE WITH FBS
@fbsanalytics
@fbsanalytics
Please open Telegram to view this post
VIEW IN TELEGRAM
👍49❤12🐳4🔥3❤🔥2⚡2💯1🍌1🦄1
#AnalyticArticle
📝 In a new article, our FBS expert, Adetola Freeman, analyzes the situation on the gold market in detail. Don't miss the opportunity to get an important opinion on the XAUUSD future movement!
Find out right now and read our article! 🔎
📝 In a new article, our FBS expert, Adetola Freeman, analyzes the situation on the gold market in detail. Don't miss the opportunity to get an important opinion on the XAUUSD future movement!
Find out right now and read our article! 🔎
👍62❤16❤🔥4🐳4🆒4🔥2🌭1
Which technical analysis tools do you find most compelling and prefer using in your trading setups?
Anonymous Poll
11%
🌊 Elliott Wave Theory
41%
〽️ Fibonacci Retracement / Levels
22%
〰️ Indicators (e.g., RSI, MFI, VWAP)
3%
🐺 Wolfe Waves
14%
🔥 Combination of All Above
9%
🤔 Other (Please specify in the comments)
❤44👍19❤🔥9🔥7🦄4🐳3⚡1
#TradeIdea
👉 🥇 🇻🇦 👈 All eyes on XAUUSD!
🕯 On the H4, XAUUSD is near the trend line after a severe decline and is testing the substantial support area of 2017. In this case, two scenarios are possible for gold:
🔼 If the price bounces off the trend line and the 2017 support, it will increase to 2052 or even 2070.
🔽 However, if gold breaks below the trend line, it will rush to the 1975 level.
❓ What do you think the XAUUSD is bullish or bearish today? Share your opinion in the comments! 👇
➡️ TRADE WITH FBS
@fbsanalytics
@fbsanalytics
Please open Telegram to view this post
VIEW IN TELEGRAM
👍150❤37❤🔥16🆒7👎5🤮5💯5🏆4🕊3🐳3🦄3
#MarketNews
👋 Hello, dear traders! Today is Thursday, January 18, 2024. Let's quickly delve into the key financial highlights of the day:
🕊 The US launched new strikes against the Houthis in Yemen in response to their reported second attack on an American ship in the Gulf of Aden.
🍎 Apple will remove the blood oxygen monitoring feature from its latest Apple Watches, enabling the company to maintain the import and sale of these devices in the US.
🏦 In Davos, bankers joined the chorus of global central banks' warnings against premature interest rate cuts.
✈️ Boeing recently received an order for 150 Max planes from a new Indian airline, providing a boost amid challenges following a recent fuselage incident with an Alaska Airlines aircraft.
🏭 In 2023, Alcoa reduced its alumina production by 13% to 10.908 million tons and increased aluminum output by 5.2% to 2.114 million tons. The company aims to produce 9.8-10 million tons of alumina and 2.2-2.3 million tons of aluminum in 2024.
📉 Samsung has chosen Google's AI to support its latest Galaxy phones.
🇨🇳 China is intensively investing in sectors producing electric vehicles, batteries, and renewable energy equipment to support its weakening economy.
👨💻 Google CEO Sundar Pichai has informed employees to anticipate further job reductions at Alphabet, Google's parent company.
📊 Economists predict that the ECB, Bank of England, and the Federal Reserve will reduce their interest rates at the same pace in 2024.
That's it for today, guys! Click on ❤️if you liked our review, and see you soon!
➡️ TRADE WITH FBS
@fbsanalytics
🏦 In Davos, bankers joined the chorus of global central banks' warnings against premature interest rate cuts.
🏭 In 2023, Alcoa reduced its alumina production by 13% to 10.908 million tons and increased aluminum output by 5.2% to 2.114 million tons. The company aims to produce 9.8-10 million tons of alumina and 2.2-2.3 million tons of aluminum in 2024.
📉 Samsung has chosen Google's AI to support its latest Galaxy phones.
That's it for today, guys! Click on ❤️if you liked our review, and see you soon!
@fbsanalytics
Please open Telegram to view this post
VIEW IN TELEGRAM
❤76👍39🔥7⚡5💘5❤🔥2🤩1🍾1🦄1
#TradeIdea
👉 🇦🇺 🇨🇭 👈 AUDCHF outlook!
🕯 The AUDCHF pair is currently navigating within a symmetrical triangle, finding consolidation between the critical levels of 0.5675 and 0.5665. The forthcoming price action might unfold in either of these two directions:
🔼 A break above the 0.5675 level could set the stage for an upward move towards the target of 0.5690;
🔽 Conversely, a drop below the 0.5665 support level could quickly lead the pair down to the 0.5650 mark.
🤔 What do you think of this idea? Share in the comments below.👇
➡️ TRADE WITH FBS
@fbsanalytics
@fbsanalytics
Please open Telegram to view this post
VIEW IN TELEGRAM
👍42❤19❤🔥5🐳3✍2🌚2🎉1💯1🆒1🦄1
#TradeIdea
👉 💵 🇻🇦 👈 XBRUSD Analysis!
👀 On the H1, the XBRUSD pair has formed a descending wedge, and the price is near the upper trend line. Moreover, XBRUSD is trading above the Fibonacci 38.2 level, and two scenarios are possible:
🔼 If the price breaks above the 78.00 resistance level and crosses the trendline, it will rush to 78.40 or even 79.10
🔽 However, if XBRUSD bounces off the trendline, the target will be the 76.80 support level
🧐 Are you on the bullish or bearish side? Share your opinion in the comments.👇
➡️ TRADE WITH FBS
@fbsanalytics
@fbsanalytics
Please open Telegram to view this post
VIEW IN TELEGRAM
👍48❤19❤🔥5👎3🔥3💯3✍2🐳2🦄2👏1🆒1
#TradeIdea
👉 🥇 🇻🇦 🛸 👈 XAUUSD Alert!
XAUUSD, consolidating in a bearish rising wedge, tested the 2015.00 resistance level at the Fibonacci golden ratio. A break below the 2008.00 support could signal a downward trend.
🔽 Trade: Sell XAUUSD on a breakout below 2008.00
🎯 TP: 2000.00
Smash ❤️ if you agree! Support other traders!
➡️ TRADE WITH FBS
@fbsanalytics
XAUUSD, consolidating in a bearish rising wedge, tested the 2015.00 resistance level at the Fibonacci golden ratio. A break below the 2008.00 support could signal a downward trend.
🎯 TP: 2000.00
Smash ❤️ if you agree! Support other traders!
@fbsanalytics
Please open Telegram to view this post
VIEW IN TELEGRAM
👍132❤84👎15🤮10✍9⚡6👌6🫡3👏2🐳2🌭1
#TradeIdea
👉 🇻🇬 🇻🇦 🌠 👈 GBPUSD may go down!
💸 In the H1 timeframe, GBPUSD has formed a bearish rising wedge pattern. A break below the support level and crossing the trend line could pave the way for a move to the next support!
🔽 Trade: Sell GBPUSD on a breakout below 1.2680
🎯 TP: 1.2640
Smash 👍 if you agree with the analysis!
➡️ TRADE WITH FBS
@fbsanalytics
🎯 TP: 1.2640
Smash 👍 if you agree with the analysis!
@fbsanalytics
Please open Telegram to view this post
VIEW IN TELEGRAM
👍84❤25❤🔥13👎6🆒6✍3🔥3👏2💯2🦄2🐳1
#AnalyticArticle
🔸 USDJPY is on the verge of a significant breakout!!!
🔍 FBS analyst Tibisay Ramos Medina predicts a rise to 149.00. Check out her latest analysis to see how this move could change the game in the market and how you can benefit!
Don't miss your chance to be the first to know and read the new article👇
👍71❤17❤🔥10🏆3🔥2🎉2👌2👏1
#Education
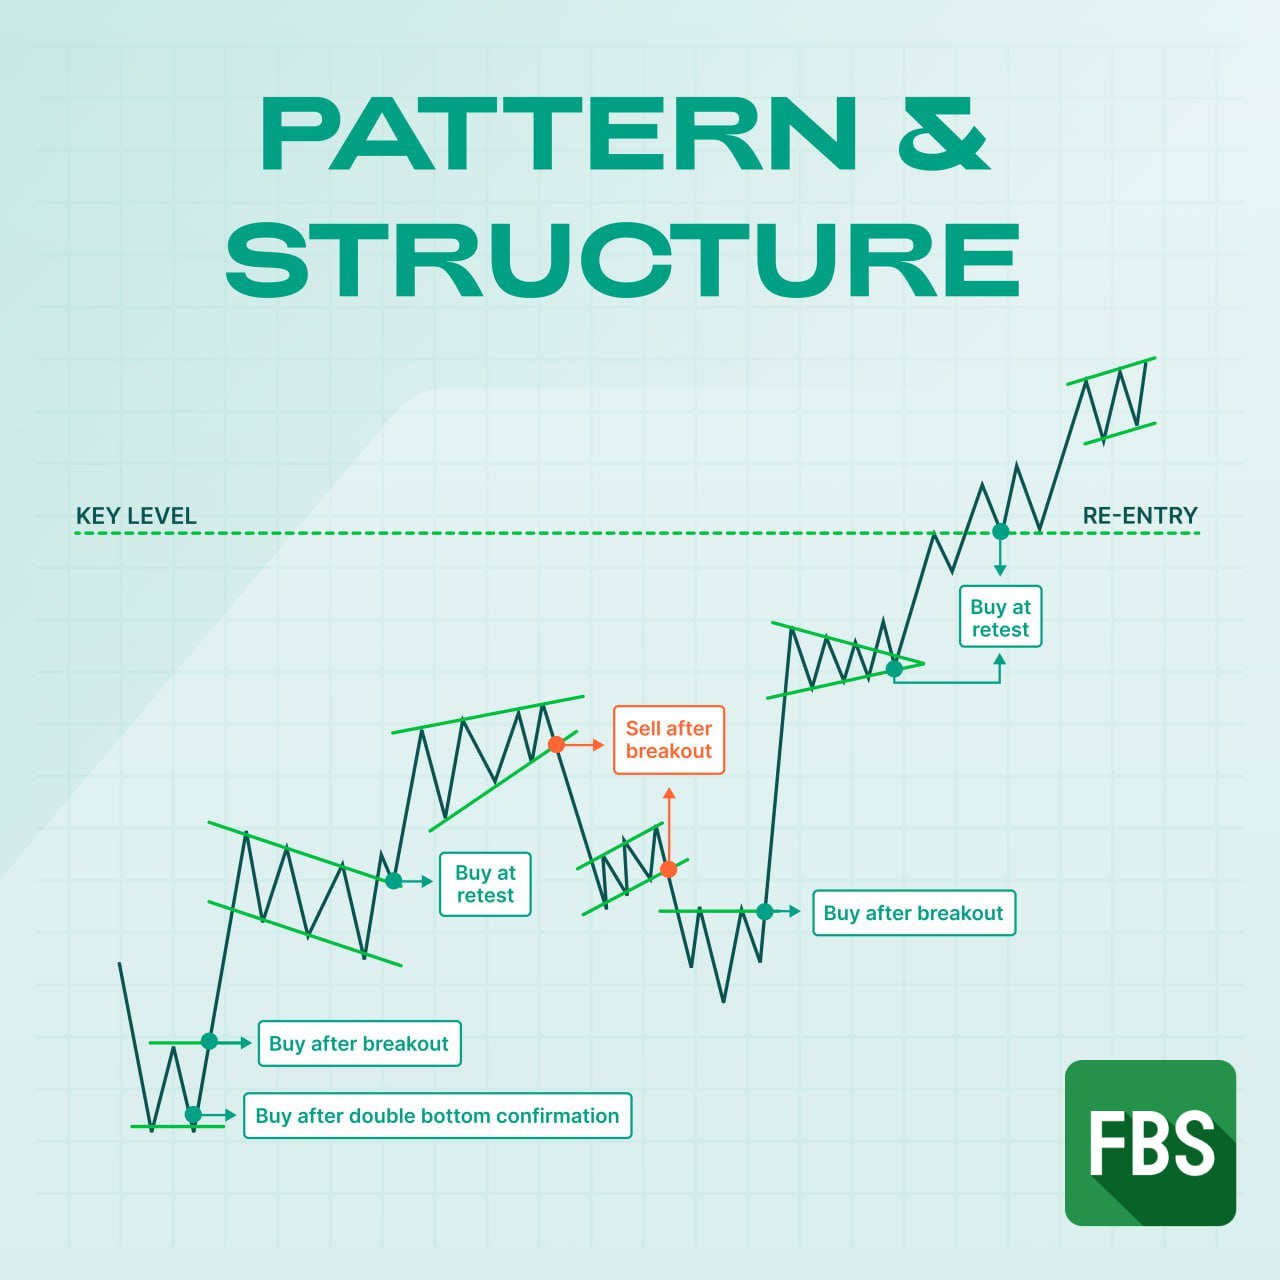
Let's look at your ✨ideal type of chart.✨
📈After a downtrend, a Double Bottom pattern was formed, indicating that the reversal was coming. The break above the neckline after forming a second shoulder confirmed the upside momentum.
📈At some point, the Bullish Flag pattern was implemented. The break and the retest of the Flag pattern's upper border showed that the uptrend was still on.
📉After that, the Rising Wedge pattern was formed with upward-sloping support and resistance lines. Since this pattern was formed after an uptrend, this is a bearish sign. We sell after the breakout of the lower border of the pattern.
📉And that was how the short-term correction began. The downward momentum continued with the Bearish Flag pattern.
📈 The correction ended with the Inversed Head and Shoulders pattern. We bought it after the breakout of the neckline.
📈The continuation of the uptrend happened with the Bullish Pennant Pattern. We could enter the rally after the breakout and retest the pattern's upper border.
After the breakout of the key level (i.e. significant resistance) and a retest we re-entered the market.
🤔 Would you like to learn more about сhart patterns?
❤170👍80❤🔥16🔥9💯8👀5💩4🤩3🐳3🌭3🦄2
#MarketNews
☀️Happy Friday, dear traders! This week was intense, and we hope you enjoyed it! Let's take a look at our end-of-week news!
🇺🇸 Congress approved a temporary budget to avert a partial US government shutdown, passing a bill that President Joe Biden signed into law.
🔔 The IPO market is experiencing its longest cold streak since 1980. In 2021, America's five largest investment banks earned an average of $13 billion per quarter through their deal-making and initial public offering divisions. Over the next two years, they managed barely half that amount.
📊 Shares in Asian markets and the US100 rose thanks to an upbeat outlook for Taiwan Semiconductor Manufacturing Co. that raised hopes for a global recovery in the semiconductor sector.
🔥 Meta is investing billions of dollars to buy Nvidia's advanced H100 graphics chips for artificial intelligence research, planning to incorporate 350,000 such cards into its computing infrastructure by the end of 2024.
🇹🇷 Bond giant Pimco says Turkey is on track for an investment grade rating. The fund manager is betting on economic reforms by buying lira-denominated bonds.
🇯🇵 Japanese shipping companies have abandoned the route through the Red Sea, opting for an alternative route via the Cape of Good Hope, tripling the cost of shipping a single 40-foot container from $2 to $6,600.
💸 Bitcoin ETF beats silver to become the second-largest commodity ETF in the US.
🛢 The International Energy Agency (IEA) predicts higher prices for petroleum products in Europe due to the escalating conflict in Yemen.
❓ How was your trading week? Share your opinion in the comments!
➡️ TRADE WITH FBS
@fbsanalytics
☀️Happy Friday, dear traders! This week was intense, and we hope you enjoyed it! Let's take a look at our end-of-week news!
🛢 The International Energy Agency (IEA) predicts higher prices for petroleum products in Europe due to the escalating conflict in Yemen.
@fbsanalytics
Please open Telegram to view this post
VIEW IN TELEGRAM
❤52👍44❤🔥3🔥3🦄2✍1👎1🤮1🆒1
#TradeIdea
👉 💵 🇻🇦 👈 XBRUSD Outlook!
⚡️ On the H1, XBRUSD has formed an ascending channel, within which the price is approaching the resistance level of 79.10, corresponding to the 61.8 Fibonacci level. Therefore, two scenarios are possible:
🔼 If XBRUSD breaks above 79.10, the price will reach the 80.30 or 81.40 level
🔽 But if Brent bounces off the resistance and overcomes the trend line, the price will get 78.40 or even 77.70.
🧐 Are you on the bullish or bearish side? Share your opinion in the comments.👇
➡️ TRADE WITH FBS
@fbsanalytics
@fbsanalytics
Please open Telegram to view this post
VIEW IN TELEGRAM
👍63❤18🔥8❤🔥5🆒5👎4🤮4🎉1💘1🦄1
#TradeIdea
👉 🇻🇬 🇻🇦 👈 A pivotal moment for GBPUSD!
🕯 GBPUSD is moving within a bearish rising wedge pattern. The price is currently testing the pattern's lower boundary, presenting two trading opportunities:
🔽 If the price breaks below 1.2670 and the 38.2% Fibonacci level, it may pave the way to 1.2610;
🔼 However, a corrective bounce could push the price to 1.2720, associated with the golden Fibonacci ratio.
🤔 What do you think of this idea? Share in the comments below.👇
➡️ TRADE WITH FBS
@fbsanalytics
@fbsanalytics
Please open Telegram to view this post
VIEW IN TELEGRAM
👍67❤13✍8⚡5🔥5🐳3👎2❤🔥1🦄1
#TradeIdea
👉 🥇 🇻🇦 👈 XAUUSD Analysis!
🥇 In the H4 timeframe, gold has formed a descending channel, and after the recent bounce from the lower trendline, the price is testing the 2030 resistance area, which creates two options:
🔼 If the bulls push the price and the price consolidates above 2030, the target will be the resistance of 2045
🔽 But if XAUUSD bounces off the resistance, we can expect a fall to the support of 2000
❓ Predicting a bullish or bearish move? Share your thoughts in the comments 👇
➡️ TRADE WITH FBS
@fbsanalytics
@fbsanalytics
Please open Telegram to view this post
VIEW IN TELEGRAM
👍104❤37❤🔥8👏6🔥5🕊4🐳3🙏2🌚2🤪2🦄2
#TradeIdea
👉 💡 ▶️ ⏩ Key moment for ETHUSD!
🌐 ETHUSD is currently consolidating within a rising bearish wedge. The price approaches the pattern's upper border with a significant resistance level of 2495.00.
🔽 If the price drops below the support level of 2480.00, it would signify a bearish movement towards the target of 2450.00;
🔼 However, a breakthrough above the resistance level 2495.00 would disrupt the bearish scenario and open the path to 2515.00.
🤔 Are you with bulls or bears in this case? Share your thoughts in the comments.👇
➡️ TRADE WITH FBS
@fbsanalytics
@fbsanalytics
Please open Telegram to view this post
VIEW IN TELEGRAM
👍47❤10❤🔥6🤩4⚡3🦄2🔥1🤔1
#networking
🎬 Dive into a Financial Rollercoaster with "The Big Short" 🎬
🔍 Looking for some weekend entertainment? Explore the intriguing world of finance through the lens of "The Big Short" (2015). This film takes you on a wild ride through the events leading up to the 2008 financial crisis. 💥
⭐️ With an all-star cast including Christian Bale, Steve Carell, Ryan Gosling, and Brad Pitt, "The Big Short" offers a gripping portrayal of the financial mavericks who predicted the collapse of the housing market and the ensuing chaos. 🏠
❓ Why should you watch it? "The Big Short" is more than a finance flick; it's a darkly comedic, thought-provoking masterpiece that demystifies complex financial concepts. It'll leave you both informed and entertained. 🧠
➡️ Join us for a cinematic journey that sheds light on the intricacies of the financial world while providing a fresh perspective on a historical event that shaped our times. Enjoy the movie and a weekend filled with enlightenment! 🍿 📺
➡️ TRADE WITH FBS
@fbsanalytics
@fbsanalytics
Please open Telegram to view this post
VIEW IN TELEGRAM
👍85❤25🔥16😍6🐳4🆒4⚡1