
#TradeIdea
👉 💵 🇻🇦 👈 All eyes on XBRUSD!
☄️ On the H4, Brent has formed an ascending channel within which the price is near the upper trendline and is slowly testing the resistance at 80.10.
🔼 If the upper trend line is broken and the resistance 80.10 is crossed, XBRUSD will rise to 81.30
🔽 But if the price bounces off the trendline, it will rush to the support at 77.70 or even to the lower trendline at 76.80
❓ Are you bullish or bearish on XBRUSD? Share your thoughts in the comments👇
➡️ TRADE WITH FBS
@fbsanalytics
@fbsanalytics
Please open Telegram to view this post
VIEW IN TELEGRAM
❤32👍15❤🔥6🔥6👎3🍾3🐳2💯2😍1🌚1
#AnalyticArticle
FBS analyst Adetola Freeman awaits a bullish move from the Japanese Yen. Read his article and get a comprehensive analysis of CADJPY, EURJPY, and USDJPY 👇
FBS analyst Adetola Freeman awaits a bullish move from the Japanese Yen. Read his article and get a comprehensive analysis of CADJPY, EURJPY, and USDJPY 👇
👍58❤🔥10❤8🔥5🙏4✍2🐳2💯2🍾2🤩1🦄1
#TradeIdea
👉 🇻🇬 🇯🇵 👈 GBPJPY Outlook!
⚡️ On the H1 chart, the price rebounded from the support level at 187.500, continuing to test the trend line. Further price movement could develop according to the following scenarios:
🔽 If the price drops below the support level of 187.500, it would signify a trend reversal with a subsequent target of 186.500;
🔼 If the price breaks above 188.300, it will continue moving upward towards the target of 189.200.
🧐 Are you bullish or bearish on GBPJPY? Share in the comments. 👇
➡️ TRADE WITH FBS
@fbsanalytics
@fbsanalytics
Please open Telegram to view this post
VIEW IN TELEGRAM
👍41❤20🔥7🍾5🐳2🌭2❤🔥1⚡1🍌1
#TradeIdea
👉 🇻🇬 🇻🇦 🛸 👈 GBPUSD Opportunity!
📉 In the H1 timeframe, GBPUSD has formed an rising wedge, and the price is currently testing the lower trend line.
🔽 Trade: Sell GBPUSD on a breakout below 1.2700
🎯 TP: 1.2650
Smash 👍 if you're agree with the analysis!
➡️ TRADE WITH FBS
@fbsanalytics
🎯 TP: 1.2650
Smash 👍 if you're agree with the analysis!
@fbsanalytics
Please open Telegram to view this post
VIEW IN TELEGRAM
👍131❤25🔥12✍10❤🔥7🍾6🙏3😍2🐳2🦄2🎉1
#education
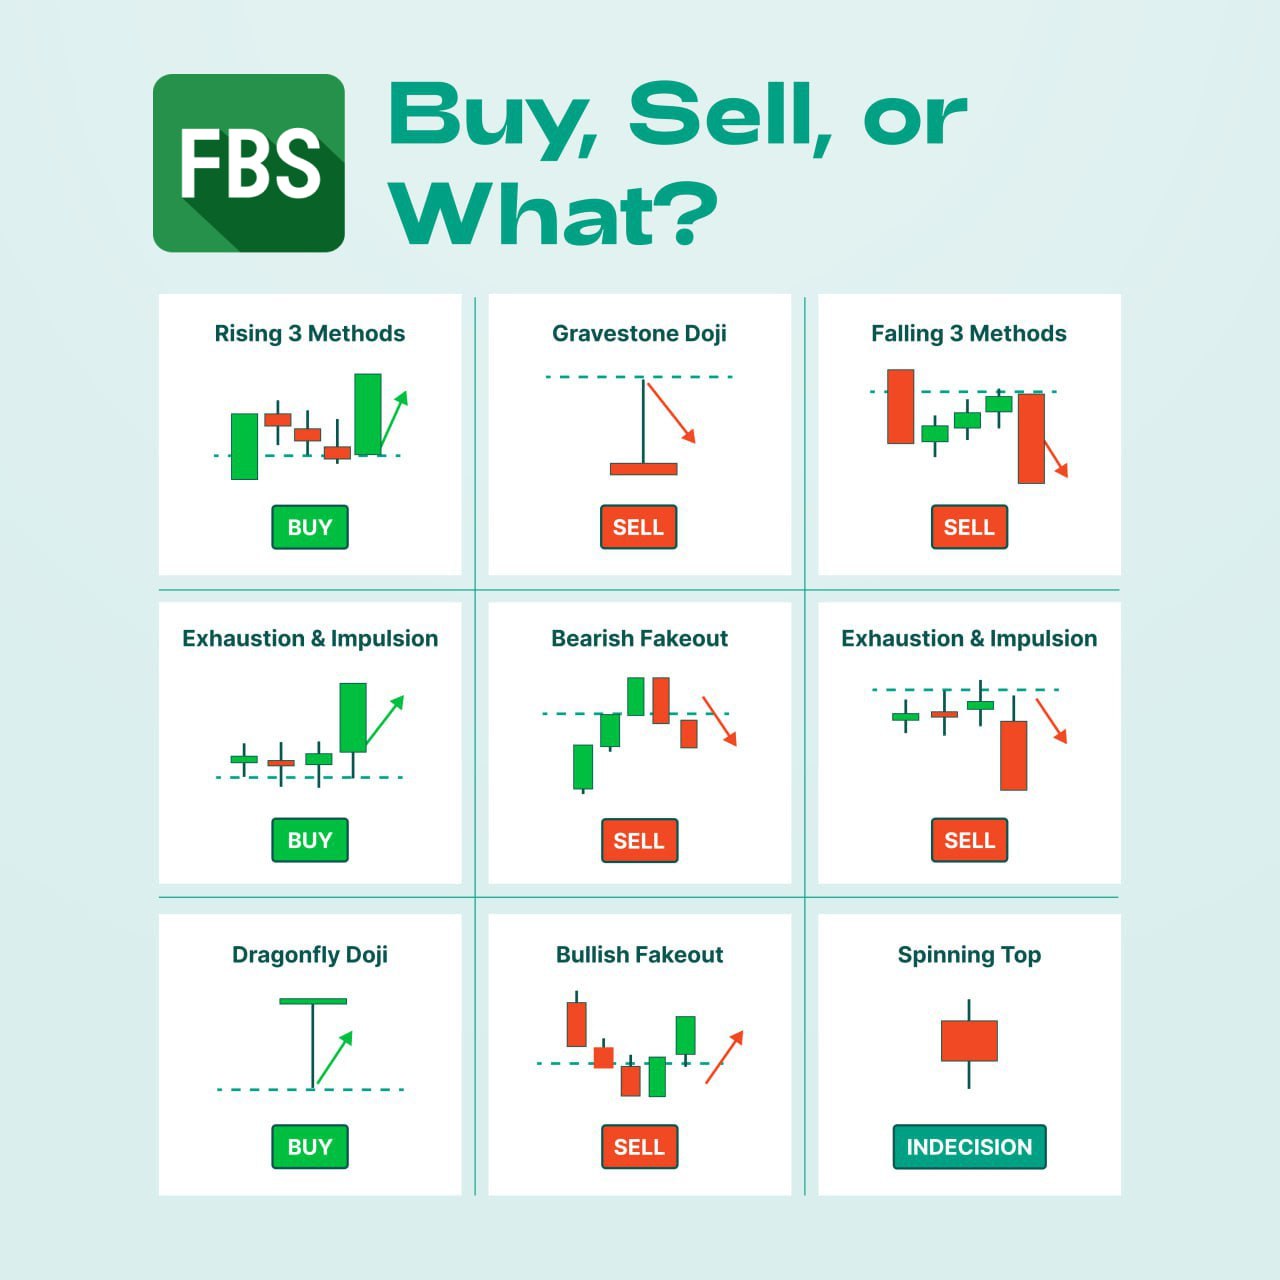
Buy, Sell, or What?
⏳ Every candle you see on the chart is a part of history. It tells what happened with the price and how bulls and bear fought over a certain period.
🕯 Candlestick patterns provide a wide range of opportunities. Some traders use them to seek a reversal or a trend continuation. Others set Stop Losses and Take Profits near their shadows to control risks.
📉 For example, Rising Three Methods tells us that bulls (buyers) took control of the market and pushed the price above the crucial level. Later, sellers entered the game for some time, but it wasn’t for long. As soon as the price touched the support line, it skyrocketed.
📈 Another impressive example is the Bullish Fakeout pattern. This pattern often occurs on forex pairs, gold, and oil. The reason for the price to slide below the support line is Stop Loss activation. As the price finishes collecting money from stop losses, it surges.
💭How often do you use candlestick patterns in your trading?
Buy, Sell, or What?
⏳ Every candle you see on the chart is a part of history. It tells what happened with the price and how bulls and bear fought over a certain period.
🕯 Candlestick patterns provide a wide range of opportunities. Some traders use them to seek a reversal or a trend continuation. Others set Stop Losses and Take Profits near their shadows to control risks.
📉 For example, Rising Three Methods tells us that bulls (buyers) took control of the market and pushed the price above the crucial level. Later, sellers entered the game for some time, but it wasn’t for long. As soon as the price touched the support line, it skyrocketed.
📈 Another impressive example is the Bullish Fakeout pattern. This pattern often occurs on forex pairs, gold, and oil. The reason for the price to slide below the support line is Stop Loss activation. As the price finishes collecting money from stop losses, it surges.
💭How often do you use candlestick patterns in your trading?
❤70👍42🔥12❤🔥3🦄3🥰2🎉2🍾2
#TradeIdea
👉 🥇 🇻🇦 👈 XAUUSD Outlook!
📊 On the H1 timeframe, gold has formed a 'double top' pattern enclosed within a triangle. The critical support level at 2020.00 could lead to the following movements of the asset:
🔽 If XAUUSD breaks below this support level, the price could fall to the 2003.00 mark;
🔼 However, a corrective move followed by a breakout above the 2035.00 resistance could pave the way to 2050.00.
❓ Predicting a bullish or bearish move? Share your thoughts in the comments. 👇
➡️ TRADE WITH FBS
@fbsanalytics
@fbsanalytics
Please open Telegram to view this post
VIEW IN TELEGRAM
👍107❤40✍9🔥6😁4🍾4🆒4🐳3🤩2🙏2😢1
FBS Analytics
#TradeIdea 👉 🇻🇬 🇻🇦 🛸 👈 GBPUSD Opportunity! 📉 In the H1 timeframe, GBPUSD has formed an rising wedge, and the price is currently testing the lower trend line. 🔽 Trade: Sell GBPUSD on a breakout below 1.2700 🎯 TP: 1.2650 Smash 👍 if you're agree with the analysis!…
@fbsanalytics
Please open Telegram to view this post
VIEW IN TELEGRAM
👍177❤62🔥27👏16👌12❤🔥11🐳6🤩5🙏5😨5🌭3
#MarketNews
✋ Good morning, dear traders! Today is Wednesday, January 24, 2024. Let's go deeper into today's market overview:
👩💻 Coinbase is rolling out an "Embedded Wallet" feature, allowing developers to build non-custodial crypto wallets with its Wallet as a Service tech.
🚗 Tesla opened a new tab and has told suppliers it wants to start production of a new mass-market electric vehicle codenamed "Redwood" in mid-2025.
🤜 Tensions between the European Union and China are escalating towards a potential trade war, with the possibility of an imminent shift to overt trade conflict. Senior officials in Brussels have acknowledged this scenario.
🔋 In 2023, Italy set a new record for solar and wind energy production, doubling its capacity from renewable sources.
📈 Alibaba shares in Hong Kong surged following news that Jack Ma recently purchased over $200 million worth of the company's stock.
📺 Netflix shares rose 1.33% in after-hours trading on Tuesday following the company's announcement of gaining 13.1 million subscribers in the fourth quarter, surpassing Wall Street expectations.
🛢 OPEC's mission to stabilize oil prices is becoming increasingly challenging this year as oil supplies from the US and non-OPEC+ countries rise more than expected, leading to a potential market surplus.
📈 Wall Street analysts anticipate that U.S. companies will easily exceed fourth-quarter earnings expectations this reporting season, given the initially low benchmark set before this period.
🌐 Bitcoin (BTCUSD) dropped below $39,000, failing to meet the expectations of a swift rise after the SEC decision. Over the past two weeks, the cryptocurrency has depreciated by 16%.
That's it for today, guys! Click on ❤️if you liked our review, and see you soon!
➡️ TRADE WITH FBS
@fbsanalytics
🔋 In 2023, Italy set a new record for solar and wind energy production, doubling its capacity from renewable sources.
🛢 OPEC's mission to stabilize oil prices is becoming increasingly challenging this year as oil supplies from the US and non-OPEC+ countries rise more than expected, leading to a potential market surplus.
That's it for today, guys! Click on ❤️if you liked our review, and see you soon!
@fbsanalytics
Please open Telegram to view this post
VIEW IN TELEGRAM
👍69❤52👎7👏6⚡4❤🔥3🤮2
#TradeIdea
👉 💡 ▶️ ⏩ XAGUSD Alert!
📈 On the H4, silver has formed a falling wedge during the downward movement, and the price has now broken through the 22.600 resistance.
🔼 Trade: Buy XAGUSD
🎯 TP: 23.400
Smash❤️ if you agree!
➡️ TRADE WITH FBS
@fbsanalytics
🎯 TP: 23.400
Smash
@fbsanalytics
Please open Telegram to view this post
VIEW IN TELEGRAM
❤100👍40🔥11❤🔥6😍5👎3🌭3⚡2🤮2🐳2👌1
#TradeIdea
👉 🇻🇦 🇨🇭 🌠 👈 USDCHF is bearish!
The price is breaking below the 0.8650 support threshold after forming a rising wedge, heralding a transition to bearish momentum. Expectations are growing for a further decline towards the support level of 0.8600.
🔽 Trade: Sell USDCHF on a confirmed breakout below 0.8650;
🎯Targets: 0.8600, 0.8560.
Smash 🔥 if you agree!
➡️ TRADE WITH FBS
@fbsanalytics
The price is breaking below the 0.8650 support threshold after forming a rising wedge, heralding a transition to bearish momentum. Expectations are growing for a further decline towards the support level of 0.8600.
🎯Targets: 0.8600, 0.8560.
Smash 🔥 if you agree!
@fbsanalytics
Please open Telegram to view this post
VIEW IN TELEGRAM
🔥56👍31❤13⚡4👾3🌭1
#AnalyticArticle
🔹 USDCAD: Key Turning Points Ahead!
🔍 FBS analyst Tibisay Ramos Medina sheds light on the pivotal levels in the USDCAD pair, with an eye on potential upward surges or deeper corrections. Discover her latest insights to understand how these movements could redefine market dynamics and offer strategic trading opportunities! 💸
📈 Be ahead of the curve and dive into the new article for detailed scenarios and expert analysis👇
🔹 USDCAD: Key Turning Points Ahead!
🔍 FBS analyst Tibisay Ramos Medina sheds light on the pivotal levels in the USDCAD pair, with an eye on potential upward surges or deeper corrections. Discover her latest insights to understand how these movements could redefine market dynamics and offer strategic trading opportunities! 💸
📈 Be ahead of the curve and dive into the new article for detailed scenarios and expert analysis👇
❤40👍22🔥9❤🔥4🐳3👏2🍾2🆒2⚡1🎉1
#TradeIdea
👉 🇨🇦 🇯🇵 👈 CADJPY Analysis!
🕯 CADJPY is moving in the formed rising wedge, and the price tests the lower trend line. Despite the bearish pattern, the upcoming news may affect the price.
🔽 If the price breaks below the trend line and 109.400 support, it will reach 108.100, corresponding to 61.8 Fibonacci retracement
🔼 But if the CADJPY bounces from the trend line, the nearest target will be the resistance at 110.600
🧐 Are you bullish or bearish on CADJPY? Share in the comments 👇
➡️ TRADE WITH FBS
@fbsanalytics
@fbsanalytics
Please open Telegram to view this post
VIEW IN TELEGRAM
❤35👍21🔥11❤🔥6👏4✍2😍2🐳2🎉1🙏1💯1
#Survey
🌟 We Want to Know Your Opinion! 🌟 🏦 How do you feel about the current regulatory climate in trading? Please cast your vote, and let's see where our community stands!
🌟 We Want to Know Your Opinion! 🌟 🏦 How do you feel about the current regulatory climate in trading? Please cast your vote, and let's see where our community stands!
Anonymous Poll
28%
🥵 Too Restrictive
10%
😤 Not Restrictive Enough
29%
⚖️ Just Right
33%
🤷🏻♂️ Uncertain/No Opinion
❤42👍14🔥7✍4🍾4❤🔥3🌭3👎2🤩2
#TradeIdea
👉 💡 ▶️ ⏩ BTCUSD Outlook!
🕯 BTCUSD completed the Wolfe wave pattern, bouncing off the "sweet zone" and moving toward the support level at 39300. It is essential to consider alternative directions of movement:
🔼 A break of resistance at 40300 will negate the completion of the pattern, setting the target at 41000.
🔽 However, the execution of the model promises a decline to the support level of 39300.
❓ Predicting a bullish or bearish move? Share your thoughts in the comments. 👇
➡️ TRADE WITH FBS
@fbsanalytics
@fbsanalytics
Please open Telegram to view this post
VIEW IN TELEGRAM
👍53❤13🔥8🤝5🌭4⚡3🌚2
#AnalyticArticle
📉Our financial analyst, Adetola Freeman, has a clear view on the XAUUSD target for this decline.
Find it out 👇
📉Our financial analyst, Adetola Freeman, has a clear view on the XAUUSD target for this decline.
Find it out 👇
👍164❤47🔥21👎12🌭10👏5🤮5❤🔥4🤗4⚡3🌚2
#MarketNews
☀️ Happy Thursday, dear traders! Let's check the news moving the financial markets today:
⚡️ Microsoft became the second company after Apple to reach a capitalization of $3 trillion.
📉 Lithium prices are falling due to lower demand for electric cars in China, forcing mining companies to cut costs and revise plans to increase production after the value of the battery metal plunged 80% in a year.
⚠️ LNG shipments through the Suez Canal have come to a complete halt. Increased instability in the Red Sea caused the number of loaded LNG tankers passing through the Suez Canal to zero in the week of Jan. 15-21.
🇨🇳 Chinese investors suffered $45 billion in losses in "snowball" derivatives that promise stable profits under certain stock index trading conditions.
🍎 Apple is stepping up its artificial intelligence developments, buying up startups, and upgrading hardware to incorporate AI into the next generation of iPhones while keeping plans secret and focusing on launching AI apps on mobile devices.
🛢 Oil rose to a near one-month high as US inventories dwindled.
📊 Germany's SAP* will undergo a $2.2 billion restructuring to boost its AI business. SAP SE quotes reacted with a +6.2% rise on the Frankfurt stock exchange.
✈️ US aviation regulators ordered Boeing Co. to suspend further increases in production of 737 Max airplanes.
🚗 Despite Musk's optimism, Tesla shares fell by 6% due to investors' concerns about the company's slowing growth and below-expected quarterly results. At the same time, Tesla's plans to release a new electric car became known.
That's it for today, guys! Click on ❤️if you liked our review, and see you soon!
➡️ TRADE WITH FBS
@fbsanalytics
🍎 Apple is stepping up its artificial intelligence developments, buying up startups, and upgrading hardware to incorporate AI into the next generation of iPhones while keeping plans secret and focusing on launching AI apps on mobile devices.
🛢 Oil rose to a near one-month high as US inventories dwindled.
That's it for today, guys! Click on ❤️if you liked our review, and see you soon!
@fbsanalytics
Please open Telegram to view this post
VIEW IN TELEGRAM
❤84👍46❤🔥7🔥5✍4🆒3👎2💯2🦄2⚡1🤮1
#TradeIdea
👉 🇪🇺 🇻🇦 🚀 👈 EURUSD Outlook!
The EURUSD pair has successfully breached a bullish wedge's upper boundary and retested it. A further break above 1.0910 will confirm the bullish trend and growth towards 1.0970.
🔼 Trade: Buy EURUSD on a breakout above 1.0910;
🎯 TP: 1.0970.
Smash ❤️ if you trade EURUSD today!
➡️ TRADE WITH FBS
@fbsanalytics
The EURUSD pair has successfully breached a bullish wedge's upper boundary and retested it. A further break above 1.0910 will confirm the bullish trend and growth towards 1.0970.
🎯 TP: 1.0970.
Smash ❤️ if you trade EURUSD today!
@fbsanalytics
Please open Telegram to view this post
VIEW IN TELEGRAM
❤75👍35✍6🔥6👏4🌚3🦄2❤🔥1
🎯 TP1: 1.3480
🎯 TP2: 1.3450
Hit 👍 if you agree with the analysis!
@fbsanalytics
Please open Telegram to view this post
VIEW IN TELEGRAM
👍109❤29🔥11🆒8❤🔥5🐳4🍾3⚡2🙏2🎉1🦄1
#TradeIdea
👉 💡 ▶️ ⏩ NZDCAD outlook!
NZDCAD is moving inside a rising bearish wedge. A break of the lower boundary of the pattern could signal the start of a bearish trend. It is also essential to consider alternative price movement scenarios:
🔽 A fall below 0.8260 will lead to reaching the level of 0.8230;
🔼 Conversely, a break above 0.8280 could lead to a rise towards 0.8300.
❓ Predicting a bullish or bearish move? Share your thoughts in the comments. 👇
➡️ TRADE WITH FBS
@fbsanalytics
NZDCAD is moving inside a rising bearish wedge. A break of the lower boundary of the pattern could signal the start of a bearish trend. It is also essential to consider alternative price movement scenarios:
@fbsanalytics
Please open Telegram to view this post
VIEW IN TELEGRAM
❤46👍37🔥10❤🔥5🍾5👏3🐳2🆒2👾2🤩1🦄1
#TradeIdea
👉 🇦🇺 🇻🇦 👈 AUDUSD Analysis!
📊 In the H4 timeframe, AUDUSD is near the upper trend line and is testing the resistance area at 0.6610, so two options are possible:
🔼 If the price breaks the trend line and overcomes the 0.6610 resistance, it will rush to the 0.6660 level
🔽 However, if AUDUSD rebounds from the trend line, it will fall back to 0.6530 support
🧐 Are you on the bullish or bearish side?
➡️ TRADE WITH FBS
@fbsanalytics
@fbsanalytics
Please open Telegram to view this post
VIEW IN TELEGRAM
👍67❤13🔥9❤🔥3🎉2🤩2😍2🙏1🐳1🆒1🦄1