
#MarketNews
👋 Good morning, dear traders! This Monday let's take a close look at today's key news and analyze the upcoming significant events.
📆 Economic calendar
The time zone is GMT+2. Check your time zone here: https://www.timeanddate.com/time/map/
Monday
1️⃣ CNY 16:00, CB Leading Index m/m
Tuesday
1️⃣ EUR 10:00, Spanish Flash CPI y/y
2️⃣ USD 17:00, CB Consumer Confidence
3️⃣ USD 17:00, JOLTS Job Openings
Wednesday
1️⃣ AUD 2:30, CPI y/y
2️⃣ CNY 3:30, Manufacturing PMI
3️⃣ CAD 15:30, GDP m/m
4️⃣ USD 15:30, Employment Cost Index q/q
5️⃣ USD 21:00, Federal Funds Rate
6️⃣ USD 21:00, FOMC Statement
Thursday
1️⃣ GBP 14:00, BOE Monetary Policy Report
2️⃣ GBP 14:00, Official Bank Rate
3️⃣ USD 15:30, Unemployment Claims
4️⃣ USD 17:00, ISM Manufacturing PMI
Friday
1️⃣ USD 15:30, Average Hourly Earnings m/m
2️⃣ USD 15:30, Unemployment Rate
3️⃣ USD 17:00, Revised UoM Consumer Sentiment
📰 News to keep you updated:
💸 Expected interest rate cuts in Europe are boosting the euro's popularity for curry trades, putting pressure on the European currency.
🇨🇳 China is suspending lending to some stocks for short selling from Monday to support the country's falling stock markets.
🛢 The price of oil jumped after Iranian-backed militants attacked US military personnel and the Trafigura oil tanker.
📉 Spot bitcoin ETFs are starting to show a slowdown in investor interest.
⚡️ Hong Kong court ordered liquidating the assets of bankrupt Chinese real estate developer Evergrande.
🥇 Due to high US bond rates in early 2024, the assets of funds investing in gold have fallen to their lowest level since January 2020.
👀 Ahead of upcoming reporting this week, Microsoft, Meta, and Google shares have all hit record highs.
🔔 JPMorgan believes Tesla shares could fall another 30% as earnings support the company's current valuation.
That's it for today, guys! Click on ❤️if you liked our review, and see you soon!
➡️ TRADE WITH FBS
@fbsanalytics
The time zone is GMT+2. Check your time zone here: https://www.timeanddate.com/time/map/
Monday
Tuesday
Wednesday
Thursday
Friday
🛢 The price of oil jumped after Iranian-backed militants attacked US military personnel and the Trafigura oil tanker.
That's it for today, guys! Click on ❤️if you liked our review, and see you soon!
@fbsanalytics
Please open Telegram to view this post
VIEW IN TELEGRAM
👍83❤49❤🔥15✍6🤮6🐳6🔥5👎4🎉2👏1😍1
#TradeIdea
👉 🗽 🕛 Key moment for the US500!
📈 The US500 index has rebounded from resistance at 4908 and established an ascending triangle pattern, with potential scenarios as follows:
🔼 If the price surpasses the resistance level at 4908, the next target will be 4930.
🔽 However, if the price declines below 4885, it will pave the way to the support level 4860.
Do you expect a bullish or bearish move? Share in the comments👇
➡️ TRADE WITH FBS
@fbsanalytics
📈 The US500 index has rebounded from resistance at 4908 and established an ascending triangle pattern, with potential scenarios as follows:
Do you expect a bullish or bearish move? Share in the comments
@fbsanalytics
Please open Telegram to view this post
VIEW IN TELEGRAM
👍46❤18🔥10🆒5👎4🦄3🤮2
#TradeIdea
👉 🇪🇺 🇻🇦 👈 EURUSD Outlook!
🕯 EURUSD continues to move in a descending channel, and the price has approached the lower trend line; the moving averages are intertwined above the price, which may indicate a bearish sentiment, but this needs confirmation.
🔽 If EURUSD breaks below the trend line and fixes below the support at 1.0810, we can expect a fall to 1.0750
🔼 A rebound from the trend line will open the way for the price to the upper trend line to the resistance level of 1.0880
🧐 Are you on the bullish or bearish side?
➡️ TRADE WITH FBS
@fbsanalytics
@fbsanalytics
Please open Telegram to view this post
VIEW IN TELEGRAM
👍101❤23🔥11❤🔥4👎4🎉4😱3⚡2🤩2🍾2🤝2
#TradeIdea
👉 💡 ▶️ ⏩ The critical moment for NZDUSD!
⚡️ NZDUSD has broken above the upper boundary of the bullish falling wedge pattern. A breakout and a sustained move above the resistance level at 0.6120 would confirm the bullish trend.
🔼 Trade: Buy NZDUSD on a breakout above 0.6120.
🎯Target: 0.6145.
Smash 👍🏽 if you will trade this setup!
➡️ TRADE WITH FBS
@fbsanalytics
🎯Target: 0.6145.
Smash 👍🏽 if you will trade this setup!
@fbsanalytics
Please open Telegram to view this post
VIEW IN TELEGRAM
👍61❤20⚡5🔥5✍4👎2🦄2🎉1🤝1
#TradeIdea
👉 🇻🇦 🇨🇦 👈 USDCAD Analysis!
👀 On the H1, USDCAD is within a considerable consolidation and has already formed a double-top pattern. However, two scenarios are possible in this case:
🔼 If the price bounces off the support at 1.3425, it will go up to 1.3525 level
🔽 A breakdown of the support level will mean a fall to 1.3350
❓ Do you expect a bullish or bearish move from USDCAD today? Share in the comments 👇
➡️ TRADE WITH FBS
@fbsanalytics
@fbsanalytics
Please open Telegram to view this post
VIEW IN TELEGRAM
👍44❤11🔥5🐳5✍4🙏4🆒4❤🔥3🤩2🍾1🦄1
#AnalyticArticle
🥇Our financial analyst, Tibisay Ramos, made an insightful analysis of XAUUSD! Take advantage of this opportunity to learn about the next gold move.
Read the article now 👇
🥇Our financial analyst, Tibisay Ramos, made an insightful analysis of XAUUSD! Take advantage of this opportunity to learn about the next gold move.
Read the article now 👇
❤62👍27🔥17🐳5🤩3🌚3🤣3✍2🍾1🆒1🦄1
#blog
👋 Greetings, traders!
🔍 Check out our latest article, "How I Analyze Price On Clean Charts," for an in-depth exploration of clean Forex chart analysis. It's an essential read for traders at every level!
📈 Learn why embracing the simplicity of clean charts can significantly enhance your trading accuracy. We'll guide you through the essentials of streamlining your chart setup.
📚 From mastering the art of price action to identifying key market trends, support, and resistance levels, we've got you covered. Discover how to make sense of market movements with minimal chart clutter!
👀 Bid farewell to overwhelming and overly complex charts. Our tips on using only crucial elements like moving averages and Fibonacci levels will help you keep your analysis precise and effective.
📈 Ready to refine your strategies or build a strong foundation? Elevate your trading skills now👇
👋 Greetings, traders!
🔍 Check out our latest article, "How I Analyze Price On Clean Charts," for an in-depth exploration of clean Forex chart analysis. It's an essential read for traders at every level!
📈 Learn why embracing the simplicity of clean charts can significantly enhance your trading accuracy. We'll guide you through the essentials of streamlining your chart setup.
📚 From mastering the art of price action to identifying key market trends, support, and resistance levels, we've got you covered. Discover how to make sense of market movements with minimal chart clutter!
👀 Bid farewell to overwhelming and overly complex charts. Our tips on using only crucial elements like moving averages and Fibonacci levels will help you keep your analysis precise and effective.
📈 Ready to refine your strategies or build a strong foundation? Elevate your trading skills now👇
❤77👍40🔥12❤🔥8✍5👀5👎3🤮3🙏3🍌2🆒2
#MarketNews
☀️ Happy Tuesday, dear traders! Let's check the news moving the financial markets today:
🛢 According to the US Department of Energy, The United States has purchased an additional 3.1 million barrels of oil for delivery in May to replenish its strategic oil reserve.
🛬 In Davos, the IMF's chief mentioned a notable rise in the likelihood of a "soft landing" for the global economy, a scenario also forecasted by the IMF in its baseline projection, which includes lower inflation.
🧠 Elon Musk's announcement of a successful implant in the human brain by his company Neuralink has triggered a rally in the stocks of companies engaged in human brain research.
🇹🇷 Turkey is considering the prospect of becoming a liquefied natural gas (XNGUSD) exporter, with a relevant bill now before the country's parliament.
🎬 One of the co-founders of Netflix has donated shares worth $1.1 billion to a charitable organization in Silicon Valley.
📈 The Federal Reserve is expected to leave the interest rate unchanged this week, as the economy is growing faster than anticipated while inflation is decreasing.
🌐 The spot Bitcoin ETF race competition is heating up as Invesco and Galaxy reduce their fees from 0.39% to 0.25%.
🇨🇳 Decisions in the Evergrande asset liquidation process will significantly impact China, potentially worsening foreign investor pessimism.
❓ What exciting trades are on your radar today? Share your thoughts in the comments! 👇
➡️ TRADE WITH FBS
@fbsanalytics
🛢 According to the US Department of Energy, The United States has purchased an additional 3.1 million barrels of oil for delivery in May to replenish its strategic oil reserve.
@fbsanalytics
Please open Telegram to view this post
VIEW IN TELEGRAM
👍57❤29✍8🔥6👎1🦄1
#TradeIdea
👉 💡 ▶️ ⏩ A key moment for the US30!
⚡️ The US30 index consolidates within a rising wedge pattern and tests its upper boundary. Further price movement can unfold according to the following scenarios:
🔼 If the price surpasses the resistance level at 38400, the next target will be 38600.
🔽 However, a break below 38100 could pave the way to the support level 37800.
Do you expect a bullish or bearish move? Share in the comments 👇
➡️ TRADE WITH FBS
@fbsanalytics
Do you expect a bullish or bearish move? Share in the comments 👇
@fbsanalytics
Please open Telegram to view this post
VIEW IN TELEGRAM
👍58🔥14❤8🐳4✍2❤🔥2😎2🍾1
#TradeIdea
👉 🇻🇦 🇨🇭 👈 All eyes on USDCHF!
👀 On the H1, USDCHF has formed a descending triangle pattern, and the price has recently bounced off the support area, approaching the upper trend line.
🔼 A break above the trendline and crossing 0.8640 resistance will open the way to the 0.8680 level
🔽 A potential bounce off the trendline will bring the price back to 0.8610
Do you expect a bullish or bearish move today? Share in the comments👇
➡️ TRADE WITH FBS
@fbsanalytics
Do you expect a bullish or bearish move today? Share in the comments
@fbsanalytics
Please open Telegram to view this post
VIEW IN TELEGRAM
👍63❤🔥16❤11🔥7🗿6👎5🤣4🆒4✍3🎉3🤮1
#TradeIdea
👉 🥇 🇻🇦 👈 All eyes on XAUUSD!
👁🗨 XAUUSD is currently testing a critically important resistance level at 2040.00, also associated with the golden Fibonacci ratio. The further price movement can be considered in two scenarios:
🔼 A breakout above the 2040.00 resistance level potentially leads to a move toward the 2050.00 level.
🔽 A corrective movement towards the channel's lower boundary at the support level 2024.00.
❓ Do you expect a bullish or bearish move today? Share in the comments. 👇
➡️ TRADE WITH FBS
@fbsanalytics
@fbsanalytics
Please open Telegram to view this post
VIEW IN TELEGRAM
❤69👍55🔥12🌭7⚡6❤🔥6😈3🦄2
@fbsanalytics
Please open Telegram to view this post
VIEW IN TELEGRAM
❤33👍16🔥10🐳5✍2🤯2🆒2❤🔥1🤩1🍾1🦄1
#TradeIdea
👉 🇻🇦 🇨🇦 👈 USDCAD Outlook!
☄️ USDCAD has formed a falling wedge, which is a bullish pattern, and now the price is testing the upper trend line.
🔼 If USDCAD overcomes the trend line and crosses the resistance at 1.3440, it will start rising to 1.3490 level
🔽 But if the bears push the price again, we can expect a fall to the support at 1.3400
❓ Are you bullish or bearish on USDCAD? Share your thoughts in the comments👇
➡️ TRADE WITH FBS
@fbsanalytics
@fbsanalytics
Please open Telegram to view this post
VIEW IN TELEGRAM
👍42❤16🆒10🔥4🙏4✍3👏2❤🔥1🎉1🐳1🦄1
#Education
🤔What is day trading?
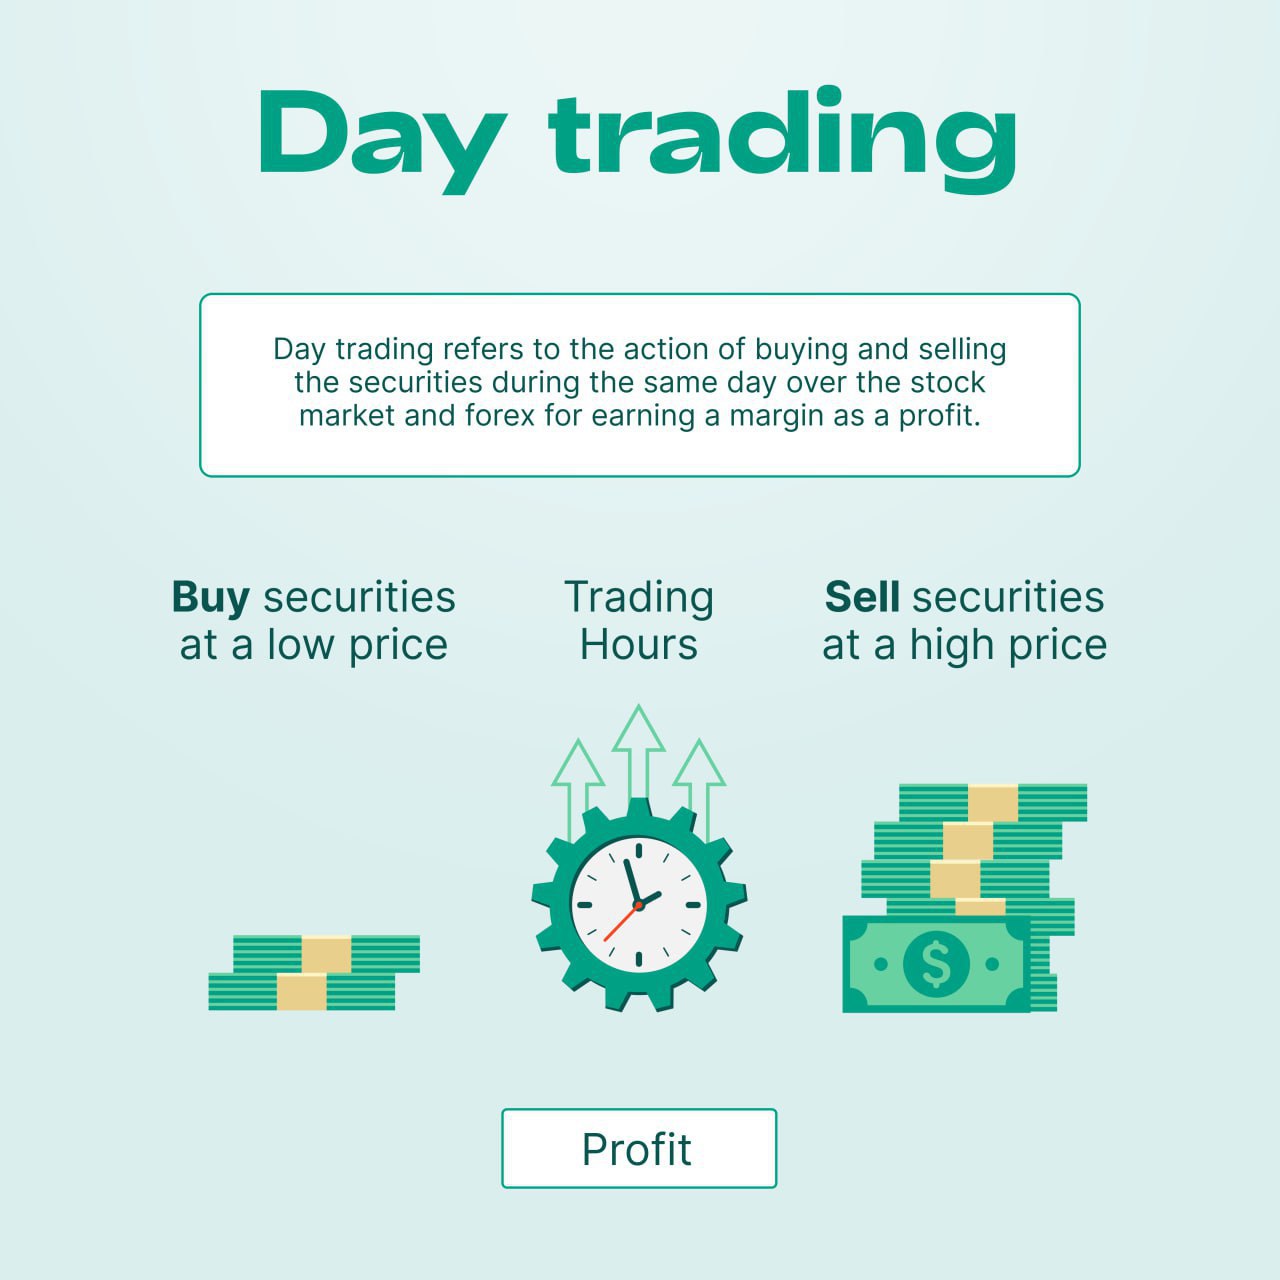
Day trading is when traders open and close their positions on the same day. This approach aims to profit from short-term price movements. Day traders are known for their fast-paced, high-risk approach to trading, and they typically use technical analysis to identify trading opportunities.
👆Traders can use many different day trading strategies to try to generate profits. Here are a few examples:
📈Breakout trading: Breakout trading involves entering trades when the price of an asset breaks through a key level of support or resistance. Traders look for assets trading within a range and then make a big move when they break out of that range. Breakout traders often use chart patterns like triangles, flags, and pennants to identify potential breakouts.
📰News trading: News trading involves trading based on important economic or corporate news releases. Traders look for assets likely affected by the news and then try to profit from the resulting price movements. News traders often use news feeds, economic calendars, and social media to stay up-to-date on important events.
🚦Range trading: Range trading involves buying assets when they are at the bottom of a range and selling them when they are at the top of the range. Traders look for assets trading within a range for a while and then try to profit from the predictable price movements. Range traders often use technical indicators like the Relative Strength Index (RSI) and the Stochastic Oscillator to identify oversold and overbought conditions.
❗️In conclusion, day trading is a high-risk, high-reward trading strategy requiring much skill, knowledge, and discipline. Traders can use various strategies to generate profits, but they must be willing to accept the risks of day trading. Traders must educate themselves, develop a trading plan, and manage risk carefully to succeed.
What kind of trader are you?
🤔What is day trading?
Day trading is when traders open and close their positions on the same day. This approach aims to profit from short-term price movements. Day traders are known for their fast-paced, high-risk approach to trading, and they typically use technical analysis to identify trading opportunities.
👆Traders can use many different day trading strategies to try to generate profits. Here are a few examples:
📈Breakout trading: Breakout trading involves entering trades when the price of an asset breaks through a key level of support or resistance. Traders look for assets trading within a range and then make a big move when they break out of that range. Breakout traders often use chart patterns like triangles, flags, and pennants to identify potential breakouts.
📰News trading: News trading involves trading based on important economic or corporate news releases. Traders look for assets likely affected by the news and then try to profit from the resulting price movements. News traders often use news feeds, economic calendars, and social media to stay up-to-date on important events.
🚦Range trading: Range trading involves buying assets when they are at the bottom of a range and selling them when they are at the top of the range. Traders look for assets trading within a range for a while and then try to profit from the predictable price movements. Range traders often use technical indicators like the Relative Strength Index (RSI) and the Stochastic Oscillator to identify oversold and overbought conditions.
❗️In conclusion, day trading is a high-risk, high-reward trading strategy requiring much skill, knowledge, and discipline. Traders can use various strategies to generate profits, but they must be willing to accept the risks of day trading. Traders must educate themselves, develop a trading plan, and manage risk carefully to succeed.
What kind of trader are you?
👍100❤31🔥9❤🔥4🐳4🌭3🆒3⚡2👎2🤮2
#MarketNews
👋 Hello, dear traders! Today is Wednesday, January 31, 2024. It is time to explore what is happening in today's financial world:
📉 Microsoft reported its second-quarter earnings on Tuesday, beating revenue and profit expectations. The company's stock fell 1% after the report was released. Google shares are also falling.
🇺🇸 Analysts expect the US Federal Reserve to leave interest rates unchanged but are beginning to consider lowering them further, balancing inflation and economic growth.
☄️ After the Alphabet and Microsoft report, AI companies lost $190 billion in market capitalization. According to the "buy on rumors - sell on facts" rule, profit-taking is underway in the US market.
🌐 JP Morgan: Today's stock market, dominated by large technology companies, has the hallmarks of a dot-com bubble.
🛢 Oil prices are down in the morning but end the month up for the first time since September amid tensions in the Middle East. Meanwhile, Saudi Arabia's GDP shrinks by 3.7% in 4Q 2023 due to falling oil prices.
🔥 A Delaware judge voided Elon Musk's $55 billion Tesla pay package after a shareholder challenge, potentially impacting Musk's fortune and Tesla's future.
🔴 Global gold demand is forecast to reach a new high in 2024, driven by central-bank purchases and over-the-counter buying, amidst expectations of the Federal Reserve reducing interest rates.
⭐️ Experts note that introducing the bitcoin-ETF in the US deepens the links between cryptocurrencies and traditional finance, potentially increasing risks in both sectors.
📊 IMF raises Asia's economic growth forecast 2024 to 4.5% from 4.2%. IMF: Inflationary pressures in Asia are easing rapidly, increasing the chances of a soft landing in the region's economies.
That's it for today, guys! Click on ❤️if you liked our review, and see you soon!
➡️ TRADE WITH FBS
@fbsanalytics
🛢 Oil prices are down in the morning but end the month up for the first time since September amid tensions in the Middle East. Meanwhile, Saudi Arabia's GDP shrinks by 3.7% in 4Q 2023 due to falling oil prices.
That's it for today, guys! Click on ❤️if you liked our review, and see you soon!
@fbsanalytics
Please open Telegram to view this post
VIEW IN TELEGRAM
❤72👍32🔥8❤🔥4👎4🤩3🆒3🤮1🦄1
#TradeIdea
👉 🇻🇦 🇯🇵 👈 All eyes on USDJPY!
👀 USDJPY is currently within a symmetrical triangle pattern, approaching a retest of its lower boundary. Two potential scenarios are in play:
🔼 A breakout above the 148.000 resistance level, potentially targeting 148.900.
🔽 A corrective move below the channel's lower boundary at 147.200 support, potentially leading to 146.300.
Do you expect a bullish or bearish move today? Share in the comments 👇
➡️ TRADE WITH FBS
@fbsanalytics
Do you expect a bullish or bearish move today? Share in the comments 👇
@fbsanalytics
Please open Telegram to view this post
VIEW IN TELEGRAM
👍60❤14❤🔥6🔥6👎3✍2🍾2🦄1
#TradeIdea
👉 🦅 🕛 A key moment for the US100!
📊 On the H1, the US100 is falling sharply and has already broken several vital levels, and currently, the price is testing the support level of 17.260, corresponding to the 38.2 Fibonacci level.
🔼 If the price bounces off the support level, the price will go back up to the 17420 level
🔽 But a break below 17260 will open the way to 17000 support
🧐 Are you on the bullish or bearish side?
➡️ TRADE WITH FBS
@fbsanalytics
@fbsanalytics
Please open Telegram to view this post
VIEW IN TELEGRAM
👍58❤10🔥7🎉7🐳4❤🔥3👎2🕊2⚡1🤮1🦄1
#TradeIdea
👉 🇪🇺 🇯🇵 👈 EURJPY Outlook!
🕯 EURJPY has formed a descending channel pattern; the price is near the upper trend line, testing the Fibonacci 23.6 level, which creates two options:
🔼 A break of the trend line and resistance at 160.200 will send the price up to the 161.000 level
🔽 At the same time, a rebound from the trend line is possible, which makes 159.200 a potential target
Smash ❤️ if you trade EURJPY!
➡️ TRADE WITH FBS
@fbsanalytics
Smash ❤️ if you trade EURJPY!
@fbsanalytics
Please open Telegram to view this post
VIEW IN TELEGRAM
❤54👍28🔥12❤🔥8🙏4🌭3👨💻3🎉1🤩1🐳1🆒1
#TradeIdea
👉 💡 ▶️ ⏩ XNGUSD Outlook!
🕯 XNGUSD is currently within a descending wedge pattern and continues to test the trendline of the overall descending trend. Further price developments may unfold according to the following scenarios:
🔼 A breakout above the 2.100 resistance level will open the path towards 2.300 and possibly even 2.400;
🔽 A decline below the 2.000 support level will lead us to the target of 1.870.
🤔 Do you support bulls or bears in this case?
➡️ TRADE WITH FBS
@fbsanalytics
@fbsanalytics
Please open Telegram to view this post
VIEW IN TELEGRAM
👍49❤17🔥8👌6✍3⚡2❤🔥1🦄1