
Actual — 303K
Expected — 212K
Previous — 270K
Actual — 0.3%
Expected — 0.3%
Previous — 0.2%
Actual — 3.8%
Expected — 3.9%
Previous — 3.9%
Please open Telegram to view this post
VIEW IN TELEGRAM
🔥61👍30❤20✍5😎5🆒4⚡3🎉3🍾2😭1
#Forecast
👉 💡 ▶️ ⏩ Microsoft Forecast!
📈 Microsoft (#MICROSOFT) is moving in a rising channel, and the price is steadily rising. Microsoft's investments in artificial intelligence and OpenAI are expected to boost the company's revenue, reinforcing the stock's further upside to 261.8 Fibonacci.
🔼 Trade: Buy Microsoft on a breakout above 430.00
😵 TP: 460.00
❓ What stocks do you trade? Share your trades in the comments🔽
➡️ TRADE WITH FBS
@fbsanalytics
@fbsanalytics
Please open Telegram to view this post
VIEW IN TELEGRAM
👍33❤6🔥5👏4❤🔥3💯2🎉1🌚1😨1
#networking
⭐️ Happy Friday, traders!⭐️
📚 Start your weekend with an enlightening read, "Secrets for Profiting in Bull and Bear Markets" by Stan Weinstein.
👇 Here's why this book is a must-read:
💠 "Secrets for Profiting in Bull and Bear Markets" provides invaluable insights into timing investments for consistent profitability.
💠 Stan Weinstein shares his philosophy on investing and offers practical advice on refining the buying process and knowing when to sell.
💠 The book discusses using long-term indicators to identify Bull and Bear markets, making it a timeless resource for traders.
➡️ This book educates and inspires critical thinking about investment strategies and market dynamics.
❓ What book would you recommend to fellow traders? Share in the comments below! 💬
➡️ TRADE WITH FBS
@fbsanalytics
@fbsanalytics
Please open Telegram to view this post
VIEW IN TELEGRAM
❤47👍47🔥10❤🔥5🎉3🍾3✍2⚡2🐳2🌭2😁1
#meme
🎉 Have a Good Weekend, everybody!🎉
📌 A stop loss is the cornerstone of smart risk management. Set it to define your losses before the market does. 🔪
➡️ TRADE WITH FBS
@fbsanalytics
@fbsanalytics
Please open Telegram to view this post
VIEW IN TELEGRAM
🤣108👍46❤21😁14🔥8❤🔥6🤪4🦄3🍾2🗿2🆒2
👉 Tap to connect: @FBSchatbot
Please open Telegram to view this post
VIEW IN TELEGRAM
🔥49👍24❤17❤🔥6🎉5😁3⚡2🤨2🍾2✍1
#LiveStreamAlert
⭐️ Happy Sunday, Traders! ⭐️
⏰ Mark your calendars! Join us for the Weekly Market Outlook with Adetola Freeman!
📆 Starting on 08.04.2024 at 16:00 pm GMT+3 (MetaTrader time), Adetola Freeman from FBS will provide expert insights and in-depth analysis of the upcoming week in the financial markets.
🎞 Take advantage of this chance to stay informed and ahead of the game! Tune in for valuable knowledge and actionable strategies to navigate the markets effectively. See you there!
https://www.youtube.com/watch?v=AQDXWOOb2KQ
https://www.youtube.com/watch?v=AQDXWOOb2KQ
Please open Telegram to view this post
VIEW IN TELEGRAM
YouTube
Weekly Market Review – April 8
Check the FBS website: https://bit.ly/3TKMeU4
More analytics: https://bit.ly/3voOG9p
The best telegram channel: https://t.me/fbsanalytics
Join us for an exclusive YouTube live stream as our FBS partner from Africa, FBS financial expert Adetola Freeman will…
More analytics: https://bit.ly/3voOG9p
The best telegram channel: https://t.me/fbsanalytics
Join us for an exclusive YouTube live stream as our FBS partner from Africa, FBS financial expert Adetola Freeman will…
👍52🔥17❤13👀3❤🔥2✍2🥴1
#MarketNews
👋 Good morning, dear traders! How are you? Let’s discuss the most exciting news for the beginning of the week.
📆 Economic calendar
The time zone is GMT+3. Check your time zone here: https://www.timeanddate.com/time/map/
Monday
1️⃣ CHF 18:15, SNB Chairman Jordan Speaks
Wednesday
1️⃣ NZD 5:00, Official Cash Rate
2️⃣ USD 15:30, Core CPI m/m
3️⃣ USD 15:30, CPI y/y
4️⃣ USD 15:30, CPI m/m
5️⃣ CAD 16:45, BOC Monetary Policy Report
6️⃣ CAD 16:45, Overnight Rate
7️⃣ CAD 17:30, BOC Press Conference
8️⃣ USD 21:00, FOMC Meeting Minutes
Thursday
1️⃣ EUR 15:15, Main Refinancing Rate
2️⃣ USD 15:30, Core PPI m/m
3️⃣ USD 15:30, PPI m/m
4️⃣ USD 15:30, Unemployment Claims
5️⃣ EUR 15:45, ECB Press Conference
6️⃣ USD 20:01, 30-y Bond Auction
Friday
1️⃣ GBP 9:00, GDP m/m
2️⃣ USD 17:00, Prelim UoM Consumer Sentiment
📰 News to keep you updated:
⚡️ India could surpass China as the world's top economic growth engine by 2028, fueled by infrastructure investments, skilled workforce development, urban expansion, and manufacturing growth.
🥇 Gold surged to a new high above $2,350 an ounce, driven by anticipation of upcoming US inflation data and geopolitical tensions.
🇪🇺 ECB officials are debating potential back-to-back rate cuts this summer as inflation approaches the 2% target and monetary easing discussions intensify.
🇩🇪 German industrial production's 2.1% rise in February signals potential recovery from a recession, surpassing expectations amidst economic challenges.
🚗 Elon Musk announces the unveiling of Tesla's robotaxi on August 8, advancing Tesla's commitment to self-driving technology amidst past delays. Tesla (#TESLA) stock is down 3.63% today.
🛢 Oil prices dropped over 1% amid easing Middle East tensions and ceasefire talks, reducing concerns about supply disruptions.
That's it for today, guys! Click on❤️ if you liked our review, and see you soon!
➡️ TRADE WITH FBS
@fbsanalytics
The time zone is GMT+3. Check your time zone here: https://www.timeanddate.com/time/map/
Monday
Wednesday
Thursday
Friday
🛢 Oil prices dropped over 1% amid easing Middle East tensions and ceasefire talks, reducing concerns about supply disruptions.
That's it for today, guys! Click on
@fbsanalytics
Please open Telegram to view this post
VIEW IN TELEGRAM
👍50❤22❤🔥10🔥5💯5🤝2🎉1🌭1
#TradeIdea
👉 🥇 🇻🇦 👈 XAUUSD Analysis!
🔥 XAUUSD broke above the trendline and is now retesting it alongside the 2335 support level. Here are the scenarios:
🔼 If the support at 2335 holds, we may see a rally towards 2370;
🔽 However, a break below the trendline could signal a decline towards 2305.
🥇 What's your take? Bullish or bearish on XAUUSD? Let's hear your thoughts! 🔽
➡️ TRADE WITH FBS
@fbsanalytics
@fbsanalytics
Please open Telegram to view this post
VIEW IN TELEGRAM
👍68❤19🔥13❤🔥8🆒4💩3🤝3⚡2💯1
#TradeIdea
👉 🇻🇦 🇨🇦 👈 USDCAD Analysis!
👀 On the H2, USDCAD is in a long-term uptrend; now, the price has reached a significant resistance again, from which there have already been several bounces.
🔽 If USDCAD bounces from 1.3610 resistance again, the downside target will be 1.3520;
🔼 However, in the case of a breakdown of 1.3610, the upside will be 1.3690.
❓ Are you on the bullish or bearish side? Share your opinion in the comments👇
➡️ TRADE WITH FBS
@fbsanalytics
@fbsanalytics
Please open Telegram to view this post
VIEW IN TELEGRAM
👍42❤14❤🔥13🔥9👀4🏆2⚡1
#InstrumentoftheWeek
⚡️ European Indices in the Spotlight: FR40, EU50, ES35! ⚡️
➡️ Exciting news from FBS! This week, we offer a special deal on three leading European indices: FR40, EU50, and ES35. Enjoy a 35% spread reduction on these dynamic markets. Take advantage of the opportunity to trade the pulse of the European economy at an unprecedented price!
⏳ Time is running out! This offer is valid only this week! 🔥
🚀 Boost your trading with FBS👇
➡️ TRADE WITH FBS
@fbsanalytics
@fbsanalytics
Please open Telegram to view this post
VIEW IN TELEGRAM
👍30❤13🔥6🍌4✍2😁2🆒2🎉1🍾1
FBS Analytics
#InstrumentoftheWeek ⚡️ European Indices in the Spotlight: FR40, EU50, ES35! ⚡️ ➡️ Exciting news from FBS! This week, we offer a special deal on three leading European indices: FR40, EU50, and ES35. Enjoy a 35% spread reduction on these dynamic markets.…
#TradeIdea
👉 💡 ▶️ ⏩ ES35 Technical Analysis!
🇪🇸 ES35 is moving in a long-term uptrend, but the price has bounced from 261.8 Fibonacci and broken sharply through the trendline between two critical levels.
🔽 If the price breaks the MA100 and falls below the 10850 support, there will be a reversal and fall to 10600;
🔼 Otherwise, if the bulls can push the price higher, ES35 will return to 11130 resistance.
💬 How often do you trade indices? Write in the comments👇
➡️ TRADE WITH FBS
@fbsanalytics
@fbsanalytics
Please open Telegram to view this post
VIEW IN TELEGRAM
👍23❤8🔥5🆒3✍1❤🔥1⚡1🌭1💯1
#LiveStream
🚀 Join Our Exclusive Weekly Market Analysis with Adetola Freeman! 🚀
🔥 This week, your guide will be Adetola Freeman, an FBS expert with a wealth of experience and knowledge. Our session starts at 16:00 GMT+3 (MetaTrader time).
🌟 Don't miss the opportunity to learn what you can trade this week! 🌟
➡️ Join stream: LIVE STREAM
➡️ TRADE WITH FBS
@fbsanalytics
@fbsanalytics
Please open Telegram to view this post
VIEW IN TELEGRAM
YouTube
Weekly Market Review – April 8
Check the FBS website: https://bit.ly/3TKMeU4
More analytics: https://bit.ly/3voOG9p
The best telegram channel: https://t.me/fbsanalytics
Join us for an exclusive YouTube live stream as our FBS partner from Africa, FBS financial expert Adetola Freeman will…
More analytics: https://bit.ly/3voOG9p
The best telegram channel: https://t.me/fbsanalytics
Join us for an exclusive YouTube live stream as our FBS partner from Africa, FBS financial expert Adetola Freeman will…
👍22❤🔥8❤6✍4⚡3🔥3👀1
Anonymous Quiz
17%
⚫️ 2011
15%
🟣 2010
31%
🔴 2009
37%
🟡 2008
👍77❤20✍13😨9🤪9⚡7🔥4🆒3❤🔥2🌭2🐳1
#MarketNews
☀️ Happy Tuesday, dear traders! Let's check the news moving the financial markets today:
🇺🇸 According to JPMorgan's CEO, sustained inflationary pressure, driven partly by budget deficits and military conflicts, may prompt the Fed to raise rates to 8% or higher.
🥇 Gold maintains record highs ahead of the US inflation data release amidst the strongest historical disparity between gold prices and real yields on US 10-year bonds. XAUUSD climbed to 2345.
🛢 Goldman suggests that Brent oil prices are unlikely to reach $100. XBRUSD is currently trading at 90.
📈 Wells Fargo raises the S&P 500 year-end target for 2024 from 4625 to 5535 points amid bullish market sentiment, optimism about AI, and potential easing of Fed policy. US500 currently stands at 5210.
🇪🇺 Citi has revised its forecast, expecting 4 ECB rate cuts this year, each by 0.25%, down from the previous expectation of 5 cuts. EU50 stands at 5049.
🇯🇵 The head of the Bank of Japan noted that the soft monetary policy is preserved, and stimulus cuts are possible. Further rate plans will depend on the data. Meanwhile, JP225 rises to 39760.
🌐 Consumers split on Bitcoin's future, with a third anticipating a drop below 20 000 by year-end, per a Deutsche Bank survey. BTCUSD is now at 70 862.
❌ Turkey imposes export restrictions on Israel after a disagreement over aid shipments to Gaza. Trade Ministry limits exports on 54 manufactured goods starting April 9.
That's it for today, guys! Click on❤️ if you liked our review, and see you soon!
➡️ TRADE WITH FBS
@fbsanalytics
🛢 Goldman suggests that Brent oil prices are unlikely to reach $100. XBRUSD is currently trading at 90.
That's it for today, guys! Click on
@fbsanalytics
Please open Telegram to view this post
VIEW IN TELEGRAM
❤31👍30🔥10🤝4⚡3❤🔥1🆒1
#TradeIdea
👉 🇪🇺 🇻🇦 👈 EURUSD Update!
💸 After the bearish trend, EURUSD has been gradually rising, but now the price is testing the vital resistance area again, creating two possible developments.
🔼 A break of the resistance at 1.0860 will open the way to further growth up to 1.0940;
🔽 A rebound from the resistance area will cause the price to fall to 1.0800.
❓ What do you think the EURUSD is bullish or bearish today?👇
➡️ TRADE WITH FBS
@fbsanalytics
@fbsanalytics
Please open Telegram to view this post
VIEW IN TELEGRAM
👍43❤🔥20❤8🔥6⚡4🆒2👏1🏆1
#TradeIdea
👉 💡 ▶️ ⏩ BTCUSD is bullish!
💸 BTCUSD recently tested the trendline and 70500 support level, exhibiting a hidden divergence with the RSI oscillator across multiple timeframes (30M, 1H, 4H), signaling a potential bullish movement.
🔼 Trade: Buy BTCUSD;
🎯 TP: 72500.
🚀 Join FBS analysts in riding the BTCUSD rally! Are you in? 💬
➡️ TRADE WITH FBS
@fbsanalytics
🎯 TP: 72500.
@fbsanalytics
Please open Telegram to view this post
VIEW IN TELEGRAM
👍38❤10🔥7❤🔥3✍2💯2😎2
#TopoftheWeek
👋 Greetings, guys! Check out our recap of last week’s opportunities!
📈 Top gainers:
🟢 Spotify Technology S.A. (#SPOT) +16.47%. The significant rise in Spotify's stock price last week was influenced by reports of upcoming price increases for its premium subscription service in various markets, including the US, later this year. These planned price hikes are part of Spotify's strategy to enhance its revenue streams.
🟢 AUDCAD +1.33%. The AUDCAD exchange rate increased by 1.33% due to weaker Canadian labor market data, specifically a decline in Employment Change by -2.2K and an increase in the Unemployment Rate to 6.1%.
📉 Top losers:
🟠 Ulta Beauty, Inc. (#ULTA) -15.93%. The significant drop in Ulta Beauty, Inc.'s stock price last week can be attributed to a warning from the company's CEO about a slowdown in demand across the entire beauty category. This announcement led to concerns over cooling demand.
🟠 GBPAUD -0.90%. The GBPAUD's price movement last week may have been influenced by technical bearish trends and specific economic events, notably bank holidays in Australia and New Zealand, which could have affected market liquidity and trading dynamics.
❓ What are your expectations for this week? Share in the comments!
➡️ TRADE WITH FBS
@fbsanalytics
@fbsanalytics
Please open Telegram to view this post
VIEW IN TELEGRAM
👍34❤14🔥4⚡3🦄3😎3👀1💅1🆒1
#TradeIdea
👉 🥇 🇻🇦 👈 XAUUSD Analysis!
⭐️ On the 30M timeframe, XAUUSD formed a bearish rising wedge pattern and tested the 2350 support level. Here are the potential scenarios:
🔼 A rebound from the 2350 support could propel the asset towards the 2380 level;
🔽 Alternatively, breaking below the pattern's lower border may initiate a decline towards 2330.
🏃 What do you think? Are you bullish or bearish on XAUUSD? 👁
➡️ TRADE WITH FBS
@fbsanalytics
@fbsanalytics
Please open Telegram to view this post
VIEW IN TELEGRAM
👍53❤17🔥10⚡5😁5❤🔥4🐳3🍾3🌚2💯2😎2
FBS Analytics
#InstrumentoftheWeek ⚡️ European Indices in the Spotlight: FR40, EU50, ES35! ⚡️ ➡️ Exciting news from FBS! This week, we offer a special deal on three leading European indices: FR40, EU50, and ES35. Enjoy a 35% spread reduction on these dynamic markets.…
#TradeIdea
👉 💡 ▶️ ⏩ EU50 Analysis!
🇪🇺 On the H2, EU50 broke the trend line, and the price reached the support, which was MA200.
🔼 EU50 could be considered for a buy if it breaks above the resistance 5050 with a target of 5120;
🔽 However, if the price bounces off the resistance, it could drop to the 5000 support.
❓ Are you trading indices with lower spreads this week?
➡️ TRADE WITH FBS
@fbsanalytics
@fbsanalytics
Please open Telegram to view this post
VIEW IN TELEGRAM
❤24👍15🔥6👏4❤🔥3💯2🍾2✍1
#Education
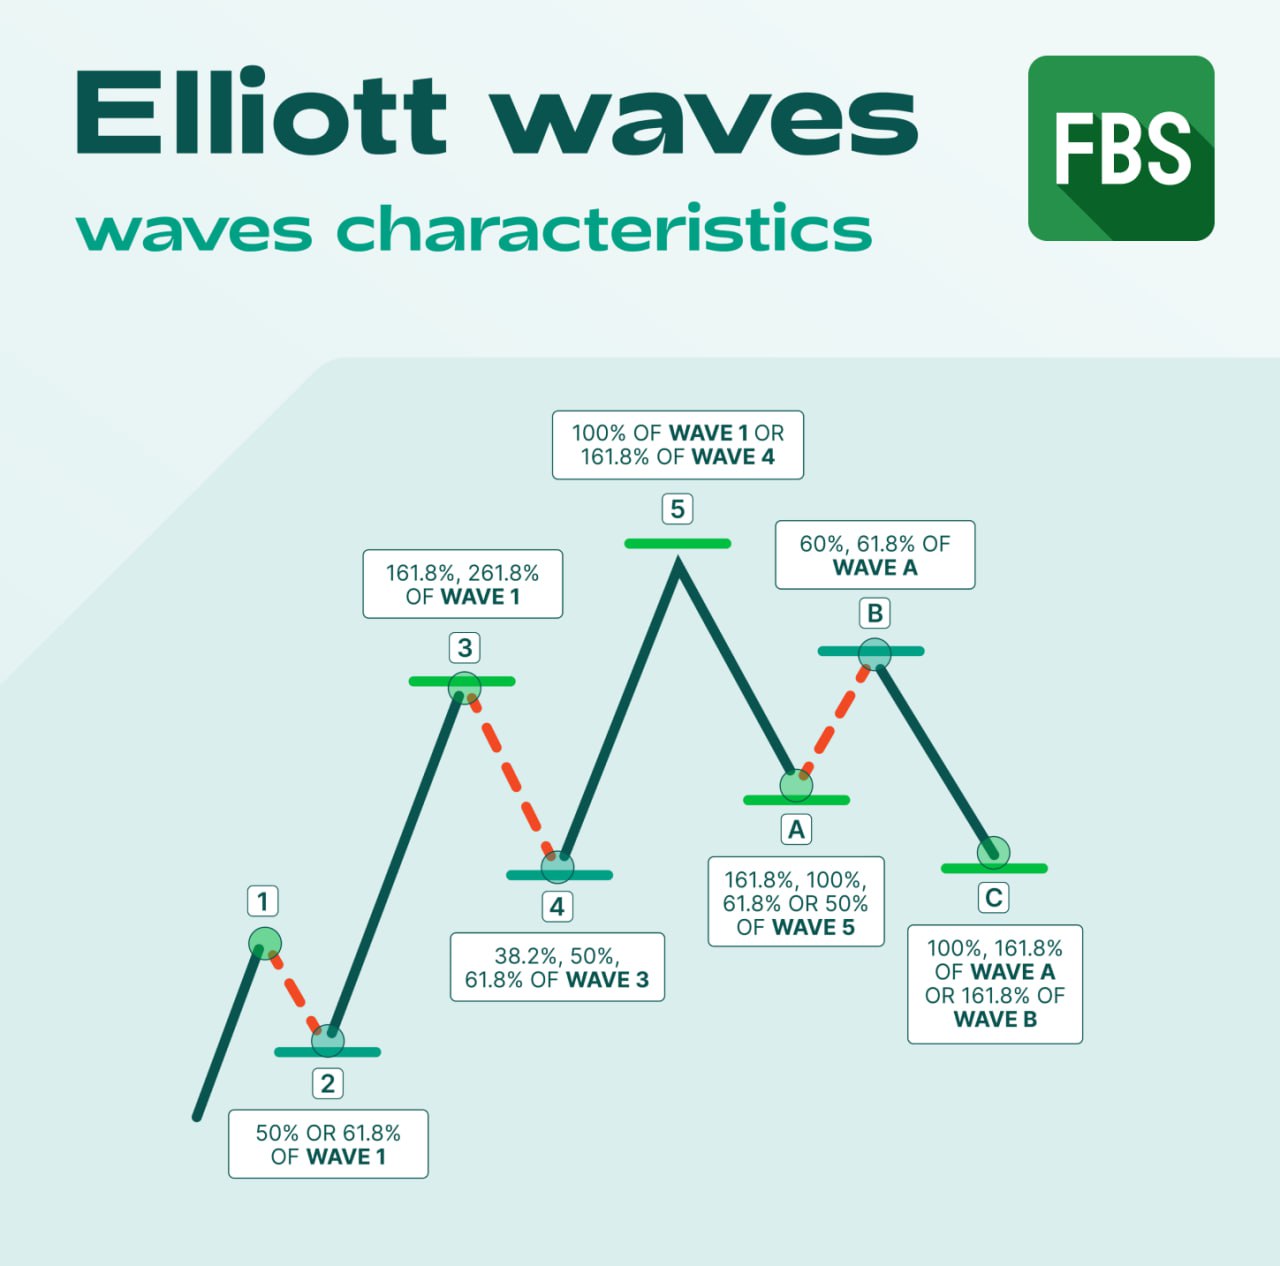
🔥Elliott's Waves Theory🔥
All price movements consist of 5 waves of growth (trend impulse)📈 and three waves of decline (correction) 📉
➡️The structure of any movement has the form 5-3.
The trend impulse (growth wave) has a 5-wave structure, consisting of 3 waves of growth📈 and two waves of decline📉.
✔️in the beginning, there is a solid upward movement (the first growth wave), after which the price decreases (the second wave). The second wave cannot go lower than the beginning of the first wave. Otherwise, it is not an impulse. Usually, the second wave is about 50% of the first wave.
✔️after the end of the second wave, the third wave of growth begins. And it is usually bigger than her. As you understand, it is possible to know that this is the third wave only when the price exceeds the point where the correction (the second wave) began. This is the most optimal time for buying.
✔️then goes the fourth corrective wave. It has the same properties as the second wave, i.e., it cannot go lower than the end of the first wave and is usually 50% of the third wave.
✔️then goes the fifth wave. This is the end of the bullish trend. The fifth wave usually goes beyond the end of the first wave.
❤61👍37🔥15❤🔥6✍4🐳3🆒3⚡2👀2