
#TradeIdea
👉 🥇 🇻🇦 👈 XAUUSD Analysis!
⭐️ On the 30M timeframe, XAUUSD formed a bearish rising wedge pattern and tested the 2350 support level. Here are the potential scenarios:
🔼 A rebound from the 2350 support could propel the asset towards the 2380 level;
🔽 Alternatively, breaking below the pattern's lower border may initiate a decline towards 2330.
🏃 What do you think? Are you bullish or bearish on XAUUSD? 👁
➡️ TRADE WITH FBS
@fbsanalytics
@fbsanalytics
Please open Telegram to view this post
VIEW IN TELEGRAM
👍53❤17🔥10⚡5😁5❤🔥4🐳3🍾3🌚2💯2😎2
FBS Analytics
#InstrumentoftheWeek ⚡️ European Indices in the Spotlight: FR40, EU50, ES35! ⚡️ ➡️ Exciting news from FBS! This week, we offer a special deal on three leading European indices: FR40, EU50, and ES35. Enjoy a 35% spread reduction on these dynamic markets.…
#TradeIdea
👉 💡 ▶️ ⏩ EU50 Analysis!
🇪🇺 On the H2, EU50 broke the trend line, and the price reached the support, which was MA200.
🔼 EU50 could be considered for a buy if it breaks above the resistance 5050 with a target of 5120;
🔽 However, if the price bounces off the resistance, it could drop to the 5000 support.
❓ Are you trading indices with lower spreads this week?
➡️ TRADE WITH FBS
@fbsanalytics
@fbsanalytics
Please open Telegram to view this post
VIEW IN TELEGRAM
❤24👍15🔥6👏4❤🔥3💯2🍾2✍1
#Education
🔥Elliott's Waves Theory🔥
All price movements consist of 5 waves of growth (trend impulse)📈 and three waves of decline (correction) 📉
➡️The structure of any movement has the form 5-3.
The trend impulse (growth wave) has a 5-wave structure, consisting of 3 waves of growth📈 and two waves of decline📉.
✔️in the beginning, there is a solid upward movement (the first growth wave), after which the price decreases (the second wave). The second wave cannot go lower than the beginning of the first wave. Otherwise, it is not an impulse. Usually, the second wave is about 50% of the first wave.
✔️after the end of the second wave, the third wave of growth begins. And it is usually bigger than her. As you understand, it is possible to know that this is the third wave only when the price exceeds the point where the correction (the second wave) began. This is the most optimal time for buying.
✔️then goes the fourth corrective wave. It has the same properties as the second wave, i.e., it cannot go lower than the end of the first wave and is usually 50% of the third wave.
✔️then goes the fifth wave. This is the end of the bullish trend. The fifth wave usually goes beyond the end of the first wave.
🔥Elliott's Waves Theory🔥
All price movements consist of 5 waves of growth (trend impulse)📈 and three waves of decline (correction) 📉
➡️The structure of any movement has the form 5-3.
The trend impulse (growth wave) has a 5-wave structure, consisting of 3 waves of growth📈 and two waves of decline📉.
✔️in the beginning, there is a solid upward movement (the first growth wave), after which the price decreases (the second wave). The second wave cannot go lower than the beginning of the first wave. Otherwise, it is not an impulse. Usually, the second wave is about 50% of the first wave.
✔️after the end of the second wave, the third wave of growth begins. And it is usually bigger than her. As you understand, it is possible to know that this is the third wave only when the price exceeds the point where the correction (the second wave) began. This is the most optimal time for buying.
✔️then goes the fourth corrective wave. It has the same properties as the second wave, i.e., it cannot go lower than the end of the first wave and is usually 50% of the third wave.
✔️then goes the fifth wave. This is the end of the bullish trend. The fifth wave usually goes beyond the end of the first wave.

❤61👍37🔥15❤🔥6✍4🐳3🆒3⚡2👀2
#MarketNews
👋 Hello, dear traders! Today is Wednesday, April 10, 2024. It is time to explore what is happening in today's financial world:
🇪🇺 The ECB's anticipated faster rate cuts compared to the Fed reignites speculation that the euro will fall to dollar parity, which Bank of America and LBBW highlighted as a risk.
⚡️ March inflation data may need to clarify Federal Reserve rate-cut timing, with expected moderation in CPI gains, focusing on rents, used cars, and airfares.
📈 WSJ: The rally in commodity prices reflects an improving economic situation and creates inflationary risks.
🇮🇳 India's stock market capitalization is expected to grow from $4.6 trillion to $40 trillion over the next 20 years amid increasing investor confidence and the country's sustainable economic growth.
🇳🇿 The Reserve Bank of New Zealand has kept the rate at 5.5%, which many economists expected.
🛢 Morgan Stanley raised its oil price forecast for Q3 2024 to $94 due to OPEC constraints, reduced production in Russia, and seasonal demand increases.
🛫 Boeing's crisis deepens with allegations of production shortcuts on the 787 Dreamliner, raising safety concerns and leading to increased scrutiny ahead of a Senate hearing. Boeing (#BA) stock is down 1.89% today.
📈 Alibaba shares surged following Jack Ma's endorsement of its leadership and restructuring efforts, reaching a near one-month high. Alibaba (#ALIBABA) shares are up 1.79%.
That's it for today, guys! Click on❤️ if you liked our review, and see you soon!
➡️ TRADE WITH FBS
@fbsanalytics
🛢 Morgan Stanley raised its oil price forecast for Q3 2024 to $94 due to OPEC constraints, reduced production in Russia, and seasonal demand increases.
That's it for today, guys! Click on
@fbsanalytics
Please open Telegram to view this post
VIEW IN TELEGRAM
❤53👍31❤🔥6⚡3👀3🐳2💯2✍1🔥1
#TradeIdea
👉 🇻🇦 🇨🇭 👈 USDCHF Update!
👀 On the H2, USDCHF is in an uptrend, but the price corrected after and fell to the trend line, creating two scenarios. Indicators also give mixed signals ahead of the US inflation data.
🔼 If the price breaks above 0.9040 and holds, it will recover to 0.9100;
🔽 Otherwise, a trendline breakout will start USDCHF's decline to 0.8970.
⚡️ Are you on the bullish or bearish side? Share your opinion in the comments👇
➡️ TRADE WITH FBS
@fbsanalytics
@fbsanalytics
Please open Telegram to view this post
VIEW IN TELEGRAM
👍35❤14🔥8❤🔥4👀3💯2🍾2⚡1
#TradeIdea
👉 🥇 🇻🇦 🌠 👈 XAUUSD Alert!
☄️ On the 1H timeframe, XAUUSD formed a bearish rising wedge pattern, breached below its lower border, and faced a 2345 support level.
🔽 Trade: Sell XAUUSD when it breaks and consolidates below 2345;
🎯 TP: 2328, 2305.
Smash❤️ if you trade XAUUSD today!
➡️ TRADE WITH FBS
@fbsanalytics
🎯 TP: 2328, 2305.
Smash
@fbsanalytics
Please open Telegram to view this post
VIEW IN TELEGRAM
❤70👍40⚡6💯5😎5✍4❤🔥4👎4🔥4💩4👏3
#LiveStream
➡️ Don't miss out! Tune in to our Live US CPI Stream today at 15:00 GMT+3! 📢
🎞 Get ready to dive into the market with our expert financial analyst, Adetola Freeman, who trades live and shares valuable trade ideas and market insights.
🔔 Set a reminder now and join us for an exclusive real-time analysis and strategies session! 🔥
Click here to set your reminder: https://www.youtube.com/watch?v=q2rGbk997ZM
Click here to set your reminder: https://www.youtube.com/watch?v=q2rGbk997ZM
Please open Telegram to view this post
VIEW IN TELEGRAM
YouTube
Live US CPI Stream Featuring an All-New FBS App
FBS New App: https://fbspa.onelink.me/00Zt
Be the first to know about the upgraded FBS app. How about trading with half spreads? Or completing challenges and winning fantastic branded goods? Join an FBS expert to learn all the unique app features and details…
Be the first to know about the upgraded FBS app. How about trading with half spreads? Or completing challenges and winning fantastic branded goods? Join an FBS expert to learn all the unique app features and details…
❤24👍15🔥12🫡5👏1
#TradeIdea
👉 💡 ▶️ ⏩ NZDUSD Outlook!
🔔 In the H1 Timeframe, NZDUSD has formed a rising wedge pattern, but the indicators are giving multidirectional signals. The moving averages are bullish, while Williams' %R signals are overbought.
🔼 If NZDUSD breaks above the 0.6080 resistance, it could surge to 0.6110;
🔽 However, if the trendline is broken and falls below 0.6070, a bearish scenario will begin with a target of 0.6030.
❓ Are you bullish or bearish on NZDUSD? Share your thoughts in the comments👇
➡️ TRADE WITH FBS
@fbsanalytics
@fbsanalytics
Please open Telegram to view this post
VIEW IN TELEGRAM
👍38❤16🔥7✍3👏3🏆3⚡1😁1🆒1
FBS Analytics
#LiveStream ➡️ Don't miss out! Tune in to our Live US CPI Stream today at 15:00 GMT+3! 📢 🎞 Get ready to dive into the market with our expert financial analyst, Adetola Freeman, who trades live and shares valuable trade ideas and market insights. 🔔 Set a…
Please open Telegram to view this post
VIEW IN TELEGRAM
YouTube
Live US CPI Stream Featuring an All-New FBS App
FBS New App: https://fbspa.onelink.me/00Zt
Be the first to know about the upgraded FBS app. How about trading with half spreads? Or completing challenges and winning fantastic branded goods? Join an FBS expert to learn all the unique app features and details…
Be the first to know about the upgraded FBS app. How about trading with half spreads? Or completing challenges and winning fantastic branded goods? Join an FBS expert to learn all the unique app features and details…
👍31❤16🔥10👀4❤🔥3😁3👏1🍾1
Actual — 0.4%
Expected — 0.3%
Previous — 0.4%
Actual — 0.4%
Expected — 0.3%
Previous — 0.4%
Actual — 3.5%
Expected — 3.4%
Previous — 3.2%
Please open Telegram to view this post
VIEW IN TELEGRAM
🔥46👍20❤10🆒7❤🔥6👎5🍾2✍1👏1💯1
#TradeIdea
👉 💵 🇻🇦 👈 XBRUSD Outlook!
👁🗨 XBRUSD is currently testing the 38.2 Fibonacci ratio aligned with the 89.00 support level. Breaking out of this range could lead in two directions:
🔼 A rebound from the support and breaching above the trendline target 90.80;
🔽 Conversely, a decline below the 38.2 Fibonacci and 89.00 support could send it down to 87.00
🐈 Which side are you on—bullish or bearish?
➡️ TRADE WITH FBS
@fbsanalytics
@fbsanalytics
Please open Telegram to view this post
VIEW IN TELEGRAM
👍30❤14🔥10✍3🐳2🌚2❤🔥1💯1
📊 What is the effect when the price of an asset grows faster than the market due to investors' high expectations?
Anonymous Quiz
18%
Dot-com effect 💻
41%
Bubble effect 🎈
19%
Silicon Valley effect 🌉
22%
Saturation effect 🛑
👍45❤17👏7🔥6🌭5❤🔥4👀4⚡2✍1
#MarketNews
☀️ Happy Thursday, dear traders! Let's check the news moving the financial markets today. Many reports are also to be published today!
🔈 Following a robust US inflation report, markets are increasingly less inclined towards a Federal Reserve rate cut in June. As a result, the UsDollar has surged to 105.235.
🇨🇳 Following Citi's lead, Goldman has raised its GDP growth forecast for China in 2024 to 5.0% from 4.8%. Consequently, the HK50 index has risen to 17 115.
🇨🇦 Canada's central bank rate remains at 5% (expected and previous: 5%). More data is needed to initiate a rate cut by the central bank. Consequently, the USDCAD pair has risen to 1.3690, driven by the strengthening of the US dollar.
🗺 According to the World Trade Organization (WTO), world merchandise trade is projected to grow by 2.6% in 2024 and 3.3% in 2025.
🤖 OpenAI and Meta are developing new AI models capable of "reasoning." Additionally, Meta has unveiled its latest AI chip. Consequently, #META shares are trading at 520.
🎯 FOMC: Most agree to start easing policy this year, slow balance sheet reduction. Uncertainty remains on reaching the 2% inflation target.
✂️ According to analysts surveyed by Reuters, the likelihood of an ECB rate cut in June appears more certain, while the future remains uncertain. Consequently, the EU50 index dropped to 5009.
🇯🇵 According to Finance Minister Suzuki, Japan's Ministry of Finance is not ruling out taking measures in response to the record decline in the yen's value. Consequently, the JP225 trades at 39418.
That's it for today, guys! Click on❤️ if you liked our review, and see you soon!
➡️ TRADE WITH FBS
@fbsanalytics
That's it for today, guys! Click on
@fbsanalytics
Please open Telegram to view this post
VIEW IN TELEGRAM
❤53👍43🔥6❤🔥4⚡3🤔3👏2💩2🆒1
#TradeIdea
👉 🥇 🇻🇦 👈 XAUUSD Analysis!
⭐️ On the 30M timeframe, XAUUSD aims for the 2328 support level, which coincides with the 38.2 Fibonacci ratio. The 200-MA provides an additional layer of support for the asset.
🔼 A rebound from the 2328 support could propel the asset towards the 2347 level;
🔽 Alternatively, breaking below the 38.2 Fibonacci ratio may initiate a decline towards 2305.
🐼 What's your take? Bullish or bearish on XAUUSD? 👁
➡️ TRADE WITH FBS
@fbsanalytics
@fbsanalytics
Please open Telegram to view this post
VIEW IN TELEGRAM
👍69❤19💯8❤🔥7🔥3🤝3👏1👌1🍾1🆒1
#TradeIdea
👉 🇪🇺 🇻🇦 👈 EURUSD Update!
📈 On the H4, EURUSD fell sharply after the release of the US Consumer Price Index, so two scenarios are possible. MA200 shows a bearish signal, while RSI shows a firm oversold signal.
🔽 A fall below the support at 1.0730 will bring the price down to 1.0670;
🔼 A rebound from the support will bring EURUSD back to 1.0800.
❓ What do you think the EURUSD is bullish or bearish today? Share your opinion in the comments👇
➡️ TRADE WITH FBS
@fbsanalytics
@fbsanalytics
Please open Telegram to view this post
VIEW IN TELEGRAM
👍61❤21⚡5🔥5🍾4✍3💯3🌚2❤🔥1
#TradeIdea
👉 🇦🇺 🇻🇦 🚀 👈 AUDUSD may rise shortly!
📊 The AUDUSD pair just rebounded from the crucial 0.6510 support. The RSI oscillator indicates a hidden bullish divergence, which suggests bullish momentum.
🔼 Trade: Buy AUDUSD;
🎯 TP: 0.6590.
❓ Are you on the bullish side? 🤔
➡️ TRADE WITH FBS
@fbsanalytics
@fbsanalytics
Please open Telegram to view this post
VIEW IN TELEGRAM
👍57🔥14❤11💯3⚡2🍾2✍1❤🔥1🤝1
#TradeIdea
👉 🥇 🇻🇦 🚀 👈 XAUUSD Is Ready to Rise!
⚡️ XAUUSD after bouncing off resistance and a small correction is gradually rising and preparing to test the trend line.Moreover, MA200 is signaling bullish sentiment.
🔼 Trade: Buy XAUUSD on a breakout of 2348 and the trendline
🎯 TP1: 2365
🏹 TP2: 2392
Smash👍 if you are bullish on XAUUSD!
➡️ TRADE WITH FBS
@fbsanalytics
Smash
@fbsanalytics
Please open Telegram to view this post
VIEW IN TELEGRAM
👍146❤33🔥15❤🔥6🌭6🍾6⚡4🆒4🎉3🏆3👏1
#education
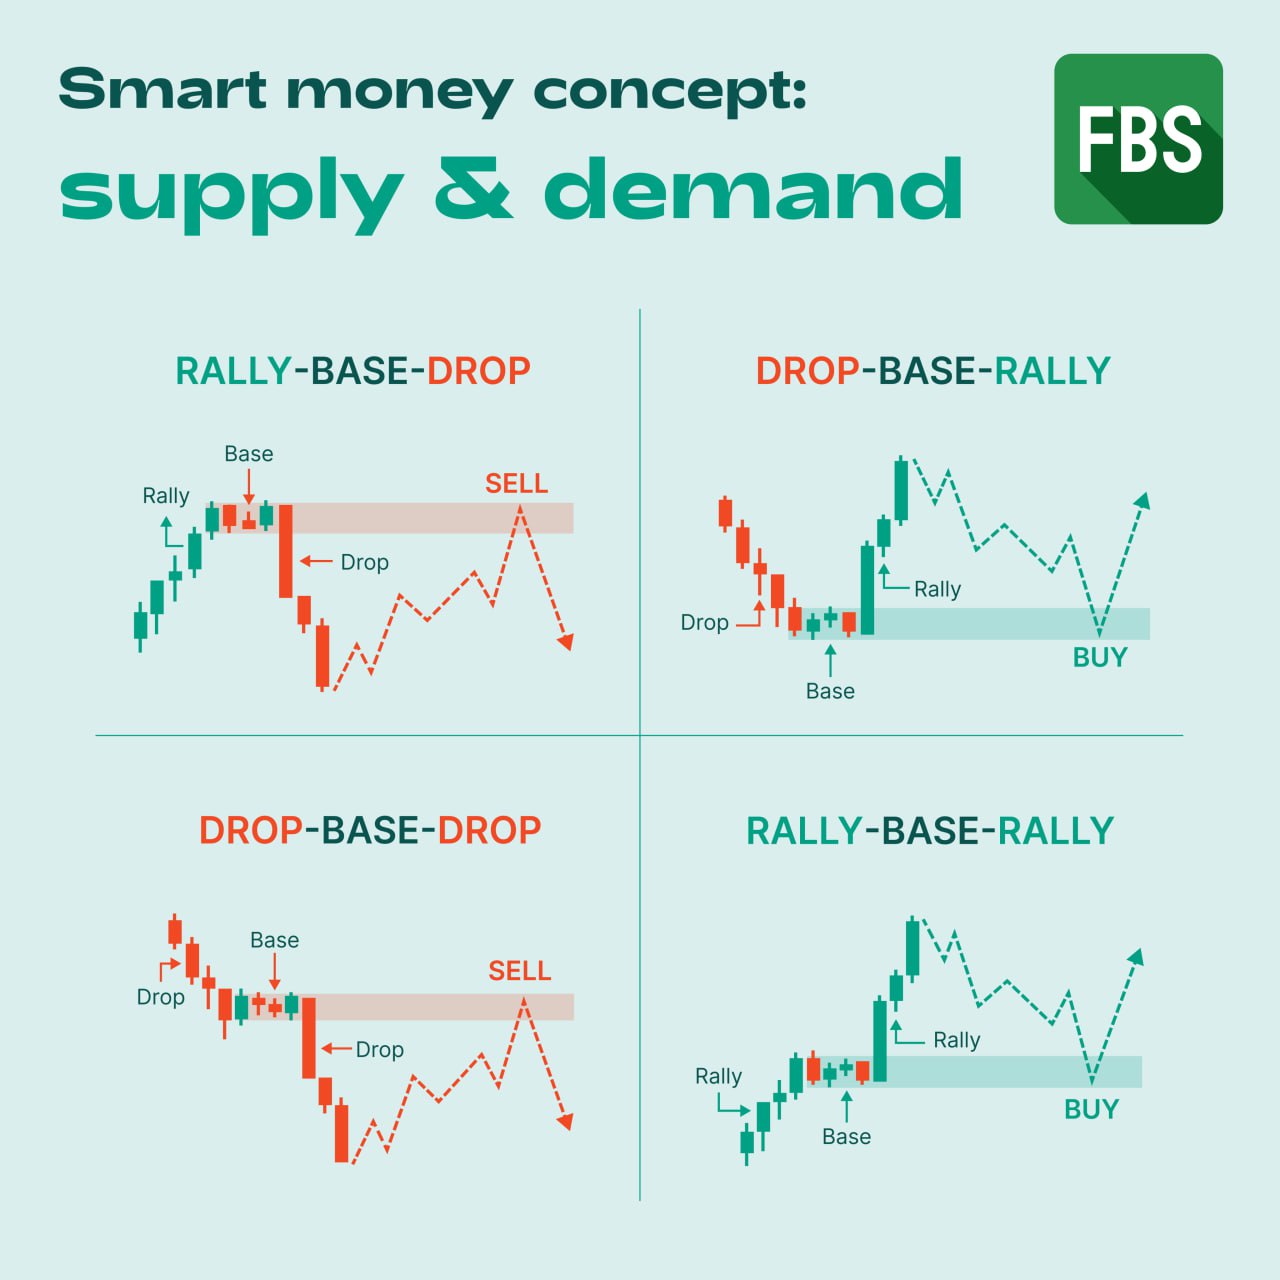
🧠 Follow the Footprints of Smart Money
📈 Sharp price shifts reveal big players entering the market.
🐳 These market whales make substantial purchases, creating an "order block." The subsequent sharp movement is known as an "imbalance" or "Fair value gap."
📉 Afterward, these whales capitalize on their trades, leading to a gradual price reversion towards the order block (OB). Thus, optimal Buy entry points often occur during OB retests.
📍 Pro tip: Go beyond models and indicators. Try to understand the forces that shape candle movement. Identifying these important zones will help strengthen your trading strategy.
🧠 Follow the Footprints of Smart Money
📈 Sharp price shifts reveal big players entering the market.
🐳 These market whales make substantial purchases, creating an "order block." The subsequent sharp movement is known as an "imbalance" or "Fair value gap."
📉 Afterward, these whales capitalize on their trades, leading to a gradual price reversion towards the order block (OB). Thus, optimal Buy entry points often occur during OB retests.
📍 Pro tip: Go beyond models and indicators. Try to understand the forces that shape candle movement. Identifying these important zones will help strengthen your trading strategy.
❤75👍45🔥13✍8⚡6💯5❤🔥4👎4🐳4🆒4👏3