
#MarketNews #SP500
THE S&P 500 IS PREPARING TO HIT A NEW LOW SINCE THE BEGINNING OF FEBRUARY
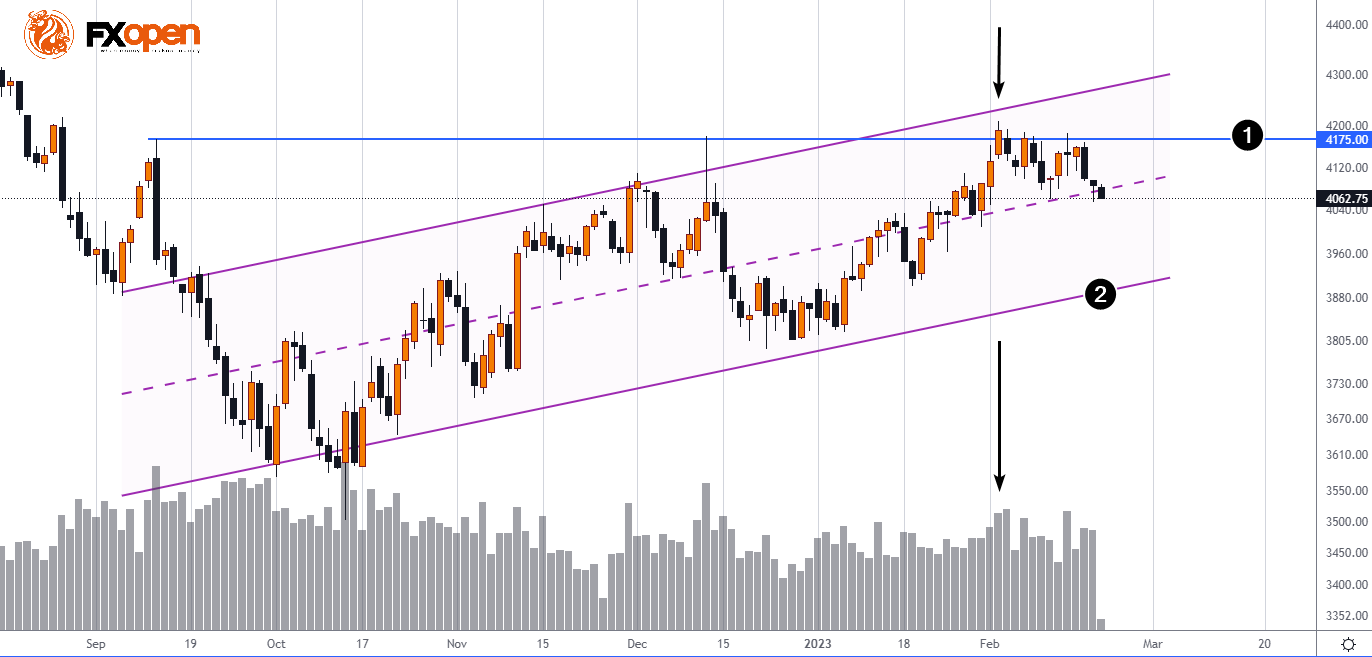
The futures chart shows that the up wave (framed by the purple channel) that began in the fall of 2022 seems to be losing its strength, hitting the resistance (1) at 4175.
We pointed to high volumes on February 2-3 (evidence of the activity of the big players) when the first bearish reversal occurred. Several more bullish attempts followed this month, but they all failed.
According to Bloomberg, analysts at Morgan Stanley see the likelihood that the index will drop to 3,000 in the first half of the year - which is about -25%. In their opinion, the risk premium in the options market is too low.
This week there will be a meeting of the Fed, the news from which can push the stock down, breaking through the February support around 4050. Then the downward momentum may develop, lowering the index to the lower border of the rising channel (2).
To take advantage of price movements in the stock market, consider enlisting the services of a reliable broker like FXOpen.
⚠️
CFDs are complex instruments and come with a high risk of losing your money.
This forecast represents FXOpen Companies opinion only, it should not be construed as an offer, invitation or recommendation in respect to FXOpen Companies products and services or as financial advice.
THE S&P 500 IS PREPARING TO HIT A NEW LOW SINCE THE BEGINNING OF FEBRUARY
The futures chart shows that the up wave (framed by the purple channel) that began in the fall of 2022 seems to be losing its strength, hitting the resistance (1) at 4175.
We pointed to high volumes on February 2-3 (evidence of the activity of the big players) when the first bearish reversal occurred. Several more bullish attempts followed this month, but they all failed.
According to Bloomberg, analysts at Morgan Stanley see the likelihood that the index will drop to 3,000 in the first half of the year - which is about -25%. In their opinion, the risk premium in the options market is too low.
This week there will be a meeting of the Fed, the news from which can push the stock down, breaking through the February support around 4050. Then the downward momentum may develop, lowering the index to the lower border of the rising channel (2).
To take advantage of price movements in the stock market, consider enlisting the services of a reliable broker like FXOpen.
⚠️
CFDs are complex instruments and come with a high risk of losing your money.
This forecast represents FXOpen Companies opinion only, it should not be construed as an offer, invitation or recommendation in respect to FXOpen Companies products and services or as financial advice.
👍1
Three Working 5-Minute Trading Strategies
Scalping is a popular approach in Forex trading, as many traders don’t want to wait for potential rewards. It involves numerous short-term trades on low timeframes, including 1, 5, and 15-minute charts. However, scalping is challenging. It requires significant funds, lots of experience, and a well-developed plan that will allow traders to reach a considerable success rate. Below you will find three effective scalping strategies for a 5-minute chart.
https://fxopen.com/blog/en/three-working-5-minute-trading-strategies/
Scalping is a popular approach in Forex trading, as many traders don’t want to wait for potential rewards. It involves numerous short-term trades on low timeframes, including 1, 5, and 15-minute charts. However, scalping is challenging. It requires significant funds, lots of experience, and a well-developed plan that will allow traders to reach a considerable success rate. Below you will find three effective scalping strategies for a 5-minute chart.
https://fxopen.com/blog/en/three-working-5-minute-trading-strategies/
Market Pulse
3 Working 5-Minute Trading Strategies | FXOpen
Discover the 5-minute Forex trading strategy for currency pairs and determine the best moving average for the 5-minute chart.
#MarketNews
IMPORTANT NEWS ON CAD AND NZD
The Reserve Bank of New Zealand (RBNZ) raised interest rates by 50 basis points to 4.75% this morning. This is more than a 14-year high, and the bank is poised for further tightening as inflation remains too high (7.2%).
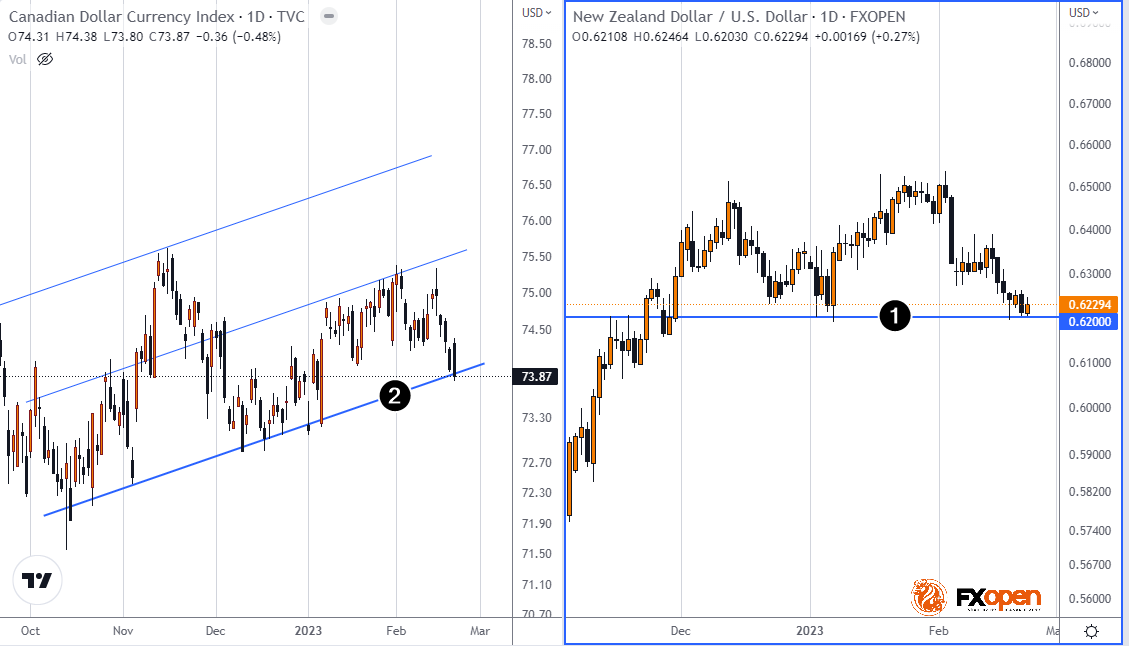
In reaction to the news, the NZDCAD rose, but only marginally as the RBNZ's tough policy came as no surprise. The chart shows that the rate is near the key level (1) of support 0.62, which previously had an impact on its dynamics.
And on the other side of the planet, in Canada, traders are discussing inflation. Data released yesterday showed that annual inflation fell to 5.9% in January, more than expected. This should allow the Bank of Canada to keep interest rates at its next meeting. As a result, the Canadian dollar index fell to an important trend line (2), threatening it with a bearish breakdown.
Will NZDCAD bounce off the 0.62 level and bearish breakout on the CXY chart? This will largely depend on news from the US: tomorrow the publication of news on GDP is expected, and tonight market participants will learn the minutes of the Fed meeting. The G20 meeting also starts today, so be prepared for bursts of volatility in the next 2 sessions.
To take advantage of trends in the currency markets, consider enlisting the services of a reliable broker like FXOpen.
⚠️
CFDs are complex instruments and come with a high risk of losing your money.
This forecast represents FXOpen Companies opinion only, it should not be construed as an offer, invitation or recommendation in respect to FXOpen Companies products and services or as financial advice.
IMPORTANT NEWS ON CAD AND NZD
The Reserve Bank of New Zealand (RBNZ) raised interest rates by 50 basis points to 4.75% this morning. This is more than a 14-year high, and the bank is poised for further tightening as inflation remains too high (7.2%).
In reaction to the news, the NZDCAD rose, but only marginally as the RBNZ's tough policy came as no surprise. The chart shows that the rate is near the key level (1) of support 0.62, which previously had an impact on its dynamics.
And on the other side of the planet, in Canada, traders are discussing inflation. Data released yesterday showed that annual inflation fell to 5.9% in January, more than expected. This should allow the Bank of Canada to keep interest rates at its next meeting. As a result, the Canadian dollar index fell to an important trend line (2), threatening it with a bearish breakdown.
Will NZDCAD bounce off the 0.62 level and bearish breakout on the CXY chart? This will largely depend on news from the US: tomorrow the publication of news on GDP is expected, and tonight market participants will learn the minutes of the Fed meeting. The G20 meeting also starts today, so be prepared for bursts of volatility in the next 2 sessions.
To take advantage of trends in the currency markets, consider enlisting the services of a reliable broker like FXOpen.
⚠️
CFDs are complex instruments and come with a high risk of losing your money.
This forecast represents FXOpen Companies opinion only, it should not be construed as an offer, invitation or recommendation in respect to FXOpen Companies products and services or as financial advice.
#MarketNews
MINUTES OF THE FED MEETING SHOW DETERMINATION TO FURTHER INCREASE THE RATE
Yesterday it became known that the meeting participants decided to increase the rate by 0.25%. According to US Federal Reserve spokesman James Bullard, raising the rate will give more chances to reduce inflation.
Note that stock markets ended yesterday near zero, not succumbing to bearish pressure on the back of news from the Fed, which in general did not cause increased volatility in financial markets, as a 0.25% rate hike was the most expected option.
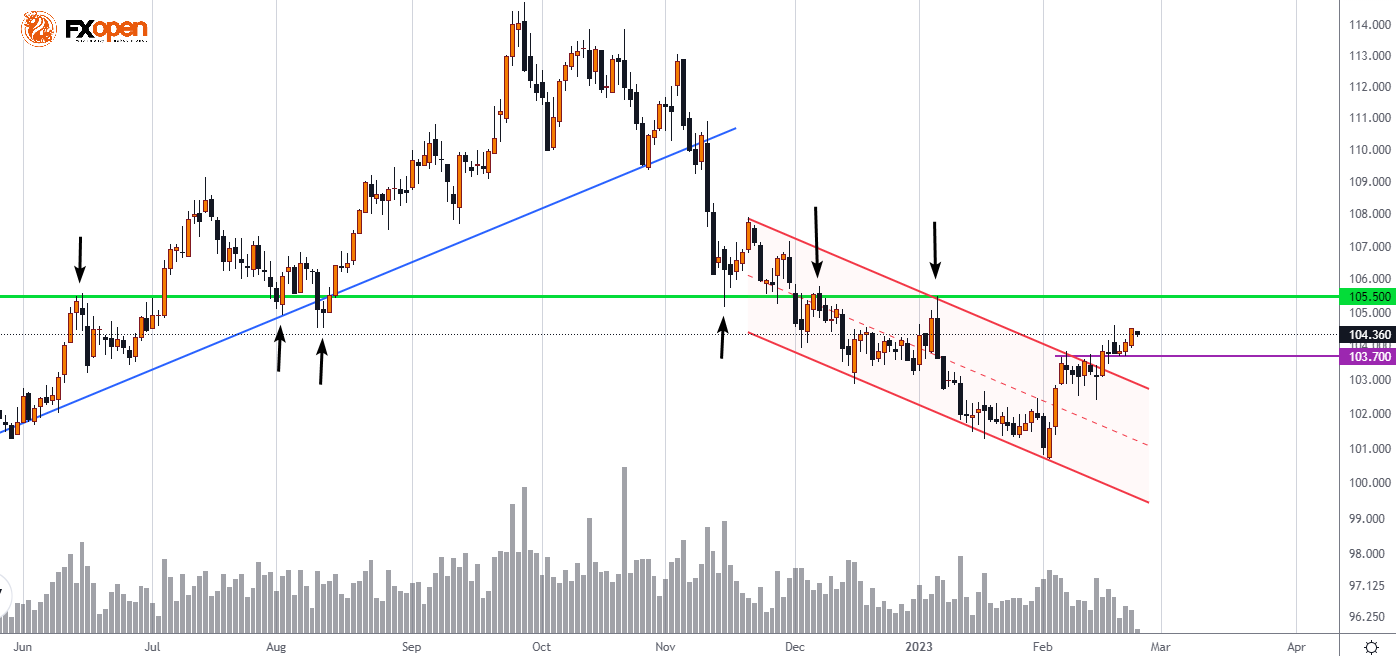
The change is most noticeable on the dollar index chart. The price of the futures rose, having risen to the maximum of February. Thus the price:
→ more and more moves away from the descending channel (shown in red), which was relevant for about 3 months,
→ makes the scenario of growth towards the key level 105.5 more and more likely (there have been repeated trend reversals near it, as the arrows show). This requires fixing above the level of 103.7 - it is the nearest support on the daily chart.
Today, the news on the US GDP will be released (it is expected that the economic growth rate will remain at the level of 2.9% per year), which can become a driver for a test of the strength of support at 103.7 on the dollar index chart.
To take advantage of trends in the financial markets, consider enlisting the services of a reliable broker like FXOpen.
⚠️
CFDs are complex instruments and come with a high risk of losing your money.
This forecast represents FXOpen Companies opinion only, it should not be construed as an offer, invitation or recommendation in respect to FXOpen Companies products and services or as financial advice.
MINUTES OF THE FED MEETING SHOW DETERMINATION TO FURTHER INCREASE THE RATE
Yesterday it became known that the meeting participants decided to increase the rate by 0.25%. According to US Federal Reserve spokesman James Bullard, raising the rate will give more chances to reduce inflation.
Note that stock markets ended yesterday near zero, not succumbing to bearish pressure on the back of news from the Fed, which in general did not cause increased volatility in financial markets, as a 0.25% rate hike was the most expected option.
The change is most noticeable on the dollar index chart. The price of the futures rose, having risen to the maximum of February. Thus the price:
→ more and more moves away from the descending channel (shown in red), which was relevant for about 3 months,
→ makes the scenario of growth towards the key level 105.5 more and more likely (there have been repeated trend reversals near it, as the arrows show). This requires fixing above the level of 103.7 - it is the nearest support on the daily chart.
Today, the news on the US GDP will be released (it is expected that the economic growth rate will remain at the level of 2.9% per year), which can become a driver for a test of the strength of support at 103.7 on the dollar index chart.
To take advantage of trends in the financial markets, consider enlisting the services of a reliable broker like FXOpen.
⚠️
CFDs are complex instruments and come with a high risk of losing your money.
This forecast represents FXOpen Companies opinion only, it should not be construed as an offer, invitation or recommendation in respect to FXOpen Companies products and services or as financial advice.
#MarketNews
NVDA HITS 10-MONTH HIGH
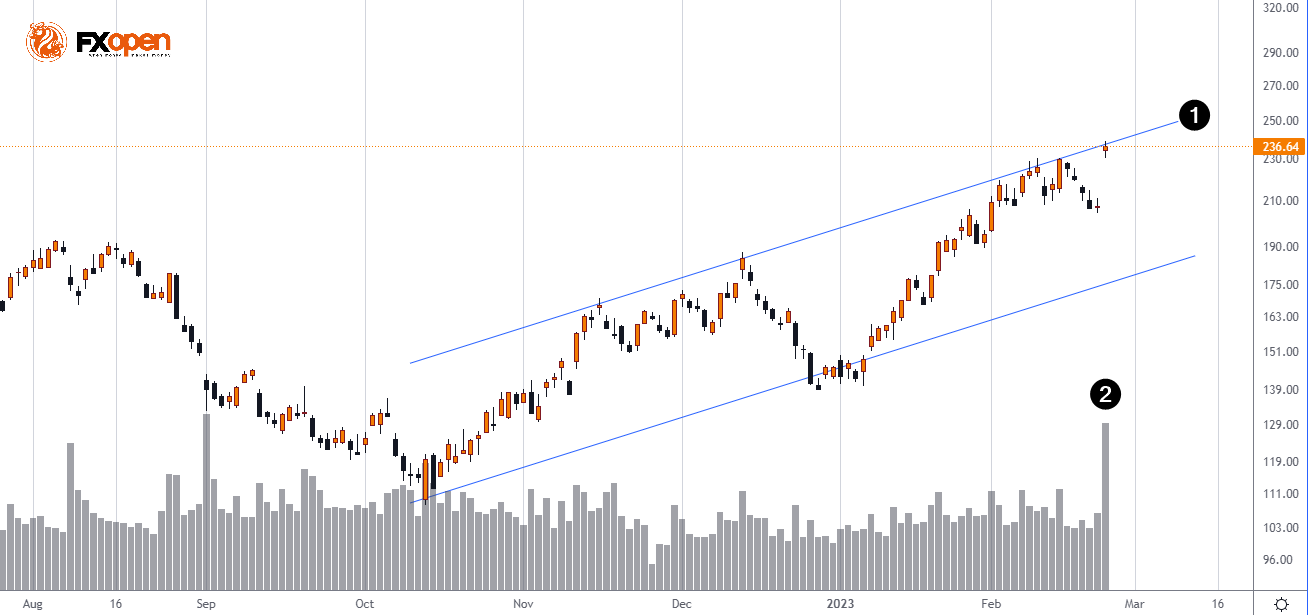
The share price rose 14% to $236, the last time NVDA traded at that price in April 2022.
There are two reasons for the sharp increase:
1→ Strong report. Revenue for the fourth fiscal quarter was $6.05 billion.
2→ Bullish sentiment associated with the artificial intelligence (AI) boom. The company forecasts sales for the next quarter of $6.5 billion.
Goldman Sachs has assigned NVIDIA stock a Buy rating with a target price of $275.
Is it worth buying right now? There are reasons to hold off on this, as the market seems to be in a frenzy, or FOMO, caused by a bullish gap. Besides:
→ The price is near the resistance line (1).
→ The difference between open and close on yesterday's candle is very small and volumes (2) are extremely high. This indicates the presence of a large capital of sellers. They may be taking profits after rallying more than 100% from the October low.
These facts give arguments to count on the formation of a rollback from the top reached yesterday.
To take advantage of trends in the stock markets, consider enlisting the services of a reliable broker like FXOpen.
⚠️
CFDs are complex instruments and come with a high risk of losing your money.
This forecast represents FXOpen Companies opinion only, it should not be construed as an offer, invitation or recommendation in respect to FXOpen Companies products and services or as financial advice.
NVDA HITS 10-MONTH HIGH
The share price rose 14% to $236, the last time NVDA traded at that price in April 2022.
There are two reasons for the sharp increase:
1→ Strong report. Revenue for the fourth fiscal quarter was $6.05 billion.
2→ Bullish sentiment associated with the artificial intelligence (AI) boom. The company forecasts sales for the next quarter of $6.5 billion.
Goldman Sachs has assigned NVIDIA stock a Buy rating with a target price of $275.
Is it worth buying right now? There are reasons to hold off on this, as the market seems to be in a frenzy, or FOMO, caused by a bullish gap. Besides:
→ The price is near the resistance line (1).
→ The difference between open and close on yesterday's candle is very small and volumes (2) are extremely high. This indicates the presence of a large capital of sellers. They may be taking profits after rallying more than 100% from the October low.
These facts give arguments to count on the formation of a rollback from the top reached yesterday.
To take advantage of trends in the stock markets, consider enlisting the services of a reliable broker like FXOpen.
⚠️
CFDs are complex instruments and come with a high risk of losing your money.
This forecast represents FXOpen Companies opinion only, it should not be construed as an offer, invitation or recommendation in respect to FXOpen Companies products and services or as financial advice.
👍1
#MarketNews #Gas
GAS PRICE RECOVERS FROM PSYCHOLOGICAL LOW
February 24 marks one year since Russia's armed invasion of Ukraine. Geopolitics has been an important driver of gas prices this year because Russia is an important supplier to the world.
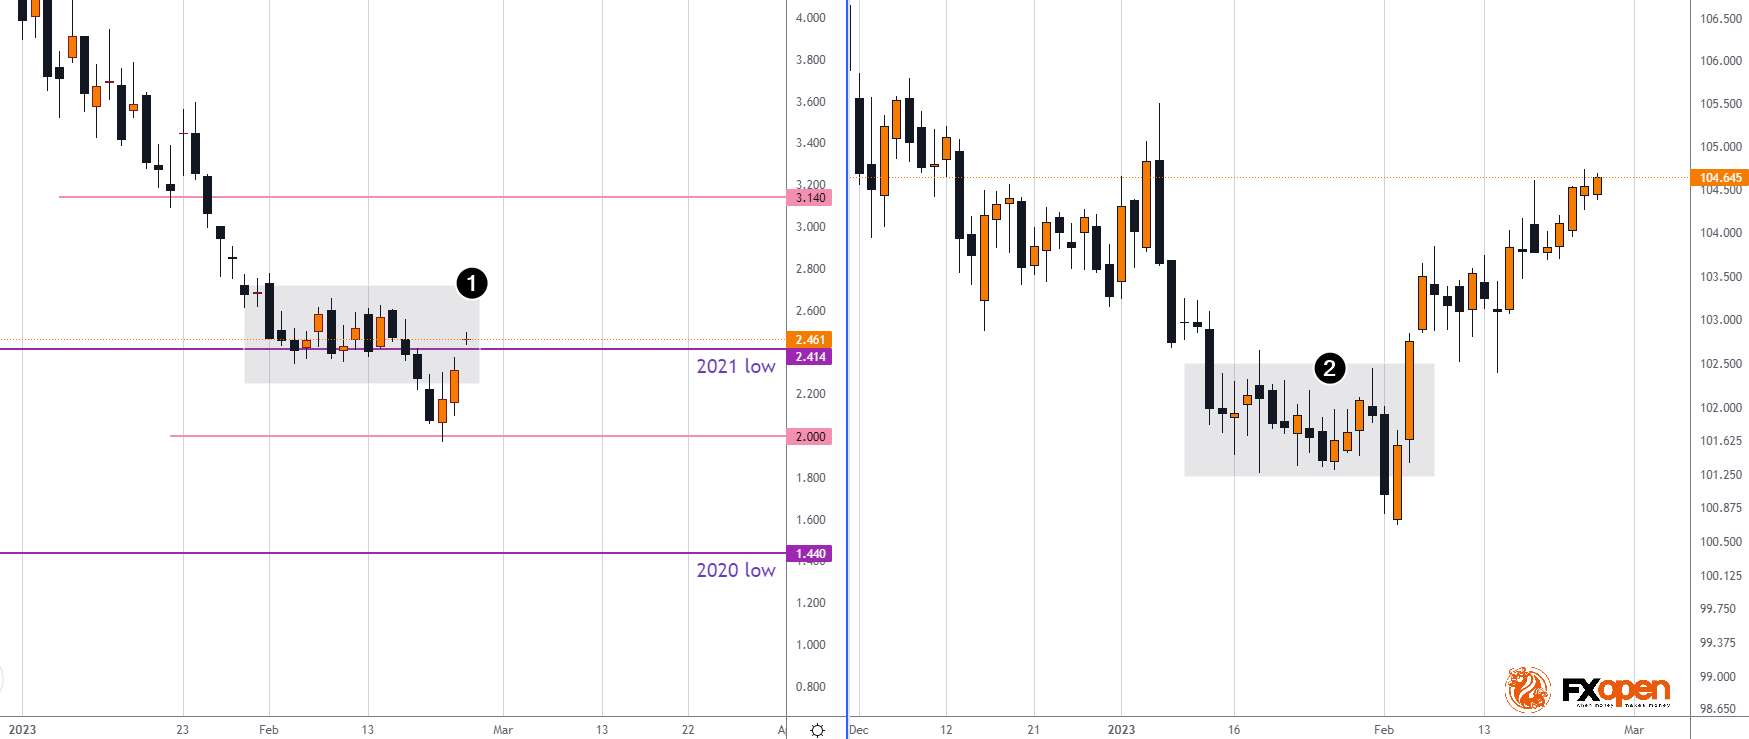
The price of the futures on the New York exchange reached a multi-year high at the end of August 2022 (nearly $10 per contract, although the average price over 10 years = $3.4), when Europe hastily filled gas storage facilities on the eve of winter.
While world leaders have been making statements about the ongoing war, this week the price has fallen below the low of 2021.
Note that the price also formed a false bearish breakdown of the psychological mark of $2 per contract. Also note the quick price recovery from the $2 level. A bullish gap has formed on the chart today, indicating strong demand.
Perhaps market participants consider the current price level attractive for investment. The current dynamics (1) in the natural gas market resembles the emerging pattern (2) of a bullish reversal that has already formed on the dollar futures chart.
Recall that in a post on February 9, we indicated that, according to the forecast of the Energy Information Administration (EIA), the average gas price in 2023 will be more than $4.
To take advantage of trends in the commodity markets, consider enlisting the services of a reliable broker like FXOpen.
⚠️
CFDs are complex instruments and come with a high risk of losing your money.
This forecast represents FXOpen Companies opinion only, it should not be construed as an offer, invitation or recommendation in respect to FXOpen Companies products and services or as financial advice.
GAS PRICE RECOVERS FROM PSYCHOLOGICAL LOW
February 24 marks one year since Russia's armed invasion of Ukraine. Geopolitics has been an important driver of gas prices this year because Russia is an important supplier to the world.
The price of the futures on the New York exchange reached a multi-year high at the end of August 2022 (nearly $10 per contract, although the average price over 10 years = $3.4), when Europe hastily filled gas storage facilities on the eve of winter.
While world leaders have been making statements about the ongoing war, this week the price has fallen below the low of 2021.
Note that the price also formed a false bearish breakdown of the psychological mark of $2 per contract. Also note the quick price recovery from the $2 level. A bullish gap has formed on the chart today, indicating strong demand.
Perhaps market participants consider the current price level attractive for investment. The current dynamics (1) in the natural gas market resembles the emerging pattern (2) of a bullish reversal that has already formed on the dollar futures chart.
Recall that in a post on February 9, we indicated that, according to the forecast of the Energy Information Administration (EIA), the average gas price in 2023 will be more than $4.
To take advantage of trends in the commodity markets, consider enlisting the services of a reliable broker like FXOpen.
⚠️
CFDs are complex instruments and come with a high risk of losing your money.
This forecast represents FXOpen Companies opinion only, it should not be construed as an offer, invitation or recommendation in respect to FXOpen Companies products and services or as financial advice.
#MarketNews
US INDICES POST WORST WEEK OF 2023
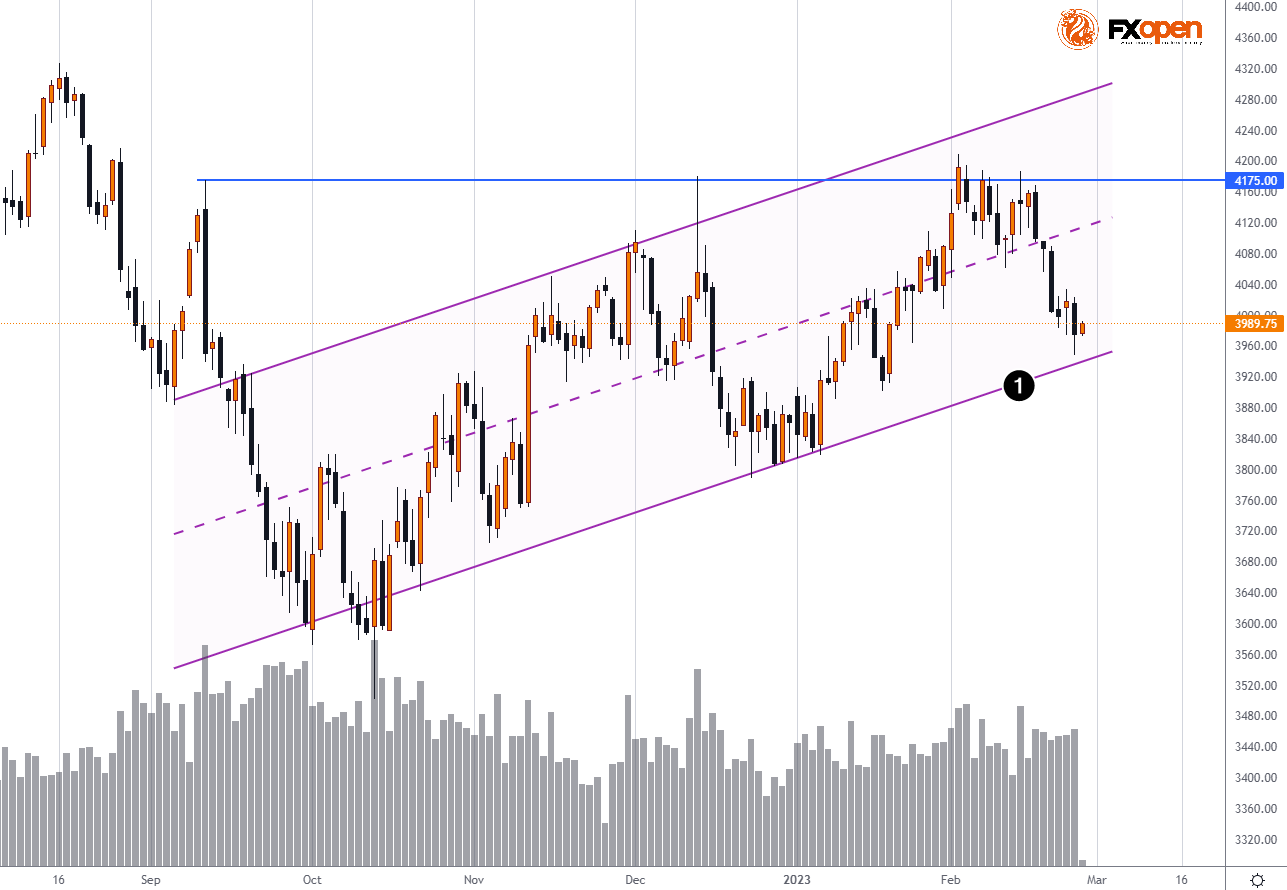
The S&P 500 index fell by 2.7%, which was the worst week since December 9, 2022. One of the reasons was the publication of the PCE (Personal Consumption Expenditures) index, an important inflation indicator that the Fed pays special attention to. PCE rose above expectations, indicating that the fight against inflation is dragging on.
CNBC reports the opinion of Liz Ann Sonders, Charles Schwab's chief strategist, who believes that inflation cannot come down without a wider economic downturn.
Interestingly, according to David Rosenberg (an authoritative Wall Street analyst with 30 years of experience), published in Business Insider, a recession will sweep the US economy within a few months.
As the chart shows, so far the S&P 500 index futures has fallen to the lower line (1) of the ascending channel (as we expected). Perhaps in the coming days it will provide support, but in the event of a bearish breakdown, the scenario associated with a downturn in the economy will become more realistic.
To take advantage of trends in the financial markets, consider enlisting the services of a reliable broker like FXOpen.
⚠️
CFDs are complex instruments and come with a high risk of losing your money.
This forecast represents FXOpen Companies opinion only, it should not be construed as an offer, invitation or recommendation in respect to FXOpen Companies products and services or as financial advice.
US INDICES POST WORST WEEK OF 2023
The S&P 500 index fell by 2.7%, which was the worst week since December 9, 2022. One of the reasons was the publication of the PCE (Personal Consumption Expenditures) index, an important inflation indicator that the Fed pays special attention to. PCE rose above expectations, indicating that the fight against inflation is dragging on.
CNBC reports the opinion of Liz Ann Sonders, Charles Schwab's chief strategist, who believes that inflation cannot come down without a wider economic downturn.
Interestingly, according to David Rosenberg (an authoritative Wall Street analyst with 30 years of experience), published in Business Insider, a recession will sweep the US economy within a few months.
As the chart shows, so far the S&P 500 index futures has fallen to the lower line (1) of the ascending channel (as we expected). Perhaps in the coming days it will provide support, but in the event of a bearish breakdown, the scenario associated with a downturn in the economy will become more realistic.
To take advantage of trends in the financial markets, consider enlisting the services of a reliable broker like FXOpen.
⚠️
CFDs are complex instruments and come with a high risk of losing your money.
This forecast represents FXOpen Companies opinion only, it should not be construed as an offer, invitation or recommendation in respect to FXOpen Companies products and services or as financial advice.
#MarketNews #Cryptocurrency
SEC CONTINUES PUTTING PRESSURE ON THE CRYPTO MARKET
Robinhood, a popular broker in the US, received a notice from the SEC about the opening of a case regarding the listing and storage of cryptocurrencies by customers.
Also, due to pressure from this state regulator, Coinbase will suspend operations with BUSD (a stablecoin from Binance) on March 13.
Yesterday, Forbes published an article that indicates that the actions of the Binance exchange with its funds resemble what FTX did before its collapse. The head of Binance issued a rebuttal, stating that customer funds are 1:1 secured and can be withdrawn without hindrance.
From the news, there is a picture of pressure on the cryptocurrency market in the United States.
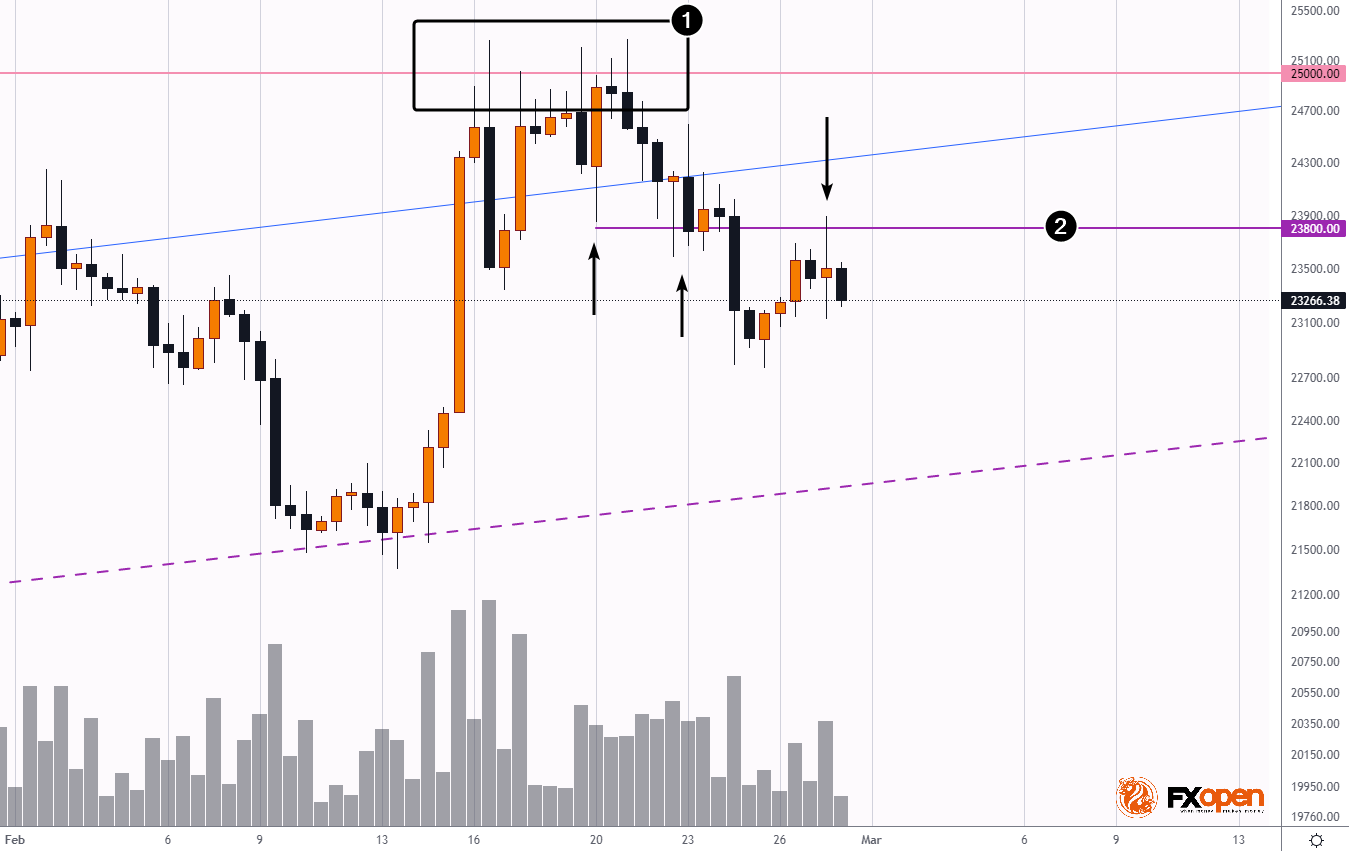
The BTCUSD chart shows signs of bearish activity amid this pessimistic backdrop. Earlier, the sellers defended the psychological level (1) of $25k. And now they are taking control of the (2) $23.8k level, which previously served as support (as shown by the arrows), but appears to be resisting after breaking through on high volume.
If market pessimism continues to build, we may see Bitcoin price drop to February lows around $22k.
To take advantage of trends in the crypto markets, consider enlisting the services of a reliable broker like FXOpen.
⚠️
CFDs are complex instruments and come with a high risk of losing your money.
This forecast represents FXOpen Companies opinion only, it should not be construed as an offer, invitation or recommendation in respect to FXOpen Companies products and services or as financial advice.
Cryptocurrency CFDs are not available to Retail clients in the UK.
SEC CONTINUES PUTTING PRESSURE ON THE CRYPTO MARKET
Robinhood, a popular broker in the US, received a notice from the SEC about the opening of a case regarding the listing and storage of cryptocurrencies by customers.
Also, due to pressure from this state regulator, Coinbase will suspend operations with BUSD (a stablecoin from Binance) on March 13.
Yesterday, Forbes published an article that indicates that the actions of the Binance exchange with its funds resemble what FTX did before its collapse. The head of Binance issued a rebuttal, stating that customer funds are 1:1 secured and can be withdrawn without hindrance.
From the news, there is a picture of pressure on the cryptocurrency market in the United States.
The BTCUSD chart shows signs of bearish activity amid this pessimistic backdrop. Earlier, the sellers defended the psychological level (1) of $25k. And now they are taking control of the (2) $23.8k level, which previously served as support (as shown by the arrows), but appears to be resisting after breaking through on high volume.
If market pessimism continues to build, we may see Bitcoin price drop to February lows around $22k.
To take advantage of trends in the crypto markets, consider enlisting the services of a reliable broker like FXOpen.
⚠️
CFDs are complex instruments and come with a high risk of losing your money.
This forecast represents FXOpen Companies opinion only, it should not be construed as an offer, invitation or recommendation in respect to FXOpen Companies products and services or as financial advice.
Cryptocurrency CFDs are not available to Retail clients in the UK.
Harmonic Patterns: Butterfly Pattern Trading
One of the important skills for Forex trading is the ability to read patterns. There are many harmonic patterns. The most popular ones are bat, crab, shark, the Gartley, and butterfly.
The butterfly pattern is known as one of the most developed and complicated reversal patterns that appear at the end of a trend. If used correctly, it is also known to be reliable and precise. Read more to learn how to use it on FXOpen.
https://fxopen.com/blog/en/harmonic-patterns-butterfly-pattern-trading/
One of the important skills for Forex trading is the ability to read patterns. There are many harmonic patterns. The most popular ones are bat, crab, shark, the Gartley, and butterfly.
The butterfly pattern is known as one of the most developed and complicated reversal patterns that appear at the end of a trend. If used correctly, it is also known to be reliable and precise. Read more to learn how to use it on FXOpen.
https://fxopen.com/blog/en/harmonic-patterns-butterfly-pattern-trading/
Market Pulse
What Is the Butterfly Pattern and How May It Be Used in Trading?
Discover how the butterfly pattern works, what its key Fibonacci ratios are, and how it’s applied in trading with this in-depth overview from FXOpen.
👍1
#MarketNews
FEBRUARY REMOVES THE JANUARY POSITIVE
In January, positive sentiment prevailed on the financial markets due to the following facts:
→ the peak of inflation seemed to be passed;
→ China lifted Covid restrictions.
However, in February, the mood changed due to the fact that new data showed a stable nature of inflation. Recession forecasts are back on the agenda.
As a result:
→ S&P-500: January +4.9%, February -2.7%
→ Gold: January +6.2%, February -5.2%
→ Euro: January +1.6%, February -2.7%
→ Pound: January +2.1%, February -2.2%
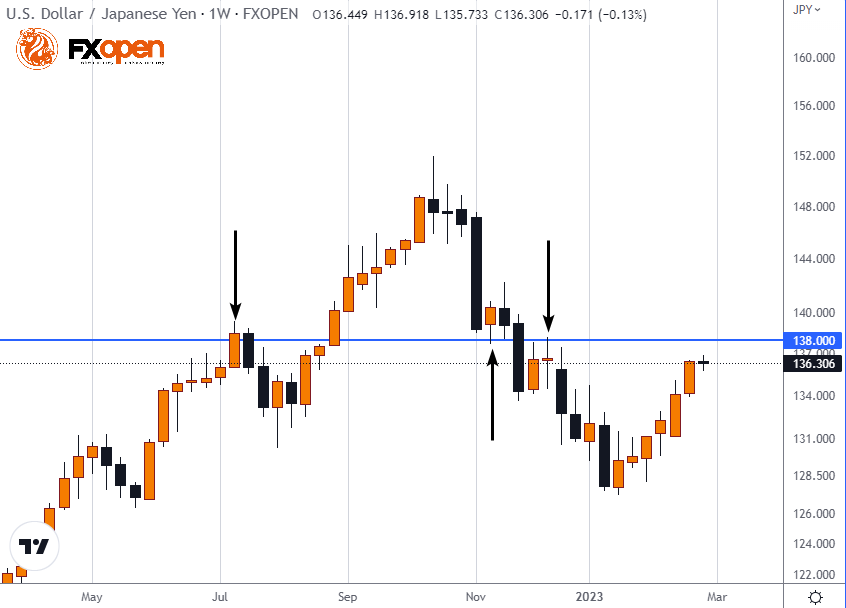
Thus, February witnessed the strengthening of the value of the US dollar. The yen was no exception, which by March 1 had weakened to its lowest level since the beginning of the year. Note that the USDJPY rate is approaching the level of 138 yen per dollar, which previously worked as both support and resistance. It is possible that it will have an impact on the quote if it reaches it in March.
What will be the first month of spring? It is possible that the February trend will continue in early March. Some of the important events will be:
→ inflation data on March 14;
→ Fed meeting on March 22 – rate hike by 0.25% is expected.
To take advantage of trends in the financial markets, consider enlisting the services of a reliable broker like FXOpen.
⚠️
CFDs are complex instruments and come with a high risk of losing your money.
This forecast represents FXOpen Companies opinion only, it should not be construed as an offer, invitation or recommendation in respect to FXOpen Companies products and services or as financial advice.
FEBRUARY REMOVES THE JANUARY POSITIVE
In January, positive sentiment prevailed on the financial markets due to the following facts:
→ the peak of inflation seemed to be passed;
→ China lifted Covid restrictions.
However, in February, the mood changed due to the fact that new data showed a stable nature of inflation. Recession forecasts are back on the agenda.
As a result:
→ S&P-500: January +4.9%, February -2.7%
→ Gold: January +6.2%, February -5.2%
→ Euro: January +1.6%, February -2.7%
→ Pound: January +2.1%, February -2.2%
Thus, February witnessed the strengthening of the value of the US dollar. The yen was no exception, which by March 1 had weakened to its lowest level since the beginning of the year. Note that the USDJPY rate is approaching the level of 138 yen per dollar, which previously worked as both support and resistance. It is possible that it will have an impact on the quote if it reaches it in March.
What will be the first month of spring? It is possible that the February trend will continue in early March. Some of the important events will be:
→ inflation data on March 14;
→ Fed meeting on March 22 – rate hike by 0.25% is expected.
To take advantage of trends in the financial markets, consider enlisting the services of a reliable broker like FXOpen.
⚠️
CFDs are complex instruments and come with a high risk of losing your money.
This forecast represents FXOpen Companies opinion only, it should not be construed as an offer, invitation or recommendation in respect to FXOpen Companies products and services or as financial advice.
👍1
#MarketNews #Oil
IS THE OIL MARKET PREPARING FOR A TREND?
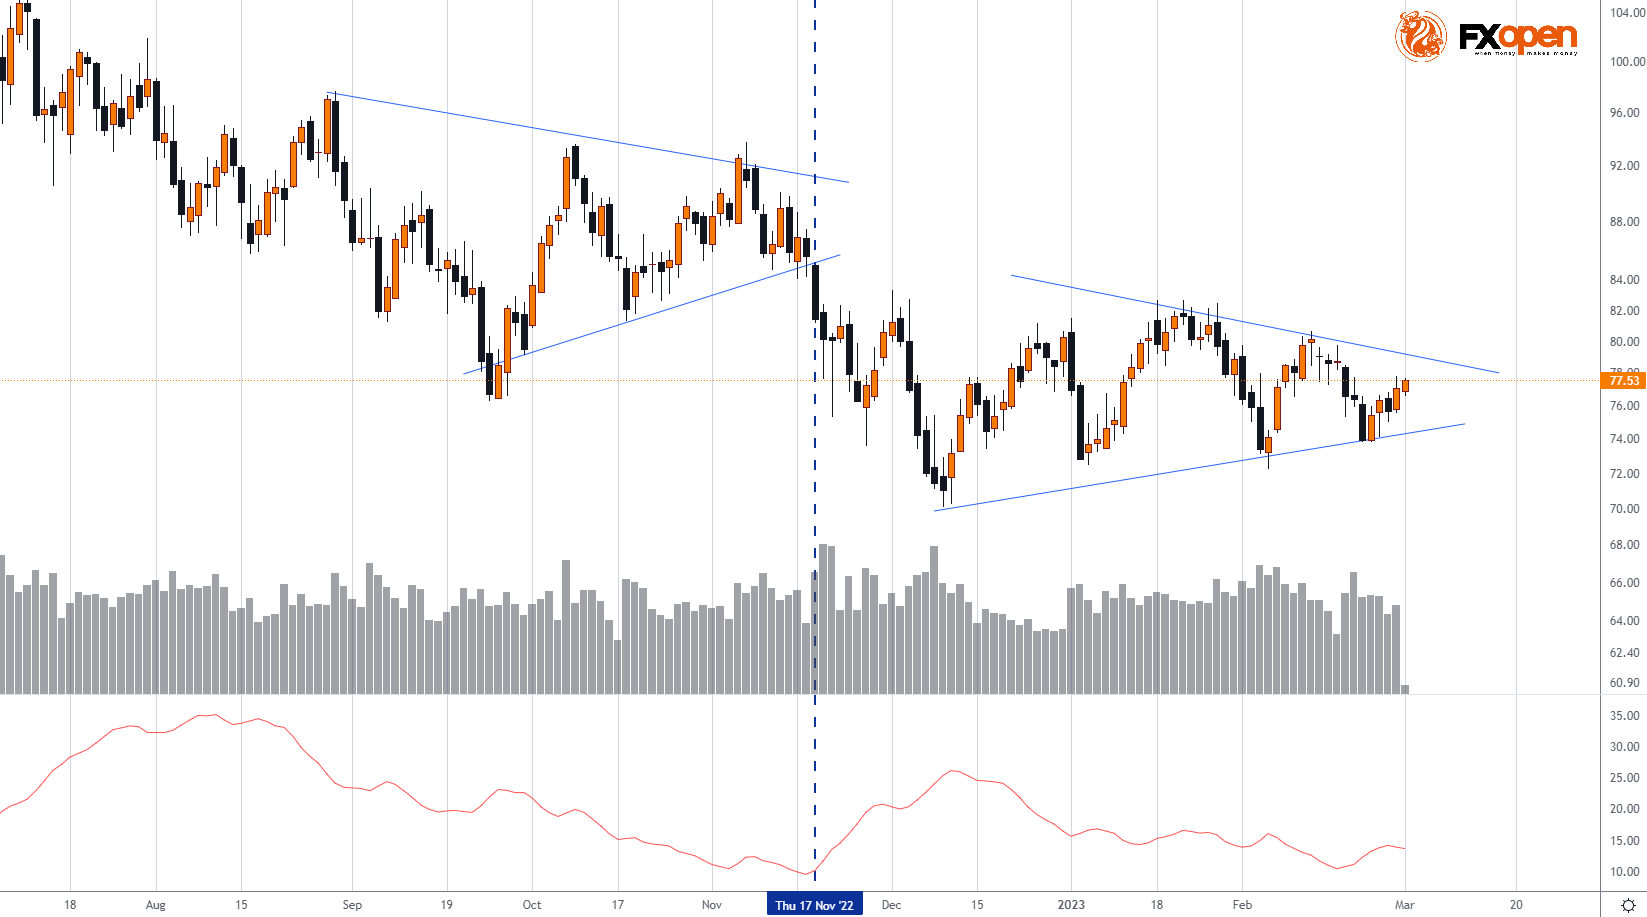
The price of oil futures on the stock exchange in New York fluctuates between $72.5 and $82 since the beginning of the year. However, in fact, the beginning of the range can be considered as early as December 2022. Fluctuations over the days lose their amplitude, while on the graph:
→ a narrowing triangle pattern is formed;
→ the ADX indicator falls to its lows, indicating the absence of a trend.
Note what happened last time the contracting triangle pattern formed on the back of low ADX values. On November 17, there was a breakdown on the growing volumes of the lower line of the triangle, the market entered the trend, and the price fell by 20% in 3 weeks.
There is a common comparison among technical analysts that a contracting triangle is a kind of “spring” that accumulates energy for the next trend. And if lately you have not heard news about the oil market, this does not mean that it is not of interest. Perhaps just the opposite. It would make sense to watch for when the price approaches the borders of the current triangle in order to identify breakout signals, after which a significant trend may develop.
To take advantage of price changes in the oil markets, consider enlisting the services of a reliable broker like FXOpen.
⚠️
CFDs are complex instruments and come with a high risk of losing your money.
This forecast represents FXOpen Companies opinion only, it should not be construed as an offer, invitation or recommendation in respect to FXOpen Companies products and services or as financial advice.
IS THE OIL MARKET PREPARING FOR A TREND?
The price of oil futures on the stock exchange in New York fluctuates between $72.5 and $82 since the beginning of the year. However, in fact, the beginning of the range can be considered as early as December 2022. Fluctuations over the days lose their amplitude, while on the graph:
→ a narrowing triangle pattern is formed;
→ the ADX indicator falls to its lows, indicating the absence of a trend.
Note what happened last time the contracting triangle pattern formed on the back of low ADX values. On November 17, there was a breakdown on the growing volumes of the lower line of the triangle, the market entered the trend, and the price fell by 20% in 3 weeks.
There is a common comparison among technical analysts that a contracting triangle is a kind of “spring” that accumulates energy for the next trend. And if lately you have not heard news about the oil market, this does not mean that it is not of interest. Perhaps just the opposite. It would make sense to watch for when the price approaches the borders of the current triangle in order to identify breakout signals, after which a significant trend may develop.
To take advantage of price changes in the oil markets, consider enlisting the services of a reliable broker like FXOpen.
⚠️
CFDs are complex instruments and come with a high risk of losing your money.
This forecast represents FXOpen Companies opinion only, it should not be construed as an offer, invitation or recommendation in respect to FXOpen Companies products and services or as financial advice.
😱1
#MarketNews
GBPUSD: BEARISH PATTERN AND CBR UNCERTAINTY
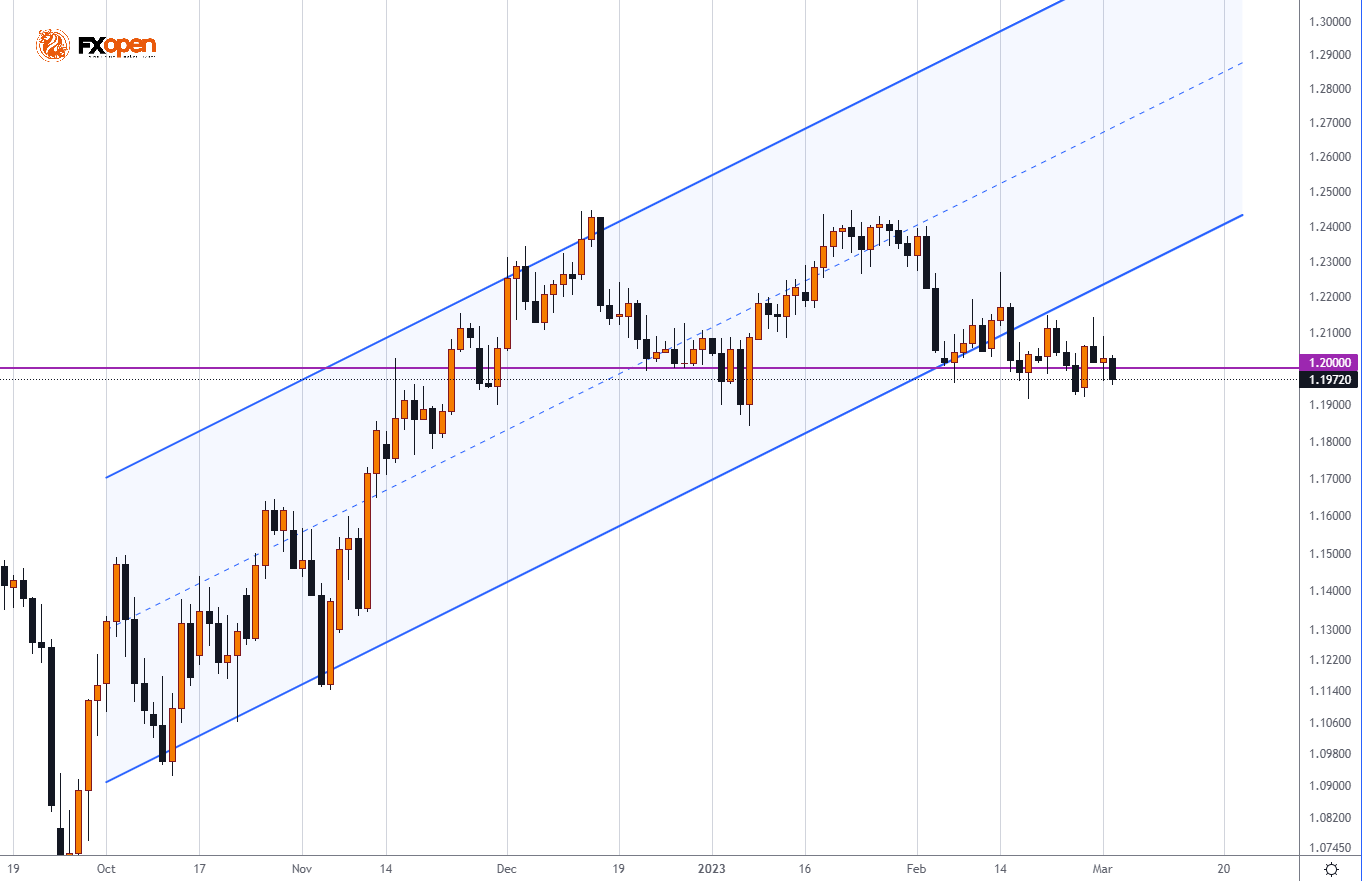
On March 23, the decision of the Bank of England regarding the interest rate will be published; an increase of 25 basis points is expected. But yesterday the head of the Bank of England, Andrew Bailey, said that there is still no decision on whether to raise interest rates again.
The uncertainty in Bailey's words may have confused market participants, and today the GBPUSD pair is trading lower, continuing to form a massive bearish pattern on the chart — a double top pattern, which is based on the highs of December and January. At the same time, the so-called “neck line” runs in the area of the psychological mark of 1.2 pounds per dollar.
Note that in February the market lost its upward momentum (framed by a blue channel), and the quote fixed below the bottom line of the channel. A decline to the level of 1.19 will give grounds to fix a bearish breakdown of the “neck line”, which may open up prospects for further decline.
To take advantage of the growth and decline of currency quotes, consider enlisting the services of a reliable broker like FXOpen.
⚠️
CFDs are complex instruments and come with a high risk of losing your money.
This forecast represents FXOpen Companies opinion only, it should not be construed as an offer, invitation or recommendation in respect to FXOpen Companies products and services or as financial advice.
GBPUSD: BEARISH PATTERN AND CBR UNCERTAINTY
On March 23, the decision of the Bank of England regarding the interest rate will be published; an increase of 25 basis points is expected. But yesterday the head of the Bank of England, Andrew Bailey, said that there is still no decision on whether to raise interest rates again.
The uncertainty in Bailey's words may have confused market participants, and today the GBPUSD pair is trading lower, continuing to form a massive bearish pattern on the chart — a double top pattern, which is based on the highs of December and January. At the same time, the so-called “neck line” runs in the area of the psychological mark of 1.2 pounds per dollar.
Note that in February the market lost its upward momentum (framed by a blue channel), and the quote fixed below the bottom line of the channel. A decline to the level of 1.19 will give grounds to fix a bearish breakdown of the “neck line”, which may open up prospects for further decline.
To take advantage of the growth and decline of currency quotes, consider enlisting the services of a reliable broker like FXOpen.
⚠️
CFDs are complex instruments and come with a high risk of losing your money.
This forecast represents FXOpen Companies opinion only, it should not be construed as an offer, invitation or recommendation in respect to FXOpen Companies products and services or as financial advice.
#MarketNews #Cryptocurrency
WHAT SILVERGATE TROUBLE MEANS FOR CRYPTO MARKET
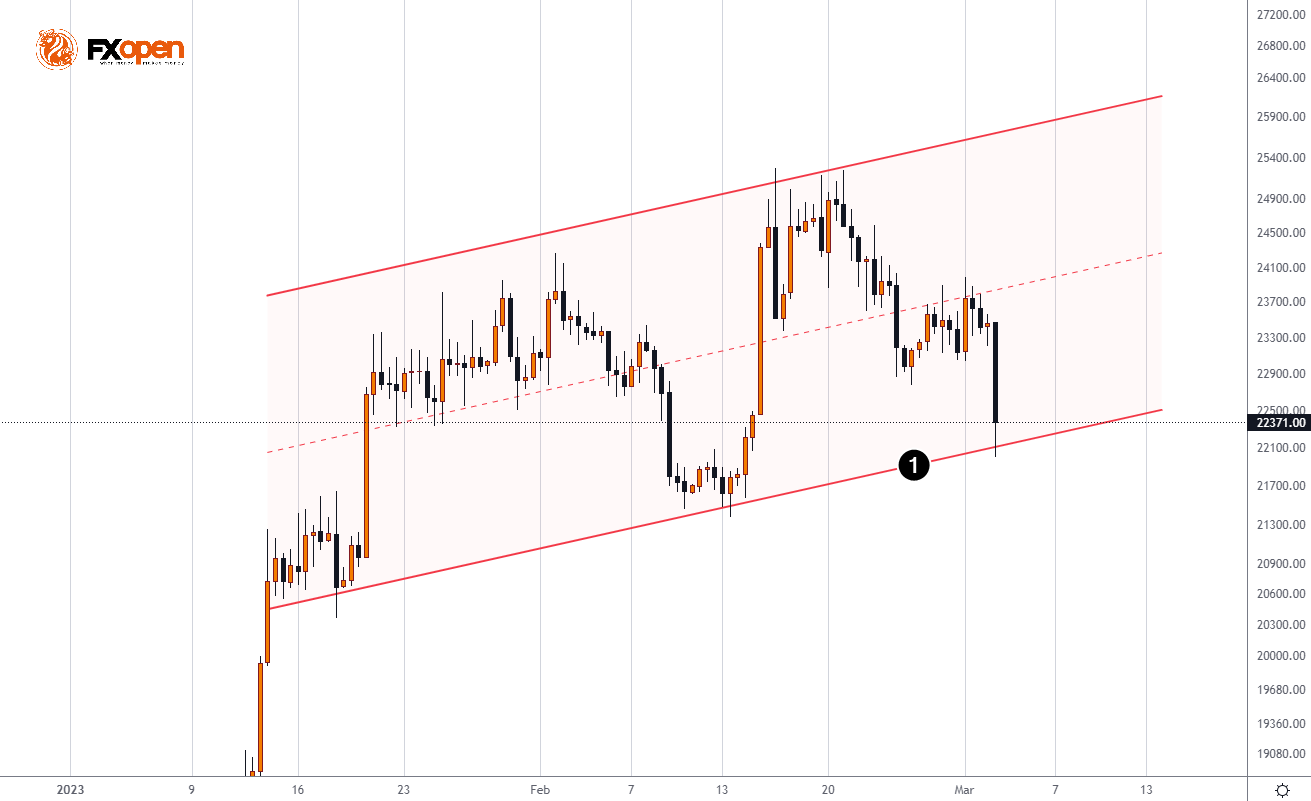
The 5% fall in the value of bitcoin in 60 minutes, which occurred today, is due to problems with the Silvergate bank.
Silvergate is a California-based bank that primarily handles cryptocurrency transactions. At the beginning of 2022, its shares were worth $140 on the NYSE. But then came the “crypto winter,” the FTX bankruptcy, and other negative events that led to concerns about the bankruptcy of Silvergate.
According to the latest news:
→ Silvergate Bank delays reporting;
→ WSJ: Coinbase, Circle, Paxos, and Galaxy Digital have announced plans to stop banking with Silvergate;
→ Bloomberg: It will be difficult for Silvergate clients to find another bank, because no bank wants to receive deposits from crypto companies due to scrutiny from regulators.
As of this morning, 1 share of Silvergate is priced below $6 (-96% YTD). According to rumors, the situation plays into the hands of Hong Kong, which can become a global hub for cryptocurrencies. There are also opinions that the pressure of US regulators on the crypto market is a “cleansing” of the crypto field before systemic banks, such as Morgan Stanley, for example, enter there.
So far, the BTC price is holding the support line (1), however, in the event of a new portion of bearish news, the price may break through this line, causing an increase in panic.
To take advantage of rising and falling prices in the crypto market, consider enlisting the services of a reliable broker like FXOpen.
⚠️
CFDs are complex instruments and come with a high risk of losing your money.
This forecast represents FXOpen Companies opinion only, it should not be construed as an offer, invitation or recommendation in respect to FXOpen Companies products and services or as financial advice.
Cryptocurrency CFDs are not available to Retail clients in the UK.
WHAT SILVERGATE TROUBLE MEANS FOR CRYPTO MARKET
The 5% fall in the value of bitcoin in 60 minutes, which occurred today, is due to problems with the Silvergate bank.
Silvergate is a California-based bank that primarily handles cryptocurrency transactions. At the beginning of 2022, its shares were worth $140 on the NYSE. But then came the “crypto winter,” the FTX bankruptcy, and other negative events that led to concerns about the bankruptcy of Silvergate.
According to the latest news:
→ Silvergate Bank delays reporting;
→ WSJ: Coinbase, Circle, Paxos, and Galaxy Digital have announced plans to stop banking with Silvergate;
→ Bloomberg: It will be difficult for Silvergate clients to find another bank, because no bank wants to receive deposits from crypto companies due to scrutiny from regulators.
As of this morning, 1 share of Silvergate is priced below $6 (-96% YTD). According to rumors, the situation plays into the hands of Hong Kong, which can become a global hub for cryptocurrencies. There are also opinions that the pressure of US regulators on the crypto market is a “cleansing” of the crypto field before systemic banks, such as Morgan Stanley, for example, enter there.
So far, the BTC price is holding the support line (1), however, in the event of a new portion of bearish news, the price may break through this line, causing an increase in panic.
To take advantage of rising and falling prices in the crypto market, consider enlisting the services of a reliable broker like FXOpen.
⚠️
CFDs are complex instruments and come with a high risk of losing your money.
This forecast represents FXOpen Companies opinion only, it should not be construed as an offer, invitation or recommendation in respect to FXOpen Companies products and services or as financial advice.
Cryptocurrency CFDs are not available to Retail clients in the UK.
#MarketNews #TSLA
ZACKS: TSLA COULD GROW BY 30%
This week, Tesla CEO Elon Musk held an “investor day” and presented “Master Plan 3”, in which he spoke about the intentions to transition our planet to a sustainable energy system. Talking about electric cars, heat pumps, green hydrogen, electric boats and aircraft, Musk suggested that his version of the energy transition would cost $10 trillion and require only a fraction of the world's reserves of lithium, nickel and rare-earths. He noted that Tesla will soon publish a detailed white paper explaining the calculation methods, models and assumptions.
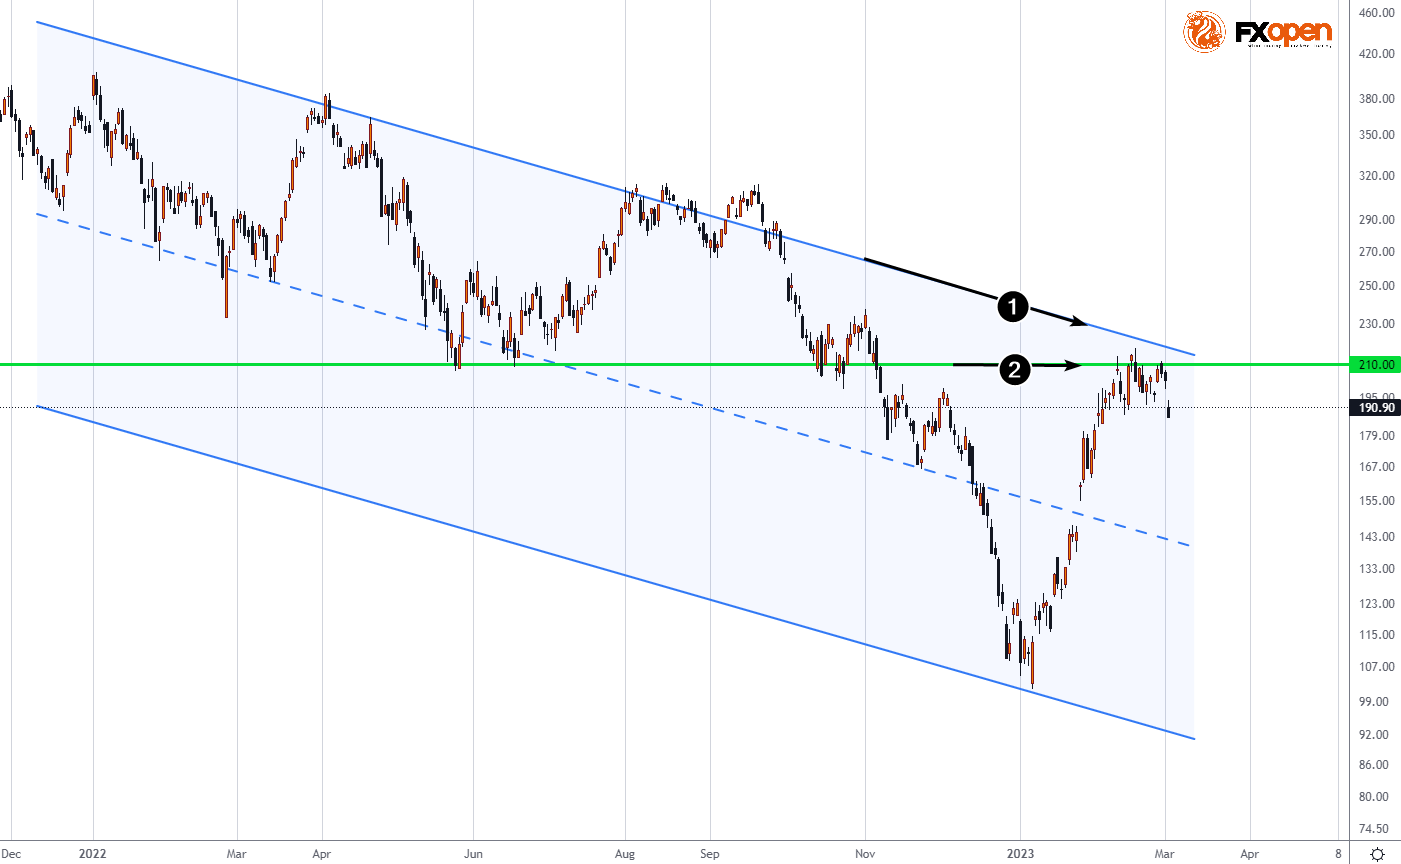
In fact, “Master Plan 3” was a disappointment to investors, as it contained little specifics regarding the development of Tesla production. As a result, the stock was down 5%, turning down from the area of resistance lines (as shown by numbers 1 and 2).
However, the stock has upside potential, in which the current decline will turn out to be a short-term pullback. According to analyst firm Zacks, the cost of TSLA could rise by 30% to $260 over the next 12 months, as the production and sales of the CyberTrack model should take place.
The growth of shares can contribute to:
→ construction of a plant in Mexico;
→ the company's ability to grow with a margin of >20%;
→ Plans to halve costs to reach the goal of selling 20 million electric vehicles a year by 2030
To take advantage of trends in the stock markets of popular companies, consider enlisting the services of a reliable broker like FXOpen.
⚠️
CFDs are complex instruments and come with a high risk of losing your money.
This forecast represents FXOpen Companies opinion only, it should not be construed as an offer, invitation or recommendation in respect to FXOpen Companies products and services or as financial advice.
ZACKS: TSLA COULD GROW BY 30%
This week, Tesla CEO Elon Musk held an “investor day” and presented “Master Plan 3”, in which he spoke about the intentions to transition our planet to a sustainable energy system. Talking about electric cars, heat pumps, green hydrogen, electric boats and aircraft, Musk suggested that his version of the energy transition would cost $10 trillion and require only a fraction of the world's reserves of lithium, nickel and rare-earths. He noted that Tesla will soon publish a detailed white paper explaining the calculation methods, models and assumptions.
In fact, “Master Plan 3” was a disappointment to investors, as it contained little specifics regarding the development of Tesla production. As a result, the stock was down 5%, turning down from the area of resistance lines (as shown by numbers 1 and 2).
However, the stock has upside potential, in which the current decline will turn out to be a short-term pullback. According to analyst firm Zacks, the cost of TSLA could rise by 30% to $260 over the next 12 months, as the production and sales of the CyberTrack model should take place.
The growth of shares can contribute to:
→ construction of a plant in Mexico;
→ the company's ability to grow with a margin of >20%;
→ Plans to halve costs to reach the goal of selling 20 million electric vehicles a year by 2030
To take advantage of trends in the stock markets of popular companies, consider enlisting the services of a reliable broker like FXOpen.
⚠️
CFDs are complex instruments and come with a high risk of losing your money.
This forecast represents FXOpen Companies opinion only, it should not be construed as an offer, invitation or recommendation in respect to FXOpen Companies products and services or as financial advice.
👍1
Watch FXOpen's February 27 - March 3 Weekly Market Wrap Video
On FXOpen Market News, FXOpen UK COO Gary Thomson sums up the week’s happenings and discusses the most significant news reports. You can also find text versions of the news reports at our Internet resources.
https://youtu.be/6lRADdUmsMA
On FXOpen Market News, FXOpen UK COO Gary Thomson sums up the week’s happenings and discusses the most significant news reports. You can also find text versions of the news reports at our Internet resources.
https://youtu.be/6lRADdUmsMA
YouTube
FXOpen Weekly Market Wrap With Gary Thomson: US INDICES, SEC & CRYPTO, GBPUSD,
Watch FXOpen's February 27 - March 3 Weekly Market Wrap Video
In this video, FXOpen UK COO Gary Thomson sums up the week’s happenings and discusses the most significant news reports.
00:22 - February removes the January positive
02:15 - US indices post…
In this video, FXOpen UK COO Gary Thomson sums up the week’s happenings and discusses the most significant news reports.
00:22 - February removes the January positive
02:15 - US indices post…
FXOpen official pinned «Watch FXOpen's February 27 - March 3 Weekly Market Wrap Video On FXOpen Market News, FXOpen UK COO Gary Thomson sums up the week’s happenings and discusses the most significant news reports. You can also find text versions of the news reports at our Internet…»
#MarketNews
SWISS NATIONAL BANK REPORTS RECORD LOSSES
The Swiss National Bank (SNB) reported an annual loss of 132.5 billion Swiss francs. This is the largest loss in the 115-year history of the central bank, and it is caused by 2 reasons:
1→ a fall in the value of SNB investments due to a decline in the bond and stock market in 2022;
2→ the strengthening of the Swiss franc. After all, the SNB's assets declined when foreign investment income was converted into Swiss francs.
On March 23, the SNB is due to publish its monetary policy decision, but bank officials have not commented on whether a record loss could affect it.
It is interesting that the Swiss franc is strengthening against the backdrop of negative news from the SNB — most likely this is due to the expectation of market participants for a speech by Fed Chairman Powell, which is due tomorrow.
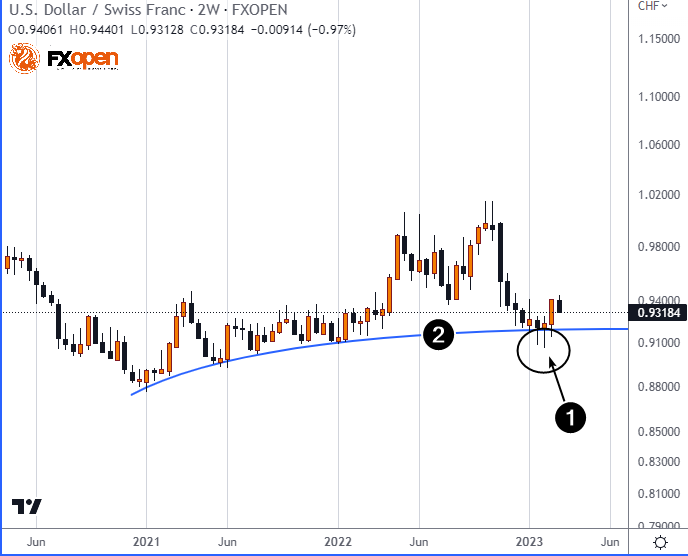
Notice the long lower shadows (1) that form when the price drops below the support level (2). This indicates the presence of demand, which holds the course and can be used to plan your operations in the foreign exchange markets.
To take advantage of forex trends, consider enlisting the services of a reliable broker like FXOpen.
⚠️
CFDs are complex instruments and come with a high risk of losing your money.
This forecast represents FXOpen Companies opinion only, it should not be construed as an offer, invitation or recommendation in respect to FXOpen Companies products and services or as financial advice.
SWISS NATIONAL BANK REPORTS RECORD LOSSES
The Swiss National Bank (SNB) reported an annual loss of 132.5 billion Swiss francs. This is the largest loss in the 115-year history of the central bank, and it is caused by 2 reasons:
1→ a fall in the value of SNB investments due to a decline in the bond and stock market in 2022;
2→ the strengthening of the Swiss franc. After all, the SNB's assets declined when foreign investment income was converted into Swiss francs.
On March 23, the SNB is due to publish its monetary policy decision, but bank officials have not commented on whether a record loss could affect it.
It is interesting that the Swiss franc is strengthening against the backdrop of negative news from the SNB — most likely this is due to the expectation of market participants for a speech by Fed Chairman Powell, which is due tomorrow.
Notice the long lower shadows (1) that form when the price drops below the support level (2). This indicates the presence of demand, which holds the course and can be used to plan your operations in the foreign exchange markets.
To take advantage of forex trends, consider enlisting the services of a reliable broker like FXOpen.
⚠️
CFDs are complex instruments and come with a high risk of losing your money.
This forecast represents FXOpen Companies opinion only, it should not be construed as an offer, invitation or recommendation in respect to FXOpen Companies products and services or as financial advice.
😱1
#MarketNews #Cryptocurrency #ETH
SHOULD ETH INVESTORS BE CONCERNED?
According to blockchain network analysts, the number of wallets holding more than 1 ETH has reached 1,743,911, the highest since the beginning of the year. This is positive information, but in fact there are 3 arguments that can make ETH investors worried:
1. Pressure from the SEC on the crypto industry.
As per the latest information:
→ an SEC spokesperson stated that Binance US operates an “unregistered securities exchange”;
→ Lido staking service may have received a notice from the SEC. A spokesperson for the project declined to comment on the rumors.
2. Voyager Digital sold nearly 1,500 Ethereum worth over $2 million. And this is not the only major transaction indicating the sale of assets.
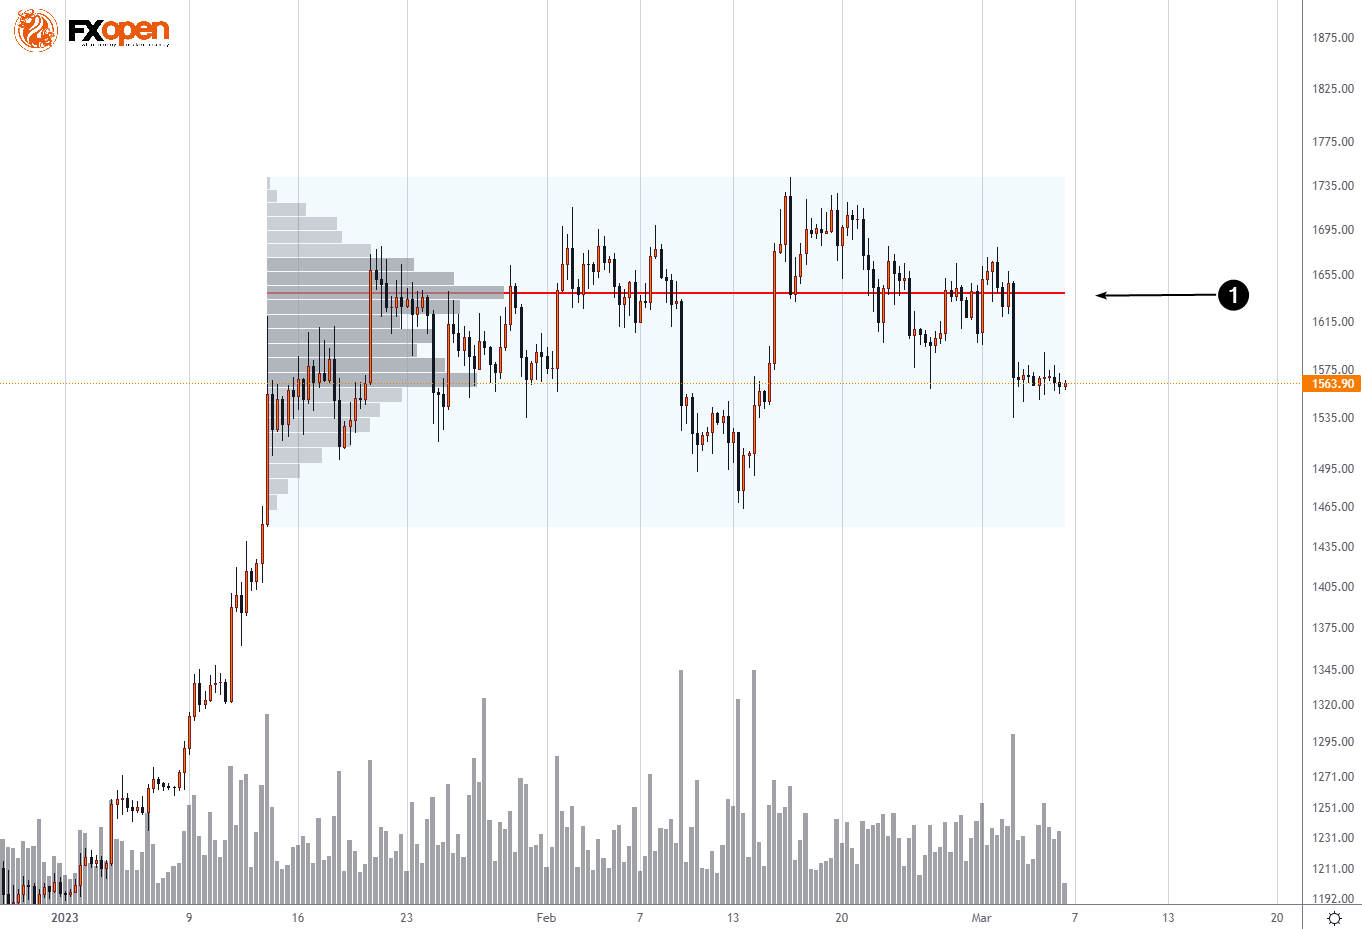
3. As the market profile shows, the current price is below the level (1), where the largest volume of transactions took place. This can be interpreted as the fact that the consensus indicates a possible further price decline.
To take advantage of the rise and fall of cryptocurrencies, consider enlisting the services of a reliable broker like FXOpen.
⚠️
CFDs are complex instruments and come with a high risk of losing your money.
This forecast represents FXOpen Companies opinion only, it should not be construed as an offer, invitation or recommendation in respect to FXOpen Companies products and services or as financial advice.
SHOULD ETH INVESTORS BE CONCERNED?
According to blockchain network analysts, the number of wallets holding more than 1 ETH has reached 1,743,911, the highest since the beginning of the year. This is positive information, but in fact there are 3 arguments that can make ETH investors worried:
1. Pressure from the SEC on the crypto industry.
As per the latest information:
→ an SEC spokesperson stated that Binance US operates an “unregistered securities exchange”;
→ Lido staking service may have received a notice from the SEC. A spokesperson for the project declined to comment on the rumors.
2. Voyager Digital sold nearly 1,500 Ethereum worth over $2 million. And this is not the only major transaction indicating the sale of assets.
3. As the market profile shows, the current price is below the level (1), where the largest volume of transactions took place. This can be interpreted as the fact that the consensus indicates a possible further price decline.
To take advantage of the rise and fall of cryptocurrencies, consider enlisting the services of a reliable broker like FXOpen.
⚠️
CFDs are complex instruments and come with a high risk of losing your money.
This forecast represents FXOpen Companies opinion only, it should not be construed as an offer, invitation or recommendation in respect to FXOpen Companies products and services or as financial advice.
#MarketNews #AAPL
AAPL SHARES: GOLDMAN SACHS PUTS BUY RATING
In recent days, the media has been broadcasting bullish news regarding the shares of Apple, the largest by capitalization in the United States:
→ According to NTS CEO Cher Wang, Apple plans to release a mixed reality device this year;
→ Apple is gearing up for a new line of laptops and desktops, including a new iMac.
→ Goldman Sachs set a buy rating with a target price of $199 (interestingly, it took 6 years for this to happen).
Against the backdrop of this bullish news, AAPL shares were the top gainers yesterday.
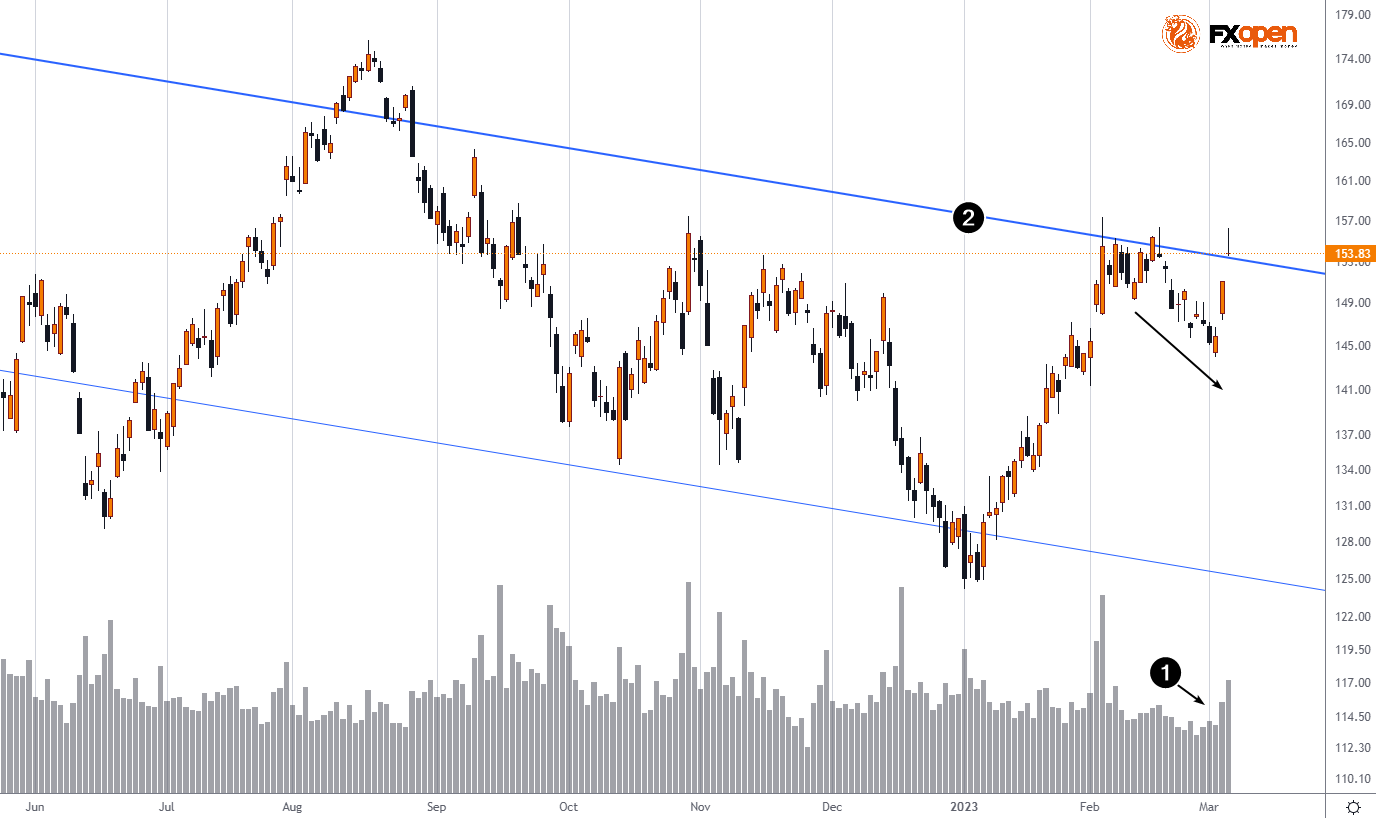
A bullish gap formed on the chart, and the price at the high of the day was close to the high since the beginning of the year. A decrease in volumes (1) against the backdrop of a price decrease in the second half of February may indicate a lack of supply — presumably, traders are not ready to part with a promising stock, so trading activity in them is declining.
However, will the forces of demand be able to overcome the trend line (2), which works as resistance? Most of the analysts surveyed by TipRanks believe this. According to their average estimate, the price of AAPL in a year will be more than $171.
To invest like a pro, consider enlisting the services of a reliable broker like FXOpen.
⚠️
CFDs are complex instruments and come with a high risk of losing your money.
This forecast represents FXOpen Companies opinion only, it should not be construed as an offer, invitation or recommendation in respect to FXOpen Companies products and services or as financial advice.
AAPL SHARES: GOLDMAN SACHS PUTS BUY RATING
In recent days, the media has been broadcasting bullish news regarding the shares of Apple, the largest by capitalization in the United States:
→ According to NTS CEO Cher Wang, Apple plans to release a mixed reality device this year;
→ Apple is gearing up for a new line of laptops and desktops, including a new iMac.
→ Goldman Sachs set a buy rating with a target price of $199 (interestingly, it took 6 years for this to happen).
Against the backdrop of this bullish news, AAPL shares were the top gainers yesterday.
A bullish gap formed on the chart, and the price at the high of the day was close to the high since the beginning of the year. A decrease in volumes (1) against the backdrop of a price decrease in the second half of February may indicate a lack of supply — presumably, traders are not ready to part with a promising stock, so trading activity in them is declining.
However, will the forces of demand be able to overcome the trend line (2), which works as resistance? Most of the analysts surveyed by TipRanks believe this. According to their average estimate, the price of AAPL in a year will be more than $171.
To invest like a pro, consider enlisting the services of a reliable broker like FXOpen.
⚠️
CFDs are complex instruments and come with a high risk of losing your money.
This forecast represents FXOpen Companies opinion only, it should not be construed as an offer, invitation or recommendation in respect to FXOpen Companies products and services or as financial advice.
FXOpen to Switch to Daylight Saving Time on March 12
Dear Traders,
On March 12th, 2023, FXOpen will shift the trading servers’ time forward by one hour from GMT+2 to GMT+3.
The change will affect all account types. For ECN, STP, and Micro accounts, it will come into effect as the market opens on Monday, March 13, 2023. For Crypto accounts where trading is available over the weekend, traders will notice a change on Sunday, March 12, 2023.
The transition of servers to daylight saving time does not impact the trading process. You will be able to open, close and modify orders as usual − just make sure to change the time in your indicators and expert advisors accordingly for them to function properly.
Dear Traders,
On March 12th, 2023, FXOpen will shift the trading servers’ time forward by one hour from GMT+2 to GMT+3.
The change will affect all account types. For ECN, STP, and Micro accounts, it will come into effect as the market opens on Monday, March 13, 2023. For Crypto accounts where trading is available over the weekend, traders will notice a change on Sunday, March 12, 2023.
The transition of servers to daylight saving time does not impact the trading process. You will be able to open, close and modify orders as usual − just make sure to change the time in your indicators and expert advisors accordingly for them to function properly.