
#MarketNews #forex
Market Analysis: EUR/USD Restarts Increase While USD/JPY Corrects After Rally
🔸The Euro is rising and gaining pace above the 1.1000 resistance zone.
🔸There was a break above a key bearish trend line with resistance near 1.1000 on the hourly chart of EUR/USD at FXOpen.
🔸USD/JPY started a major rally above the 136.00 and 137.00 levels.
🔸There was a break below a key bullish trend line with support near 137.45 on the hourly chart at FXOpen.
https://cutt.ly/F5BHSoi
To take advantage of price fluctuations in the foreign exchange markets, consider enlisting the services of a reliable broker like FXOpen.
⚠️
CFDs are complex instruments and come with a high risk of losing your money.
This forecast represents FXOpen Companies opinion only, it should not be construed as an offer, invitation or recommendation in respect to FXOpen Companies products and services or as financial advice
Market Analysis: EUR/USD Restarts Increase While USD/JPY Corrects After Rally
🔸The Euro is rising and gaining pace above the 1.1000 resistance zone.
🔸There was a break above a key bearish trend line with resistance near 1.1000 on the hourly chart of EUR/USD at FXOpen.
🔸USD/JPY started a major rally above the 136.00 and 137.00 levels.
🔸There was a break below a key bullish trend line with support near 137.45 on the hourly chart at FXOpen.
https://cutt.ly/F5BHSoi
To take advantage of price fluctuations in the foreign exchange markets, consider enlisting the services of a reliable broker like FXOpen.
⚠️
CFDs are complex instruments and come with a high risk of losing your money.
This forecast represents FXOpen Companies opinion only, it should not be construed as an offer, invitation or recommendation in respect to FXOpen Companies products and services or as financial advice
Market Pulse
Market Analysis: EUR/USD Restarts Increase While USD/JPY Corrects After Rally
EUR/USD started a fresh increase above the 1.1000 resistance. USD/JPY rallied significantly above 137.00 and recently started a downside correction. Important Takeaways for EUR/USD and USD/JPY· The Euro is rising and gaining pace above the 1.1000 resistance…
#MarketNews #crypto
CRYPTO INVESTORS REDUCING RISKS
According to analysts from CoinShares, the outflow of capital from crypto assets over the past week amounted to more than $72 million. We are talking about funds such as Grayscale or Proshares, which allow institutional investors to invest in products related to cryptocurrencies.
There are two possible reasons for the outflow:
1→ Investors reduce risks as they fear the fall of BTC after today's Fed decision.
2→ Signs of weakness in demand around the key USD 30k level.
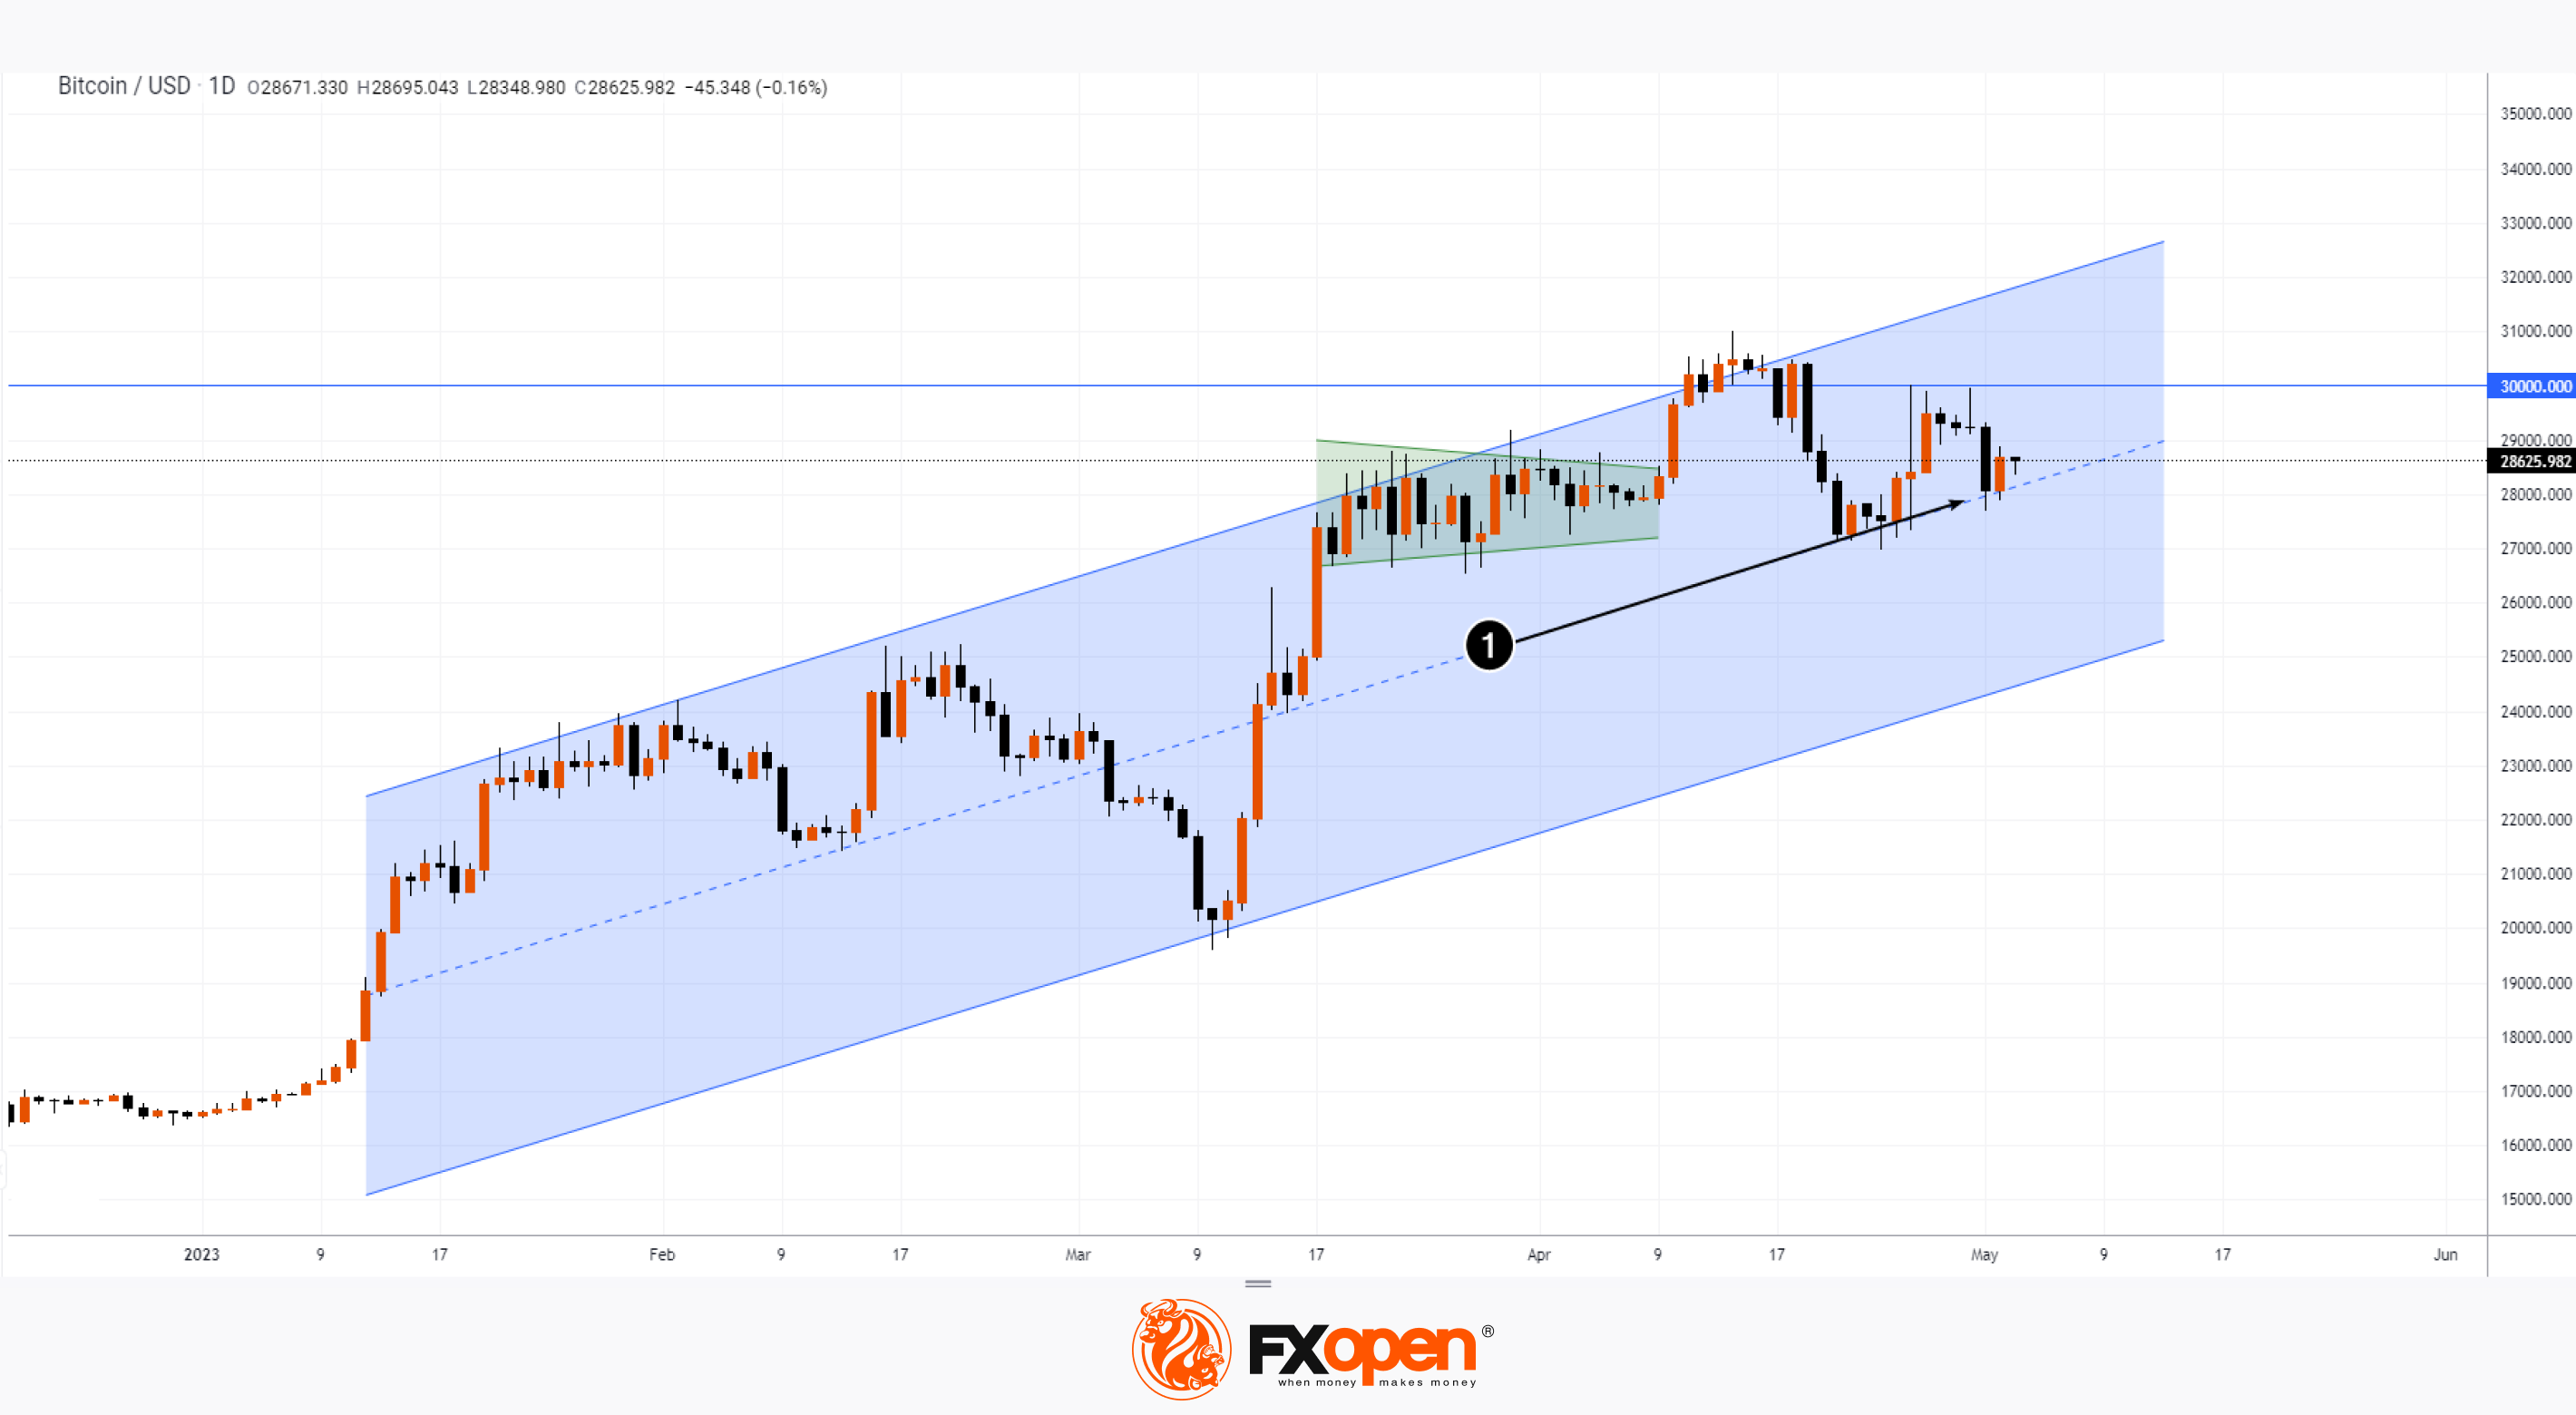
Note that the bulls failed to gain a foothold above this psychological mark in mid-April, and failed to exceed it at the end of April. Thus, the current quote returned to the area of supply and demand balance (shown in green), which was formed in mid-March. In other words, a price increase does not attract new buyers to the market.
So far, the BTCUSD price is supported by the median line (1) of the rising channel, but it can be broken by the bears if USD 30k continues to resist the rally that has been in place since the beginning of the year.
To take advantage of the rise and fall of crypto prices, consider enlisting the services of a reliable broker like FXOpen.
⚠️
CFDs are complex instruments and come with a high risk of losing your money.
This article represents FXOpen Companies’ opinion only, it should not be construed as an offer, solicitation, or recommendation with respect to FXOpen Companies’ products and services or as financial advice.
At FXOpen UK and FXOpen AU, Cryptocurrency CFDs are only available for trading by those clients categorised as Professional clients under FCA Rules and Professional clients under ASIC Rules, respectively. They are not available for trading by Retail clients.
CRYPTO INVESTORS REDUCING RISKS
According to analysts from CoinShares, the outflow of capital from crypto assets over the past week amounted to more than $72 million. We are talking about funds such as Grayscale or Proshares, which allow institutional investors to invest in products related to cryptocurrencies.
There are two possible reasons for the outflow:
1→ Investors reduce risks as they fear the fall of BTC after today's Fed decision.
2→ Signs of weakness in demand around the key USD 30k level.
Note that the bulls failed to gain a foothold above this psychological mark in mid-April, and failed to exceed it at the end of April. Thus, the current quote returned to the area of supply and demand balance (shown in green), which was formed in mid-March. In other words, a price increase does not attract new buyers to the market.
So far, the BTCUSD price is supported by the median line (1) of the rising channel, but it can be broken by the bears if USD 30k continues to resist the rally that has been in place since the beginning of the year.
To take advantage of the rise and fall of crypto prices, consider enlisting the services of a reliable broker like FXOpen.
⚠️
CFDs are complex instruments and come with a high risk of losing your money.
This article represents FXOpen Companies’ opinion only, it should not be construed as an offer, solicitation, or recommendation with respect to FXOpen Companies’ products and services or as financial advice.
At FXOpen UK and FXOpen AU, Cryptocurrency CFDs are only available for trading by those clients categorised as Professional clients under FCA Rules and Professional clients under ASIC Rules, respectively. They are not available for trading by Retail clients.
#MarketNews
MARKET REACTION TO THE FED'S DECISION
The Fed raised the rate yesterday by 0.25%, to 5.25%.
→ Now market participants expect a pause in the tightening policy. Moreover, the WSJ is hinting that the rate hike cycle may already be over.
→ According to Powell, it is important to raise the US debt ceiling, but not just raise it, but raise it on time (that is, not drag it out).
→ The Fed believes that the banking system is reliable and there is no cause for concern (by the way, PacWest bank shares fell 50% yesterday — bank management is considering selling it).
Although the decision was expected, it caused increased volatility:
→ US stock market indexes declined.
→ Gold jumped in price.
→ The US dollar index fell to dollar lows. Accordingly, the major currencies rose against the USD.
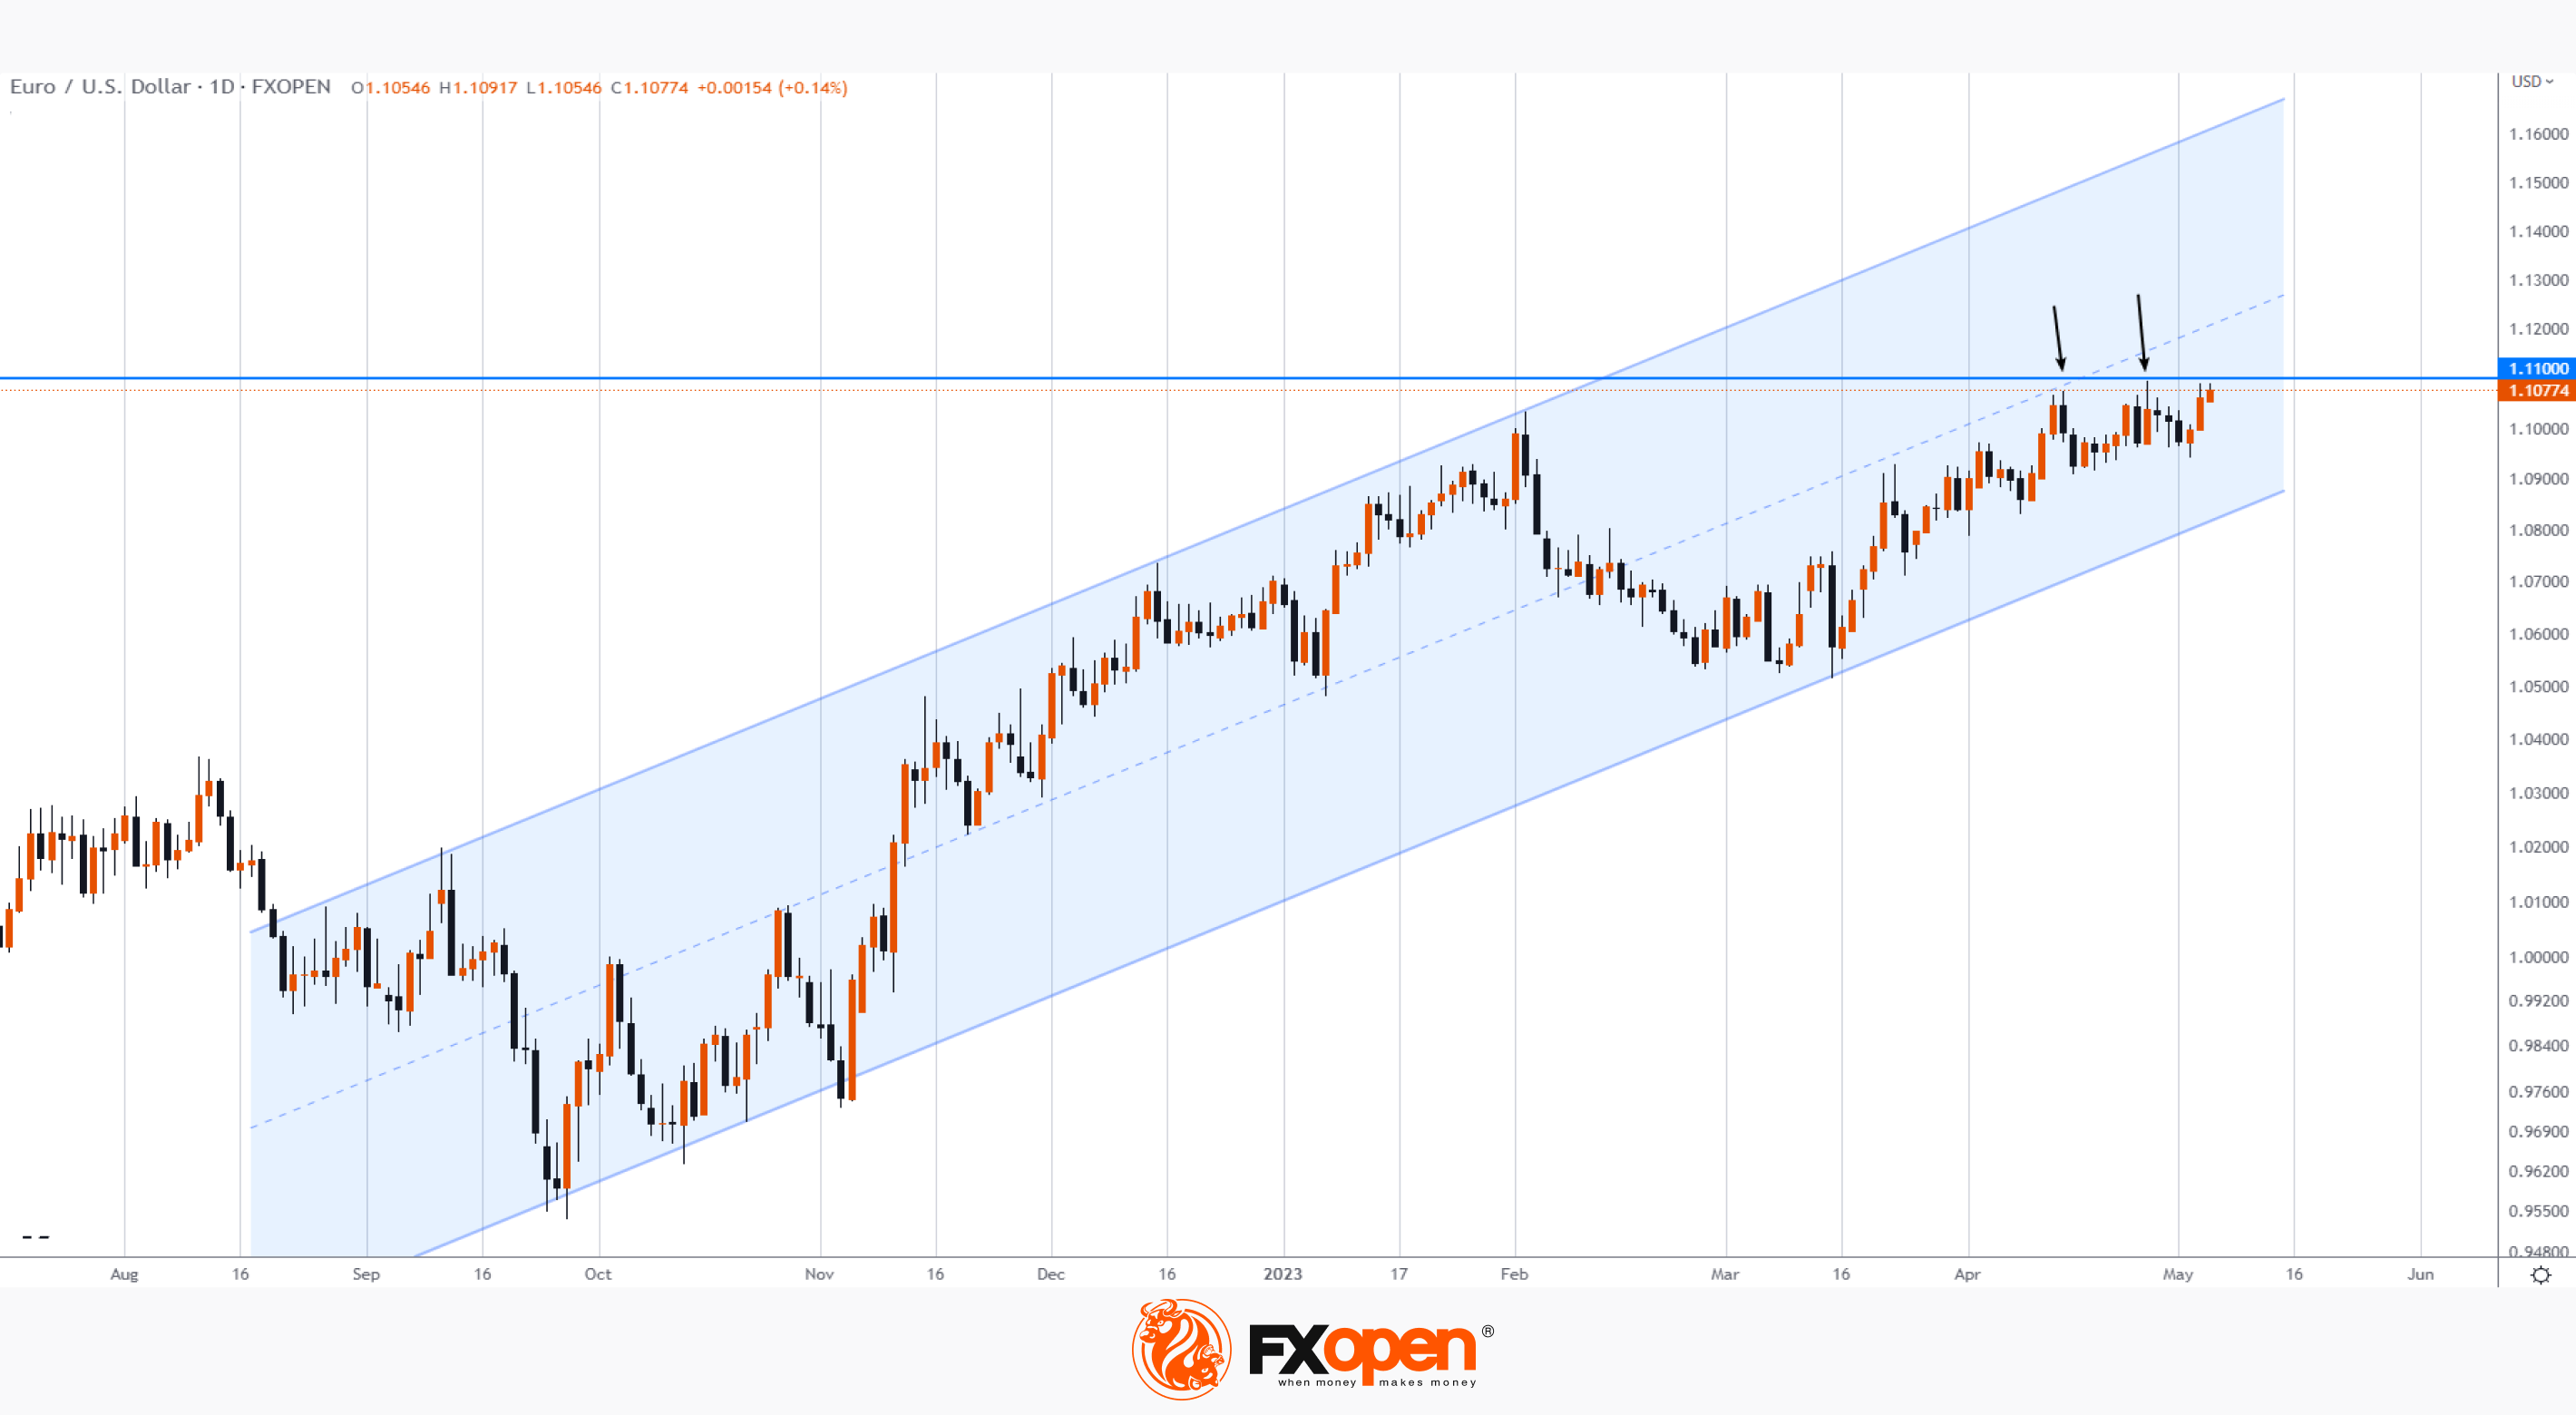
The daily chart shows that EURUSD is near the high of the year. Note, however, that each of the two renewals of the year's high in April (shown by the arrows) was minor, followed by a pullback. This indicates the strength of sellers around the level of 1.100. It looks like the level is working as a serious resistance preventing the continuation of the uptrend (shown by the blue channel).
By the way, today at 15:15 GMT+3 the decision on the ECB rate will be published (an increase of 0.25% is also expected)
To take advantage of trends in the financial markets, consider enlisting the FXOpen.
⚠️
CFDs are complex instruments and come with a high risk of losing your money.
This article represents FXOpen Companies’ opinion only, it should not be construed as an offer, solicitation, or recommendation with respect to FXOpen Companies’ products and services or as financial advice.
MARKET REACTION TO THE FED'S DECISION
The Fed raised the rate yesterday by 0.25%, to 5.25%.
→ Now market participants expect a pause in the tightening policy. Moreover, the WSJ is hinting that the rate hike cycle may already be over.
→ According to Powell, it is important to raise the US debt ceiling, but not just raise it, but raise it on time (that is, not drag it out).
→ The Fed believes that the banking system is reliable and there is no cause for concern (by the way, PacWest bank shares fell 50% yesterday — bank management is considering selling it).
Although the decision was expected, it caused increased volatility:
→ US stock market indexes declined.
→ Gold jumped in price.
→ The US dollar index fell to dollar lows. Accordingly, the major currencies rose against the USD.
The daily chart shows that EURUSD is near the high of the year. Note, however, that each of the two renewals of the year's high in April (shown by the arrows) was minor, followed by a pullback. This indicates the strength of sellers around the level of 1.100. It looks like the level is working as a serious resistance preventing the continuation of the uptrend (shown by the blue channel).
By the way, today at 15:15 GMT+3 the decision on the ECB rate will be published (an increase of 0.25% is also expected)
To take advantage of trends in the financial markets, consider enlisting the FXOpen.
⚠️
CFDs are complex instruments and come with a high risk of losing your money.
This article represents FXOpen Companies’ opinion only, it should not be construed as an offer, solicitation, or recommendation with respect to FXOpen Companies’ products and services or as financial advice.
#MarketNews #stockmarket
STRONG REPORT BRINGS AAPL CLOSER TO YEAR'S HIGH
According to the report of AAPL's activities for the Q1:
→ iPhone revenue: $51.3 billion (+2% yoy);
→ the revenue from services: $20.9 billion (+6% yoy);
→ the company is launching a buyback worth up to USD 90 billion in the next 12 months;
→ the company increases its dividend by 4% to 24 cents per share.
Although sales of iPads and computers fell, rising sales of iPhones (which account for more than half of the company's revenue) caused AAPL to rise 2.5% in premarket prices. At the opening of today's trading session, the price could be around USD 170 per share.
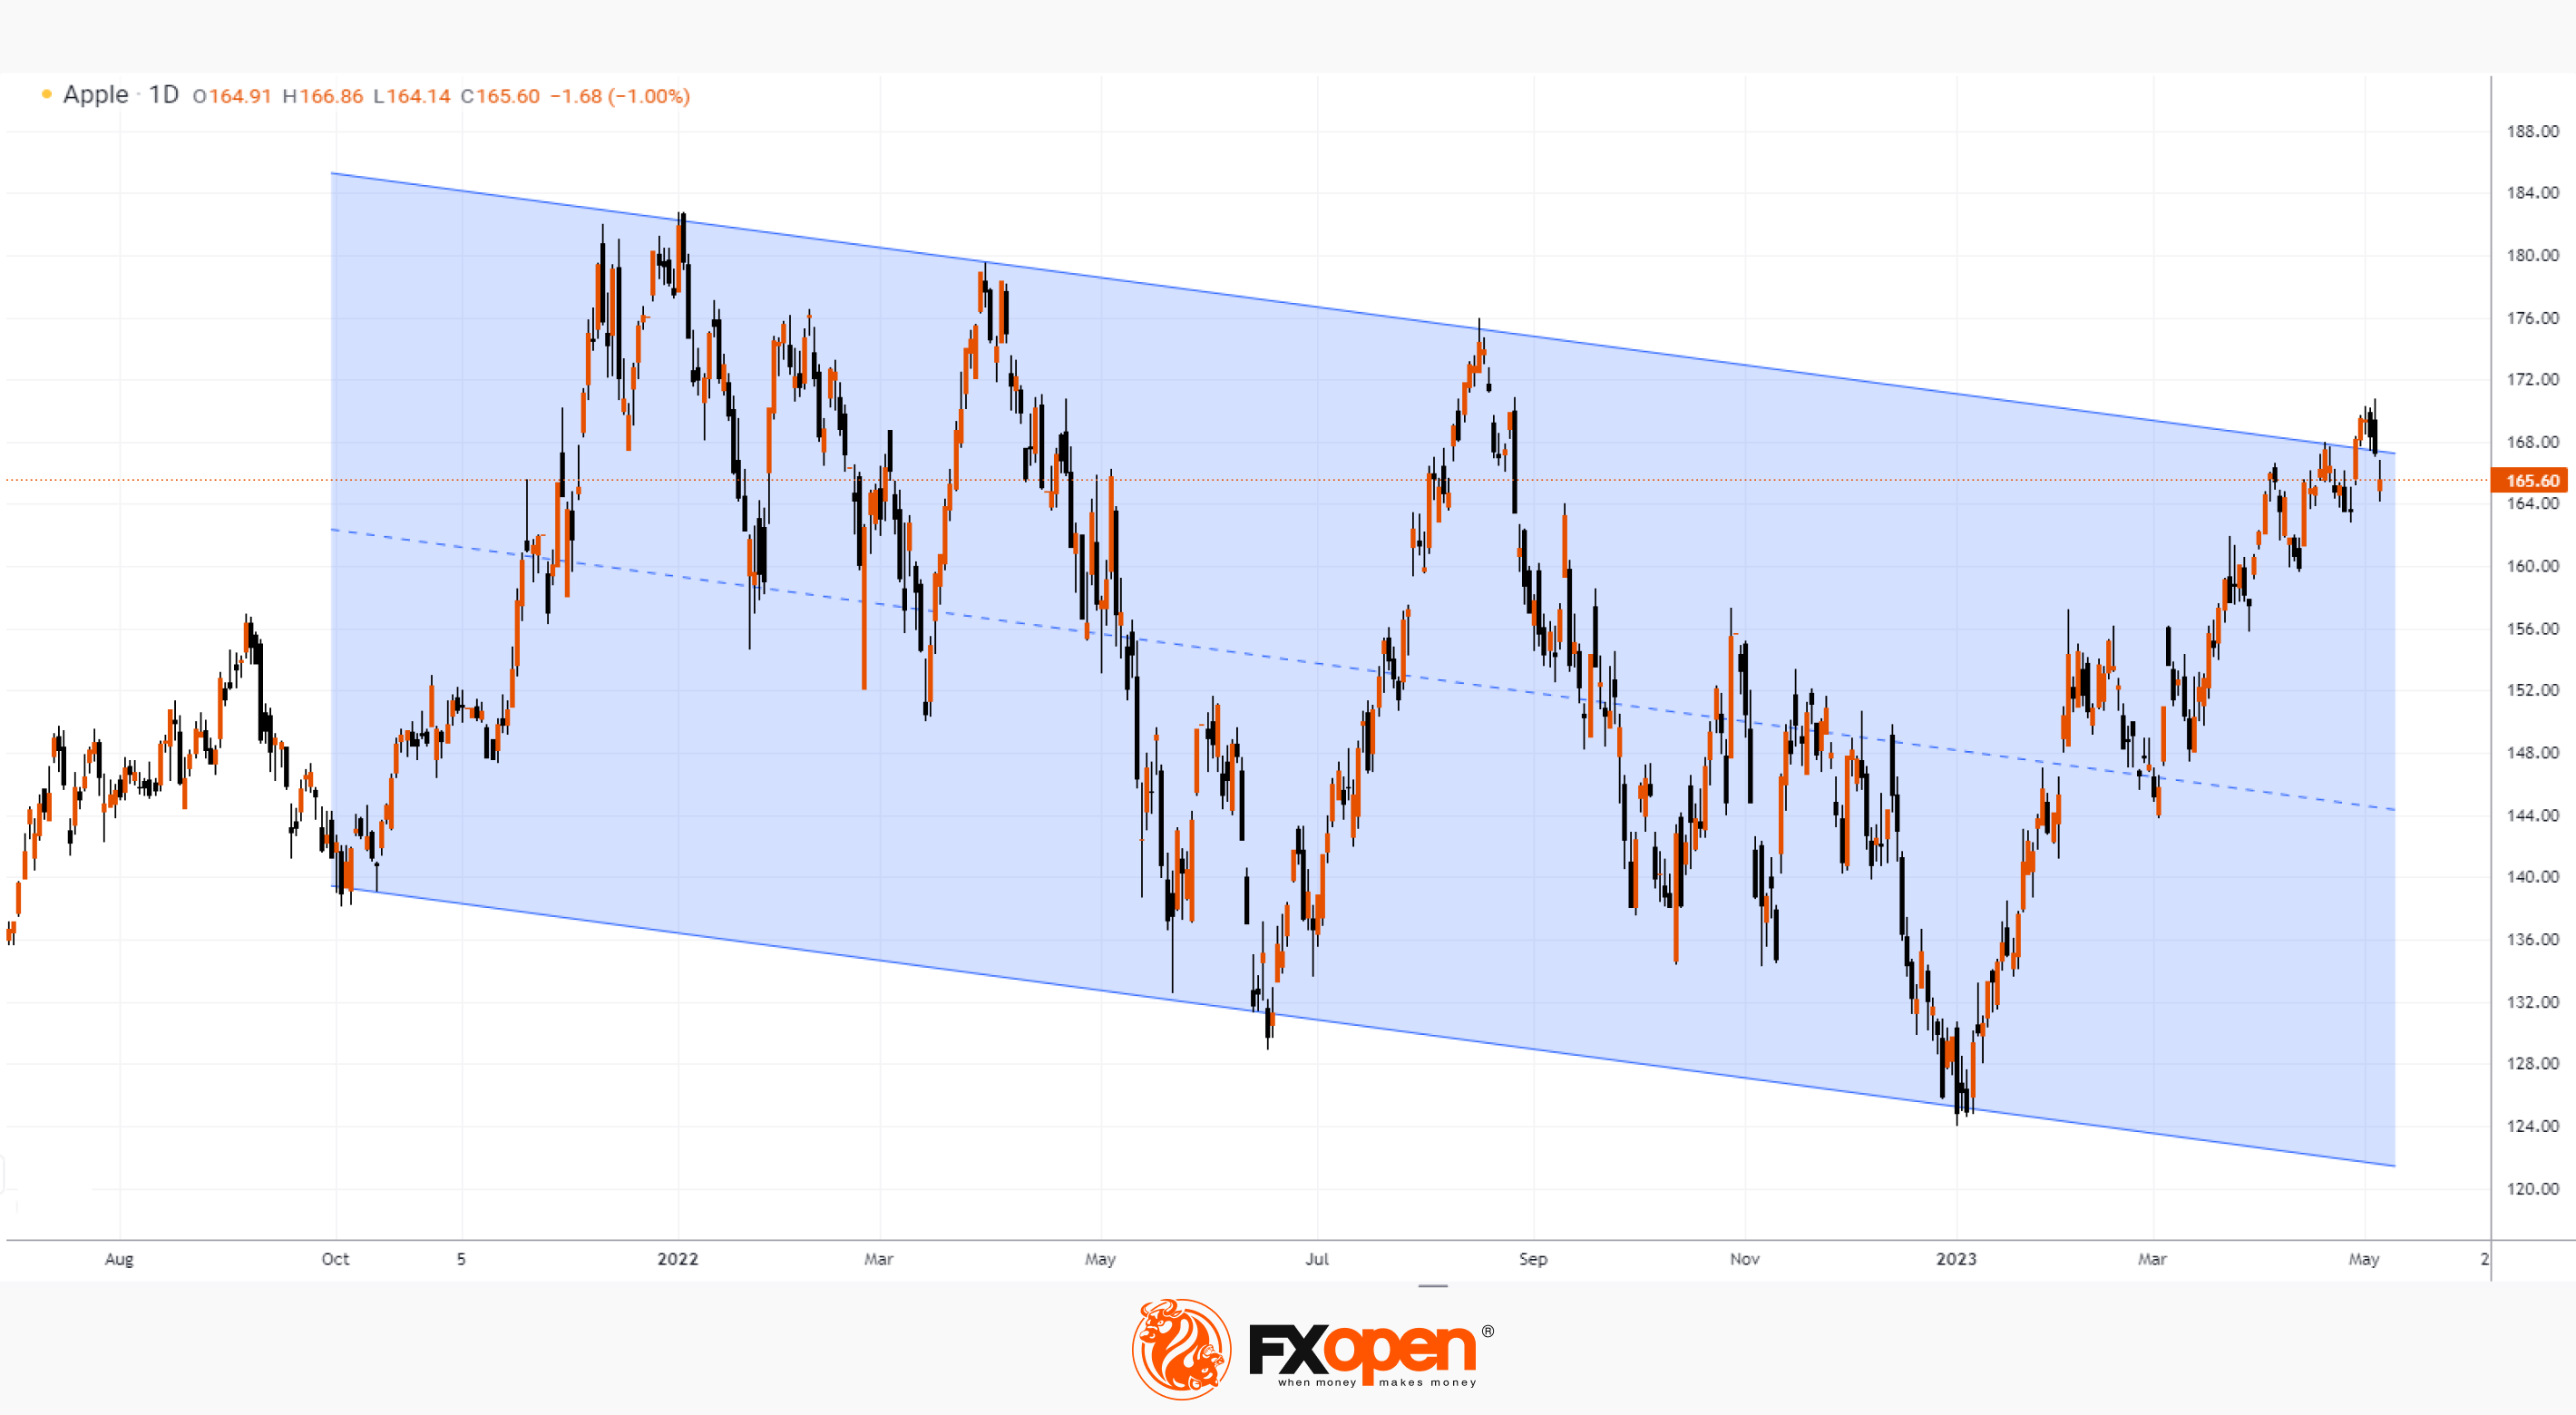
Thus, even today, the price of AAPL shares can renew the maximum since the beginning of the year, and also try to gain a foothold above the upper limit of the long-term channel (shown in blue), which technically gives a signal to buy AAPL shares. On the emotional side, AAPL looks like a market leader and a sound investment.
However, opening a long position could turn out to be a hasty decision if stock markets decline amid the growing threat of the US national debt ceiling. At the same time, a false bullish channel breakdown pattern may form on the chart.
According to a poll of analysts by the WSJ, the average price forecast for an Apple share is USD 180 for the coming year.
To take advantage of trends in the stock markets of the world's most famous companies, consider enlisting the services of a reliable broker like FXOpen.
⚠️
CFDs are complex instruments and come with a high risk of losing your money.
This article represents the opinion of the Companies operating under the FXOpen brand only. It is not to be construed as an offer, solicitation, or recommendation with respect to products and services provided by the Companies operating under the FXOpen brand, nor is it to be considered financial advice.
STRONG REPORT BRINGS AAPL CLOSER TO YEAR'S HIGH
According to the report of AAPL's activities for the Q1:
→ iPhone revenue: $51.3 billion (+2% yoy);
→ the revenue from services: $20.9 billion (+6% yoy);
→ the company is launching a buyback worth up to USD 90 billion in the next 12 months;
→ the company increases its dividend by 4% to 24 cents per share.
Although sales of iPads and computers fell, rising sales of iPhones (which account for more than half of the company's revenue) caused AAPL to rise 2.5% in premarket prices. At the opening of today's trading session, the price could be around USD 170 per share.
Thus, even today, the price of AAPL shares can renew the maximum since the beginning of the year, and also try to gain a foothold above the upper limit of the long-term channel (shown in blue), which technically gives a signal to buy AAPL shares. On the emotional side, AAPL looks like a market leader and a sound investment.
However, opening a long position could turn out to be a hasty decision if stock markets decline amid the growing threat of the US national debt ceiling. At the same time, a false bullish channel breakdown pattern may form on the chart.
According to a poll of analysts by the WSJ, the average price forecast for an Apple share is USD 180 for the coming year.
To take advantage of trends in the stock markets of the world's most famous companies, consider enlisting the services of a reliable broker like FXOpen.
⚠️
CFDs are complex instruments and come with a high risk of losing your money.
This article represents the opinion of the Companies operating under the FXOpen brand only. It is not to be construed as an offer, solicitation, or recommendation with respect to products and services provided by the Companies operating under the FXOpen brand, nor is it to be considered financial advice.
#MarketNews #oilprices
Oil Falls for the Third Week in a Row
From the peaks of April, the price of Brent crude oil in dollars fell by about 15%. According to Bloomberg, this is due to concerns about a slowdown in global economic growth.
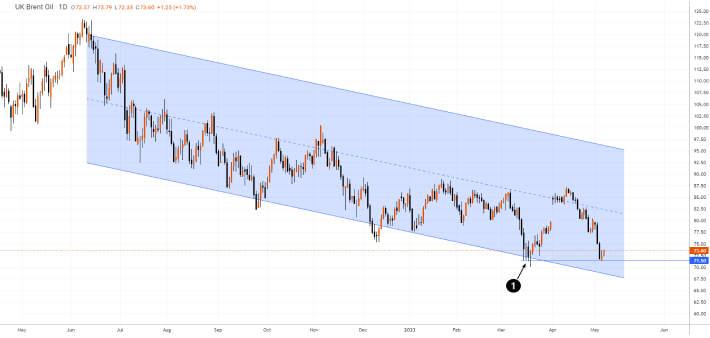
At the same time, the price of oil approached the lows of the year (1), from which there was a powerful rise against the backdrop of the OPEC+ decision to cut production. Therefore, traders assume that the price will not decline further.
This is supported by publications in the media:
→ Russia’s Deputy Prime Minister Alexander Novak reminded that Russia is reducing oil production by 500k barrels per day from the level of February 2023.
→ According to Bloomberg, with a further decline in oil prices, Saudi Arabia will not be able to balance its budget.
→ According to UBS analysts, a resumption of growth in oil prices is expected as OPEC+ cuts production.
The motives of oil producers will support the price of oil, which is still moving within the descending channel starting in 2022, as the daily Brent crude oil chart shows today.
To take advantage of trends in the commodity markets, consider enlisting the services of a reliable broker like FXOpen.
⚠️
CFDs are complex instruments and come with a high risk of losing your money.
This article represents the opinion of the Companies operating under the FXOpen brand only. It is not to be construed as an offer, solicitation, or recommendation with respect to products and services provided by the Companies operating under the FXOpen brand, nor is it to be considered financial advice.
Oil Falls for the Third Week in a Row
From the peaks of April, the price of Brent crude oil in dollars fell by about 15%. According to Bloomberg, this is due to concerns about a slowdown in global economic growth.
At the same time, the price of oil approached the lows of the year (1), from which there was a powerful rise against the backdrop of the OPEC+ decision to cut production. Therefore, traders assume that the price will not decline further.
This is supported by publications in the media:
→ Russia’s Deputy Prime Minister Alexander Novak reminded that Russia is reducing oil production by 500k barrels per day from the level of February 2023.
→ According to Bloomberg, with a further decline in oil prices, Saudi Arabia will not be able to balance its budget.
→ According to UBS analysts, a resumption of growth in oil prices is expected as OPEC+ cuts production.
The motives of oil producers will support the price of oil, which is still moving within the descending channel starting in 2022, as the daily Brent crude oil chart shows today.
To take advantage of trends in the commodity markets, consider enlisting the services of a reliable broker like FXOpen.
⚠️
CFDs are complex instruments and come with a high risk of losing your money.
This article represents the opinion of the Companies operating under the FXOpen brand only. It is not to be construed as an offer, solicitation, or recommendation with respect to products and services provided by the Companies operating under the FXOpen brand, nor is it to be considered financial advice.
#MarketNews #forex
In Forex, GBP/USD Reaches a New High Since the Beginning of the Year
Today, the British pound has updated its maximum since the beginning of the year. Here are the factors that contributed to this:
→ weakness of the US dollar due to the threat of default. The FT relays Yellen's words that the US Treasury Department's ability to bypass the default is running out;
→ the US dollar's weakness due to the banking crisis. According to media reports, 722 US banks have unrealized losses of more than 50% of capital;
→ the upcoming meeting of the Bank of England (Thursday, at 14:00 GMT+3). A rate increase is expected, which may not be the last.
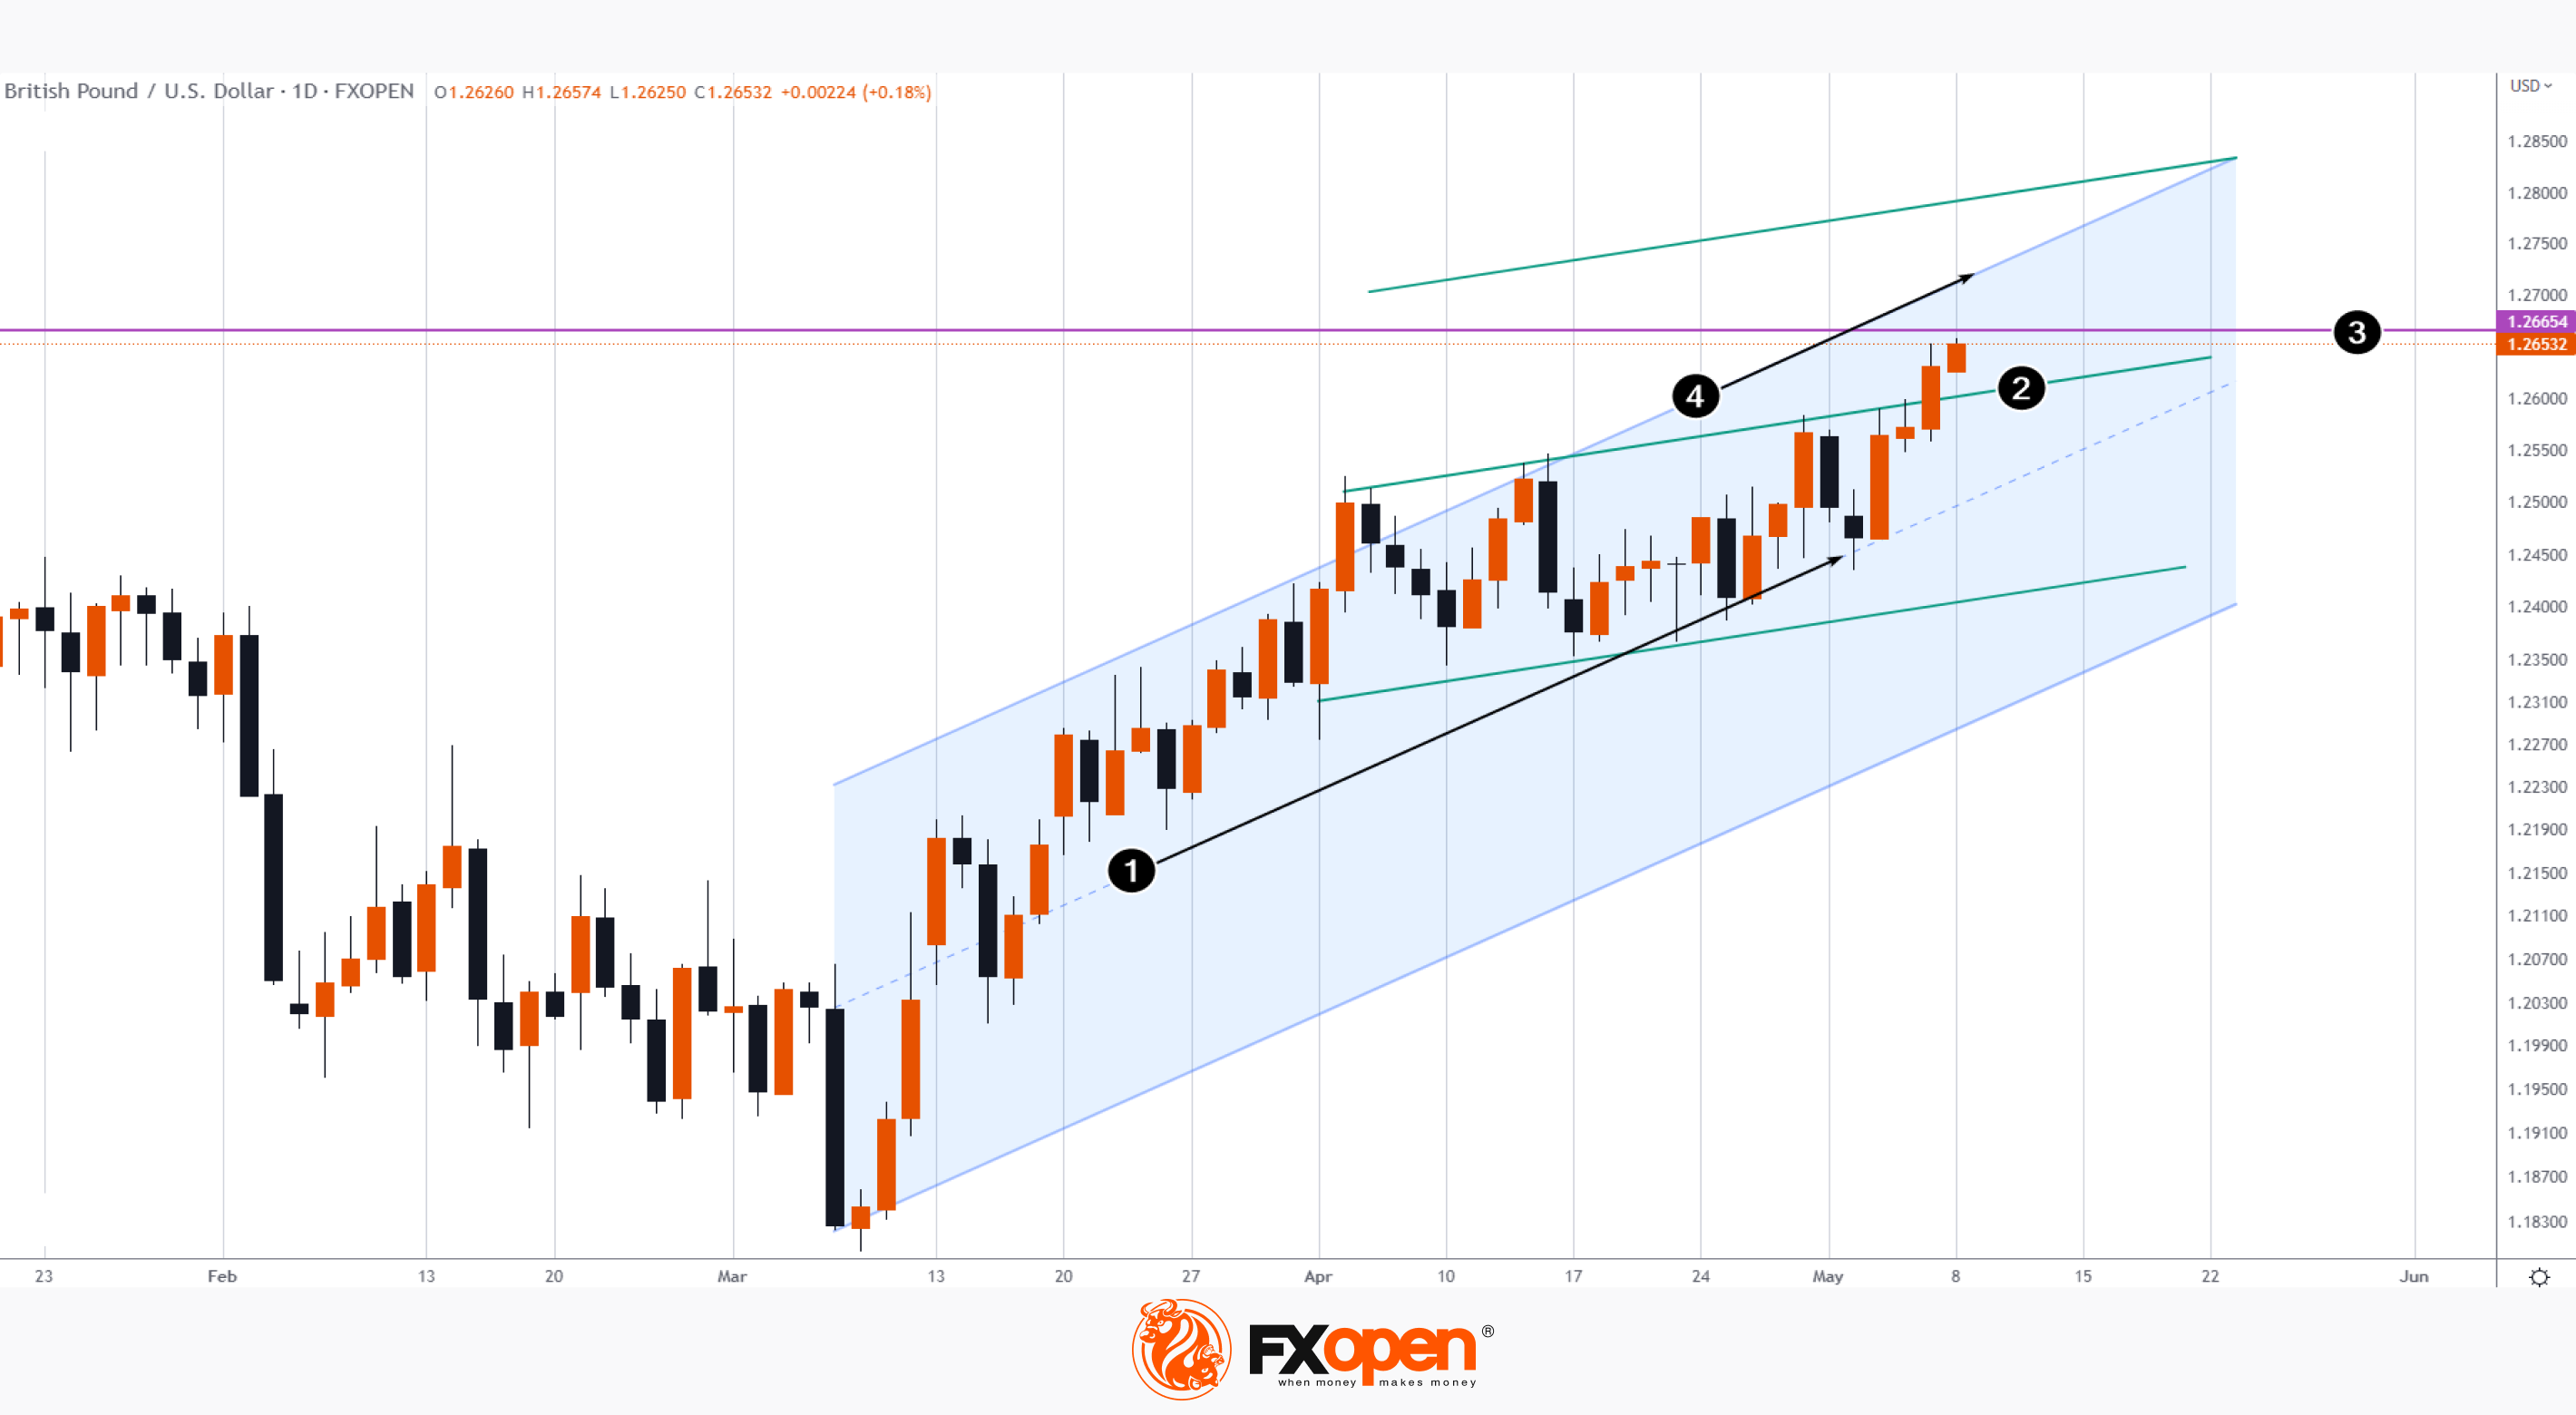
Technical analysis of the GBP/USD chart indicates that:
→ the median line of the growing channel (1) supports the market;
→ the rate has overcome the line (2), which offered resistance in April. Now the price can test this line from above;
→ the price is near the level of 1.2666 - this is an important peak on the GBP/USD forex chart in May 2022;
→ if the bullish trend strengthens, the price may reach the upper limit (4) of the ascending channel (shown in blue).
Check the live GBP/USD forex chart on the TickTrader platform from a reliable broker FXOpen.
⚠️
CFDs are complex instruments and come with a high risk of losing your money.
This article represents the opinion of the Companies operating under the FXOpen brand only. It is not to be construed as an offer, solicitation, or recommendation with respect to products and services provided by the Companies operating under the FXOpen brand, nor is it to be considered financial advice.
In Forex, GBP/USD Reaches a New High Since the Beginning of the Year
Today, the British pound has updated its maximum since the beginning of the year. Here are the factors that contributed to this:
→ weakness of the US dollar due to the threat of default. The FT relays Yellen's words that the US Treasury Department's ability to bypass the default is running out;
→ the US dollar's weakness due to the banking crisis. According to media reports, 722 US banks have unrealized losses of more than 50% of capital;
→ the upcoming meeting of the Bank of England (Thursday, at 14:00 GMT+3). A rate increase is expected, which may not be the last.
Technical analysis of the GBP/USD chart indicates that:
→ the median line of the growing channel (1) supports the market;
→ the rate has overcome the line (2), which offered resistance in April. Now the price can test this line from above;
→ the price is near the level of 1.2666 - this is an important peak on the GBP/USD forex chart in May 2022;
→ if the bullish trend strengthens, the price may reach the upper limit (4) of the ascending channel (shown in blue).
Check the live GBP/USD forex chart on the TickTrader platform from a reliable broker FXOpen.
⚠️
CFDs are complex instruments and come with a high risk of losing your money.
This article represents the opinion of the Companies operating under the FXOpen brand only. It is not to be construed as an offer, solicitation, or recommendation with respect to products and services provided by the Companies operating under the FXOpen brand, nor is it to be considered financial advice.
#MarketNews #bitcoin #BTCUSD
BTC/USD: Important Support Under Threat
On May 7, Binance, the largest cryptocurrency exchange, suspended the withdrawal of bitcoins twice due to a heavy load on the network, which may be associated with a surge in traders' interest in new meme coins. This, in turn, caused bitcoin transaction fees to reach their highest level in two years. Fortunately, bitcoin operations on Binance were restored, but the unfortunate incident had a negative impact on the price of bitcoin.
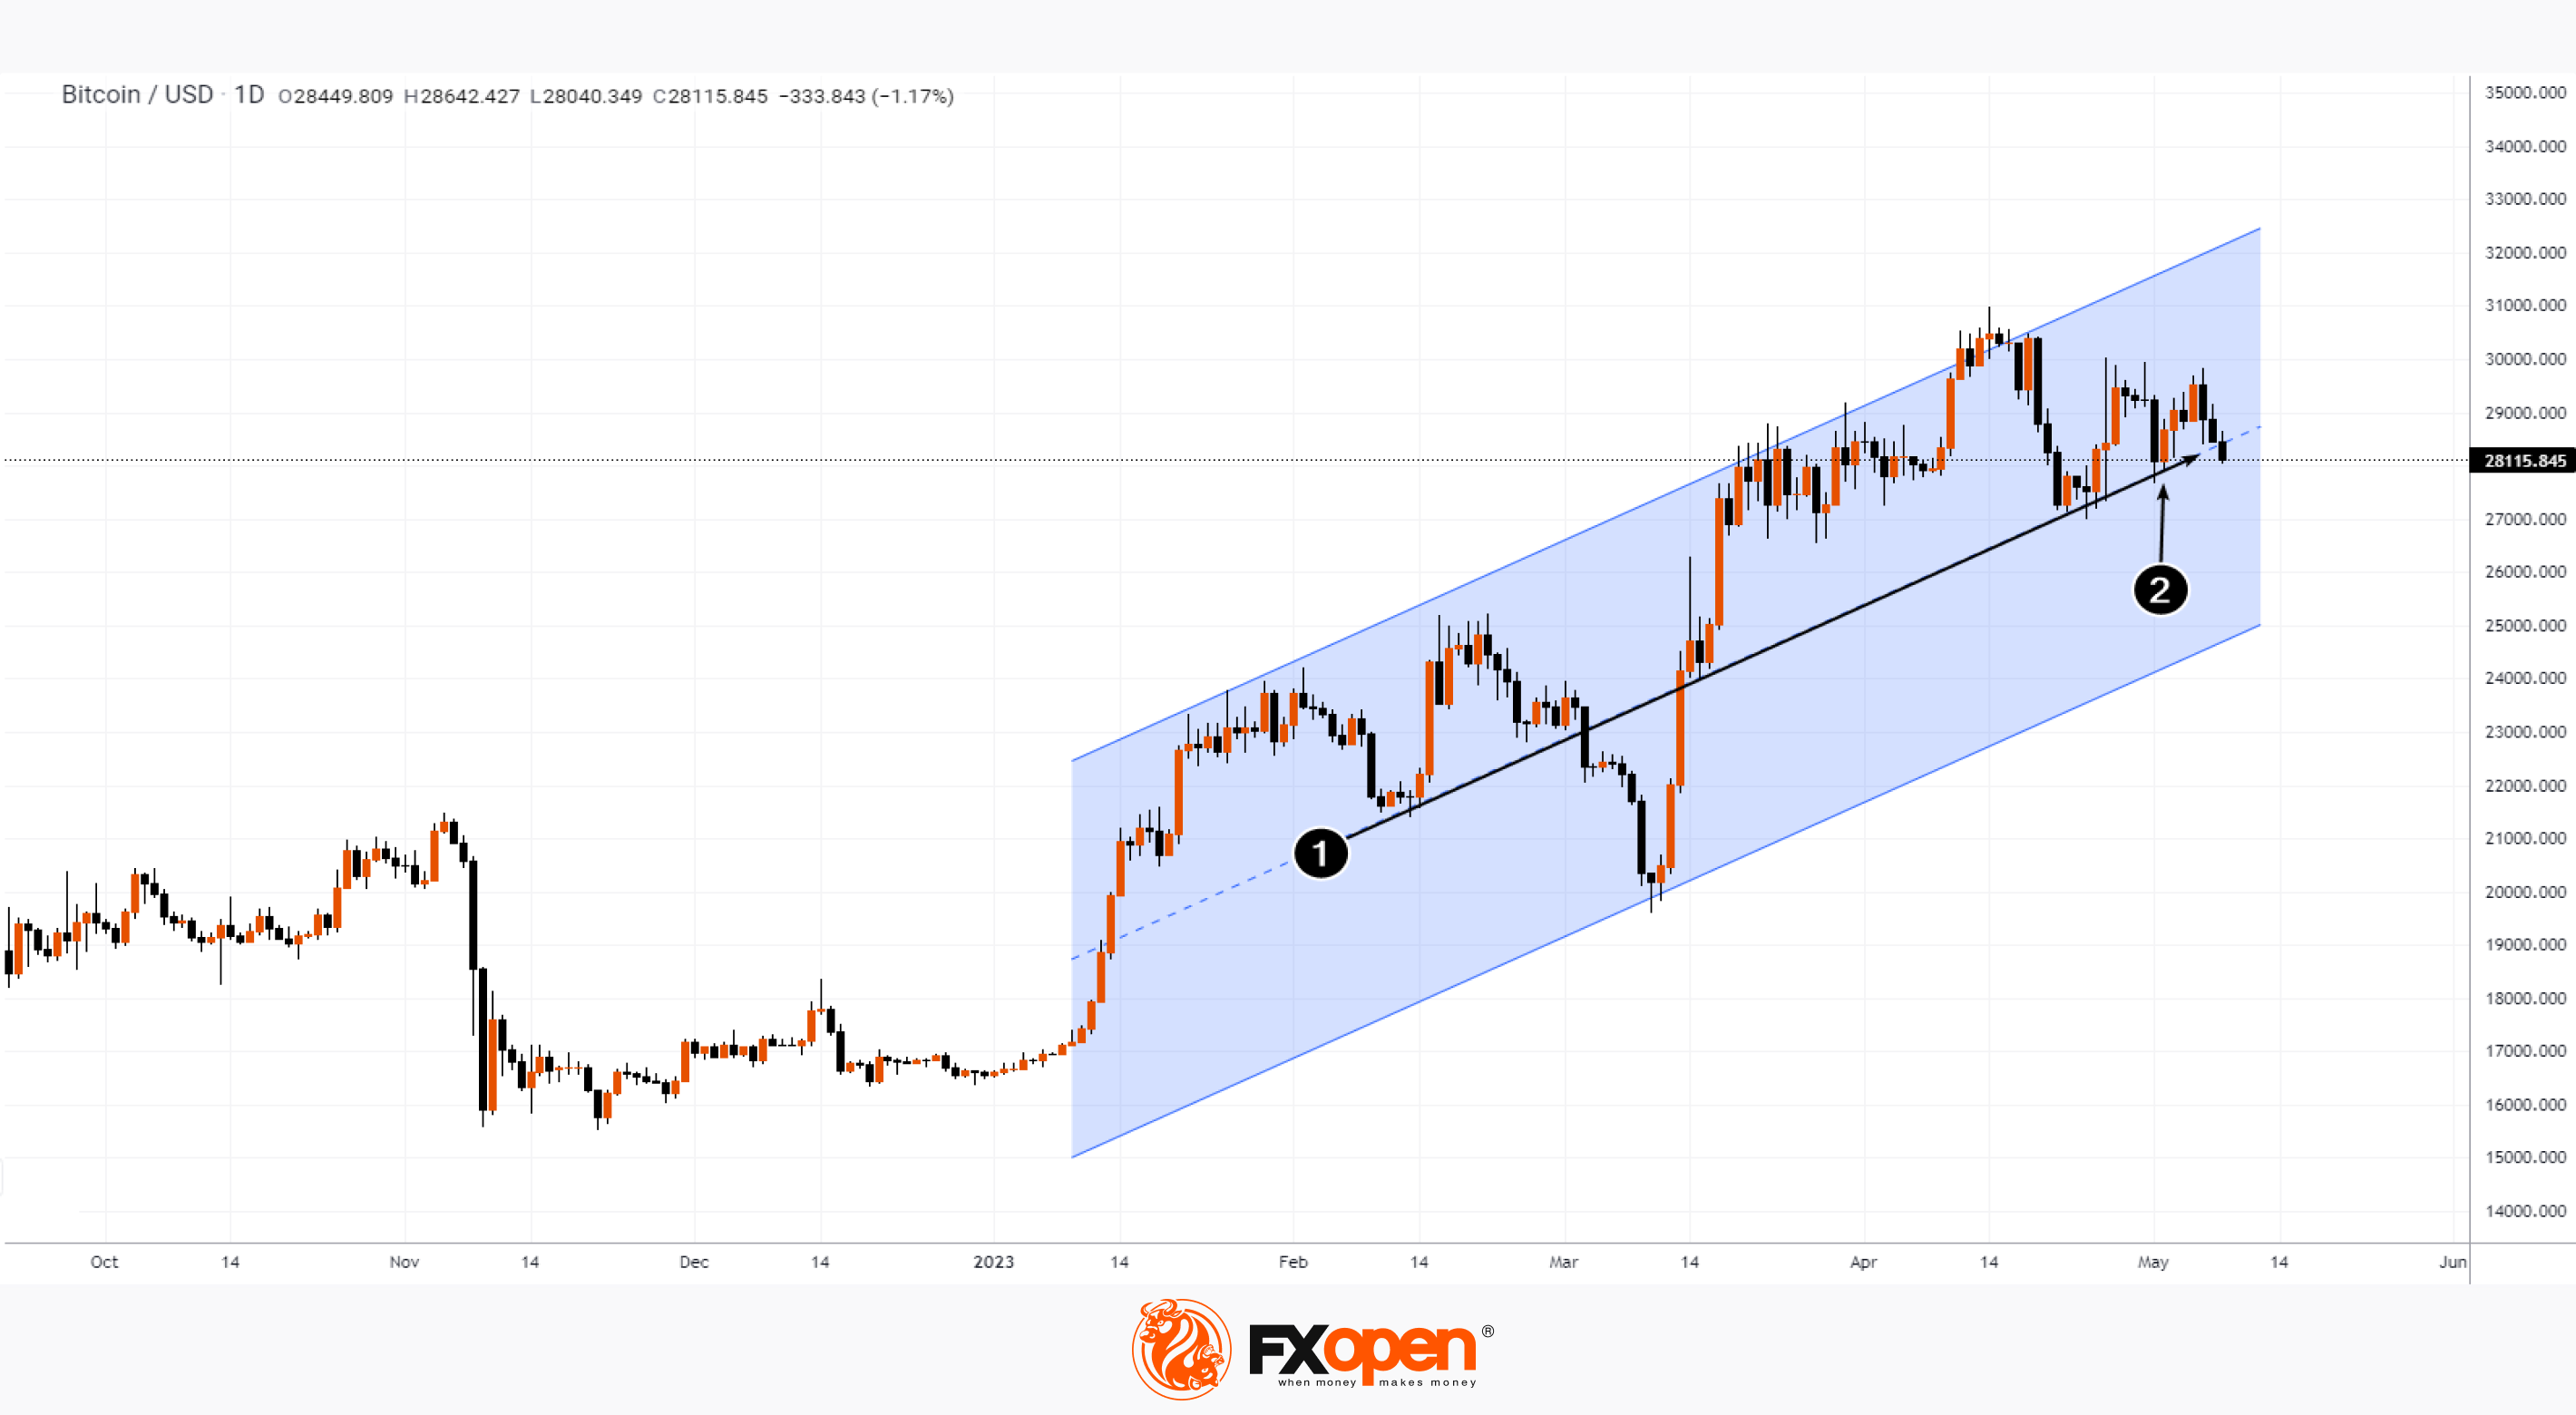
The bitcoin chart shows that the current price of bitcoin in USD is near an important support line (1) — this is the median line of the ascending channel, which has been in effect since the beginning of the year. Bitcoin price rebounded (2) from this line in early May. However, the bulls failed to reach the psychological level of USD 30k (a sign of weak demand), and today bitcoin is forming the third bearish candle in a row. Because of this, a bearish breakdown of this line may form in the near future.
Check the live BTC/USD forex chart on the TickTrader platform from a reliable broker FXOpen.
⚠️
CFDs are complex instruments and come with a high risk of losing your money.
This article represents the opinion of the Companies operating under the FXOpen brand only. It is not to be construed as an offer, solicitation, or recommendation with respect to products and services provided by the Companies operating under the FXOpen brand, nor is it to be considered financial advice.
At FXOpen UK and FXOpen AU, Cryptocurrency CFDs are only available for trading by those clients categorised as Professional clients under FCA Rules and Professional clients under ASIC Rules, respectively. They are not available for trading by Retail clients.
BTC/USD: Important Support Under Threat
On May 7, Binance, the largest cryptocurrency exchange, suspended the withdrawal of bitcoins twice due to a heavy load on the network, which may be associated with a surge in traders' interest in new meme coins. This, in turn, caused bitcoin transaction fees to reach their highest level in two years. Fortunately, bitcoin operations on Binance were restored, but the unfortunate incident had a negative impact on the price of bitcoin.
The bitcoin chart shows that the current price of bitcoin in USD is near an important support line (1) — this is the median line of the ascending channel, which has been in effect since the beginning of the year. Bitcoin price rebounded (2) from this line in early May. However, the bulls failed to reach the psychological level of USD 30k (a sign of weak demand), and today bitcoin is forming the third bearish candle in a row. Because of this, a bearish breakdown of this line may form in the near future.
Check the live BTC/USD forex chart on the TickTrader platform from a reliable broker FXOpen.
⚠️
CFDs are complex instruments and come with a high risk of losing your money.
This article represents the opinion of the Companies operating under the FXOpen brand only. It is not to be construed as an offer, solicitation, or recommendation with respect to products and services provided by the Companies operating under the FXOpen brand, nor is it to be considered financial advice.
At FXOpen UK and FXOpen AU, Cryptocurrency CFDs are only available for trading by those clients categorised as Professional clients under FCA Rules and Professional clients under ASIC Rules, respectively. They are not available for trading by Retail clients.
#MarketNews #bitcoin
BTCUSD Analysis: Three Black Crows Pattern below $29,829
Bitcoin was unable to continue its bullish momentum from last week, and after touching a high of $29,829 on May 06, we can see a continuous decline in the bitcoin price, with immediate targets located in the range of $26500 and $27000.
https://cutt.ly/96stEWW
To take advantage of price fluctuations in the foreign exchange markets, consider enlisting the services of a reliable broker like FXOpen.
⚠️
This forecast represents FXOpen Companies opinion only, it should not be construed as an offer, invitation or recommendation in respect to FXOpen Companies products and services or as financial advice
At FXOpen UK and FXOpen AU, Cryptocurrency CFDs are only available for trading by those clients categorised as Professional clients under FCA Rules and Professional clients under ASIC Rules respectively. They are not available for trading by Retail clients.
BTCUSD Analysis: Three Black Crows Pattern below $29,829
Bitcoin was unable to continue its bullish momentum from last week, and after touching a high of $29,829 on May 06, we can see a continuous decline in the bitcoin price, with immediate targets located in the range of $26500 and $27000.
https://cutt.ly/96stEWW
To take advantage of price fluctuations in the foreign exchange markets, consider enlisting the services of a reliable broker like FXOpen.
⚠️
This forecast represents FXOpen Companies opinion only, it should not be construed as an offer, invitation or recommendation in respect to FXOpen Companies products and services or as financial advice
At FXOpen UK and FXOpen AU, Cryptocurrency CFDs are only available for trading by those clients categorised as Professional clients under FCA Rules and Professional clients under ASIC Rules respectively. They are not available for trading by Retail clients.
Market Pulse
BTCUSD Analysis: Three Black Crows Pattern below $29,829
Bitcoin was unable to continue its bullish momentum from last week, and after touching a high of $29,829 on May 06, we can see a continuous decline in the bitcoin price, with immediate targets located in the range of $26500 and $27000. We can clearly see…
#MarketNews #XRPUSD #ripple
XRPUSD Analysis: Bearish Doji Star Pattern below $0.4706
Ripple was unable to continue its bullish momentum from last week, and after touching a high of $0.4706 on May 05, we can see a continuous decline in the Ripple price, with immediate targets located in the range of $0.4000 and $0.3800.
https://cutt.ly/I6sutdS
To take advantage of price fluctuations in the foreign exchange markets, consider enlisting the services of a reliable broker like FXOpen.
⚠️
This forecast represents FXOpen Companies opinion only, it should not be construed as an offer, invitation or recommendation in respect to FXOpen Companies products and services or as financial advice.
At FXOpen UK and FXOpen AU, Cryptocurrency CFDs are only available for trading by those clients categorised as Professional clients under FCA Rules and Professional clients under ASIC Rules respectively. They are not available for trading by Retail clients.
XRPUSD Analysis: Bearish Doji Star Pattern below $0.4706
Ripple was unable to continue its bullish momentum from last week, and after touching a high of $0.4706 on May 05, we can see a continuous decline in the Ripple price, with immediate targets located in the range of $0.4000 and $0.3800.
https://cutt.ly/I6sutdS
To take advantage of price fluctuations in the foreign exchange markets, consider enlisting the services of a reliable broker like FXOpen.
⚠️
This forecast represents FXOpen Companies opinion only, it should not be construed as an offer, invitation or recommendation in respect to FXOpen Companies products and services or as financial advice.
At FXOpen UK and FXOpen AU, Cryptocurrency CFDs are only available for trading by those clients categorised as Professional clients under FCA Rules and Professional clients under ASIC Rules respectively. They are not available for trading by Retail clients.
Market Pulse
XRPUSD Analysis: Bearish Doji Star Pattern below $0.4706
Ripple was unable to continue its bullish momentum from last week, and after touching a high of $0.4706 on May 05, we can see a continuous decline in the Ripple price, with immediate targets located in the range of $0.4000 and $0.3800. On the hourly chart:…
TickTrader Challenge. Join and will up to USD120
FXOpen announces a new competition for FXOpen forum participants, open to clients of FXOpen International (FXOpen Markets Limited),
TickTrader Challenge: Battle of the Best.
https://www.forex.game/announcements/ticktrader-challenge-join-and-wil-up-to-usd120/
FXOpen announces a new competition for FXOpen forum participants, open to clients of FXOpen International (FXOpen Markets Limited),
TickTrader Challenge: Battle of the Best.
https://www.forex.game/announcements/ticktrader-challenge-join-and-wil-up-to-usd120/
#MarketNews #stocks
Buffett's Words and the Reaction of BRK.B Shares
At the weekend, another meeting of shareholders of Berkshire Hathaway was held, which was hosted by 92-year-old Warren Buffett and his partner, 99-year-old Charlie Munger. The duo fielded questions for 6 hours. Here are the key messages of the legendary investors:
→ AI can change everything in the world, but it won't tell you which stocks to buy.
→ Problems in the banking sector may continue.
→ The US dollar will not lose the status of the world's reserve currency, even amid fears related to public debt. Cryptocurrencies as a reserve currency is crazy and a hoax.
→ The US should not be in conflict with China, but trade.
→ In 2023, the US economy is likely to slow down.
→ The main rule of investing is to avoid mistakes.
Shareholders also learned about the results of the company's activities for Q1:
→ profit increased by +12% in annual terms;
→ companies sold more shares than they bought – that is, “Buffett turned to cash”;
→ the company increased the buyback.
Against the backdrop of news from the shareholders' meeting, BRK.B shares started the current week positively — a bullish gap formed on the chart of Berkshire Hathaway B shares, the price of BRK.B shares approached the highs of the year. However, on Tuesday, there was already less positivity. It is possible that BRK.B shares will fall in price along with the rest of the stock market amid fears related to public debt. President Biden is even said to be postponing his trip to the G7 summit. According to Secretary of the Treasury Janet Yellen, there is less and less room to solve the problem of default.
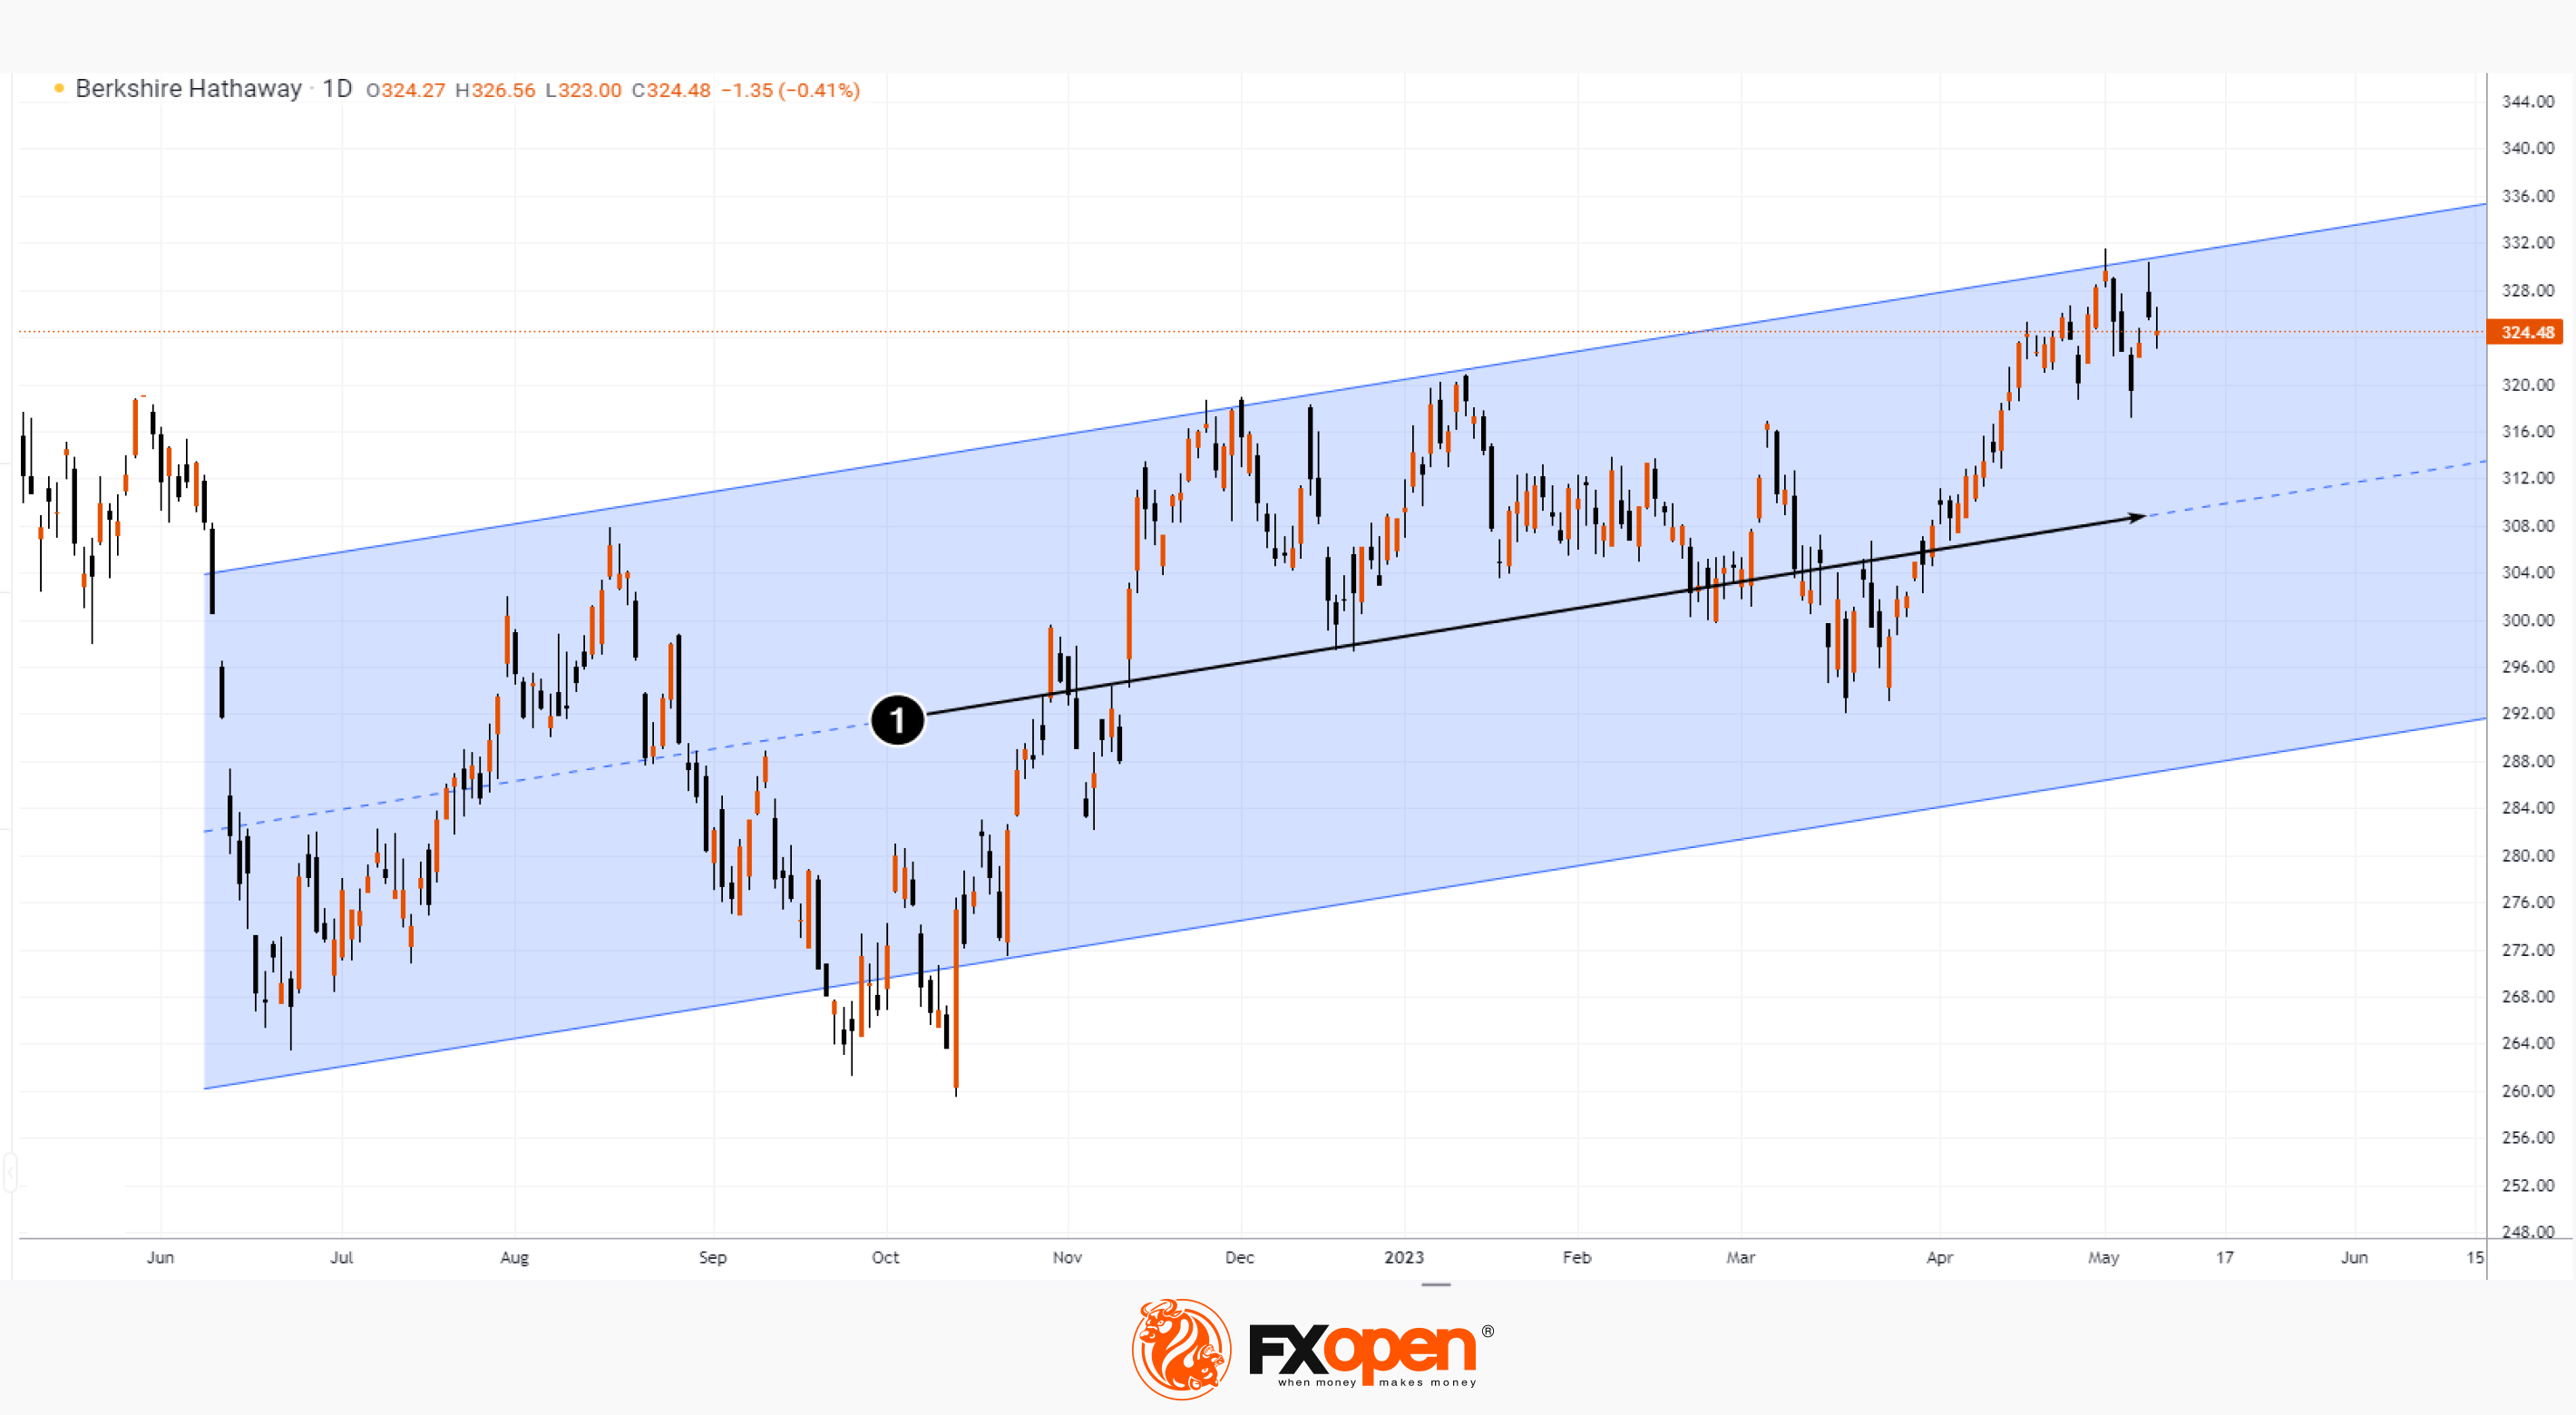
It is possible that the price of BRK.B shares will test the support line (1). According to the average opinion of analysts polled by the WSJ, the price of Berkshire Hathaway B shares can remain at current levels for a long time. Note that after 2008, the value of Berkshire Hathaway B shares does not have a significant advantage relative to the S&P 500 stock index, as it has been since the early 1980s.
To take advantage of fluctuations in the prices of shares of the world's leading companies, consider enlisting the services of a reliable broker like FXOpen.
⚠️
CFDs are complex instruments and come with a high risk of losing your money.
This article represents the opinion of the Companies operating under the FXOpen brand only. It is not to be construed as an offer, solicitation, or recommendation with respect to products and services provided by the Companies operating under the FXOpen brand, nor is it to be considered financial advice.
At FXOpen UK and FXOpen AU, Cryptocurrency CFDs are only available for trading by those clients categorised as Professional clients under FCA Rules and Professional clients under ASIC Rules, respectively. They are not available for trading by Retail clients.
Buffett's Words and the Reaction of BRK.B Shares
At the weekend, another meeting of shareholders of Berkshire Hathaway was held, which was hosted by 92-year-old Warren Buffett and his partner, 99-year-old Charlie Munger. The duo fielded questions for 6 hours. Here are the key messages of the legendary investors:
→ AI can change everything in the world, but it won't tell you which stocks to buy.
→ Problems in the banking sector may continue.
→ The US dollar will not lose the status of the world's reserve currency, even amid fears related to public debt. Cryptocurrencies as a reserve currency is crazy and a hoax.
→ The US should not be in conflict with China, but trade.
→ In 2023, the US economy is likely to slow down.
→ The main rule of investing is to avoid mistakes.
Shareholders also learned about the results of the company's activities for Q1:
→ profit increased by +12% in annual terms;
→ companies sold more shares than they bought – that is, “Buffett turned to cash”;
→ the company increased the buyback.
Against the backdrop of news from the shareholders' meeting, BRK.B shares started the current week positively — a bullish gap formed on the chart of Berkshire Hathaway B shares, the price of BRK.B shares approached the highs of the year. However, on Tuesday, there was already less positivity. It is possible that BRK.B shares will fall in price along with the rest of the stock market amid fears related to public debt. President Biden is even said to be postponing his trip to the G7 summit. According to Secretary of the Treasury Janet Yellen, there is less and less room to solve the problem of default.
It is possible that the price of BRK.B shares will test the support line (1). According to the average opinion of analysts polled by the WSJ, the price of Berkshire Hathaway B shares can remain at current levels for a long time. Note that after 2008, the value of Berkshire Hathaway B shares does not have a significant advantage relative to the S&P 500 stock index, as it has been since the early 1980s.
To take advantage of fluctuations in the prices of shares of the world's leading companies, consider enlisting the services of a reliable broker like FXOpen.
⚠️
CFDs are complex instruments and come with a high risk of losing your money.
This article represents the opinion of the Companies operating under the FXOpen brand only. It is not to be construed as an offer, solicitation, or recommendation with respect to products and services provided by the Companies operating under the FXOpen brand, nor is it to be considered financial advice.
At FXOpen UK and FXOpen AU, Cryptocurrency CFDs are only available for trading by those clients categorised as Professional clients under FCA Rules and Professional clients under ASIC Rules, respectively. They are not available for trading by Retail clients.
#MarketNews #XRPUSD #ripple
Ripple: News, Token Price Analysis
At the Fintech Summit in Dubai, Ripple CEO Brad Garlinghouse revealed the amount that Ripple has spent to defend itself in a legal dispute with the US Securities and Exchange Commission (SEC). He said:
“With the SEC, [...] by the time all’s said and done, we will have spent $200 million defending ourselves against a lawsuit, which from its very beginning, people were like, well, this doesn’t make a lot of sense.”
According to Brad, attempts to regulate cryptocurrencies in the US have come to a standstill, and therefore Ripple is considering expanding in Dubai, where laws are loyal to cryptocurrencies.
On March 9, we assumed that the price of Ripple could show strong dynamics amid expectations of a resolution of the conflict with the SEC — and yes, on March 29, the price of the XRP token in USD set a maximum since the beginning of the year. However, the conflict remained unresolved, and the bitcoin market is showing signs of weakness around the psychological USD 30k mark.
Therefore, the price of the Ripple token has been in a downtrend since mid-April, having already broken through the support line (1). If the momentum continues, the value of the XRP token in USD may reach the lower limit of the price channel (shown in blue).
To check the live XRP/USD forex chart and take advantage of the rise and fall of cryptocurrencies, consider enlisting the services of a reliable broker like FXOpen.
⚠️
CFDs are complex instruments and come with a high risk of losing your money.
This article represents the opinion of the Companies operating under the FXOpen brand only. It is not to be construed as an offer, solicitation, or recommendation with respect to products and services provided by the Companies operating under the FXOpen brand, nor is it to be considered financial advice.
At FXOpen UK and FXOpen AU, Cryptocurrency CFDs are only available for trading by those clients categorised as Professional clients under FCA Rules and Professional clients under ASIC Rules, respectively. They are not available for trading by Retail clients.
Ripple: News, Token Price Analysis
At the Fintech Summit in Dubai, Ripple CEO Brad Garlinghouse revealed the amount that Ripple has spent to defend itself in a legal dispute with the US Securities and Exchange Commission (SEC). He said:
“With the SEC, [...] by the time all’s said and done, we will have spent $200 million defending ourselves against a lawsuit, which from its very beginning, people were like, well, this doesn’t make a lot of sense.”
According to Brad, attempts to regulate cryptocurrencies in the US have come to a standstill, and therefore Ripple is considering expanding in Dubai, where laws are loyal to cryptocurrencies.
On March 9, we assumed that the price of Ripple could show strong dynamics amid expectations of a resolution of the conflict with the SEC — and yes, on March 29, the price of the XRP token in USD set a maximum since the beginning of the year. However, the conflict remained unresolved, and the bitcoin market is showing signs of weakness around the psychological USD 30k mark.
Therefore, the price of the Ripple token has been in a downtrend since mid-April, having already broken through the support line (1). If the momentum continues, the value of the XRP token in USD may reach the lower limit of the price channel (shown in blue).
To check the live XRP/USD forex chart and take advantage of the rise and fall of cryptocurrencies, consider enlisting the services of a reliable broker like FXOpen.
⚠️
CFDs are complex instruments and come with a high risk of losing your money.
This article represents the opinion of the Companies operating under the FXOpen brand only. It is not to be construed as an offer, solicitation, or recommendation with respect to products and services provided by the Companies operating under the FXOpen brand, nor is it to be considered financial advice.
At FXOpen UK and FXOpen AU, Cryptocurrency CFDs are only available for trading by those clients categorised as Professional clients under FCA Rules and Professional clients under ASIC Rules, respectively. They are not available for trading by Retail clients.

#MarketNews #amzn #stockmarket
AMZN Analysis: Will Amazon hit last month’s highs again in May?
Amazon stock has been considerably volatile recently, something that is relatively rare for large-cap stocks listed on premium North American exchanges.
One of the main reasons for their overt popularity among so many people with differing means and expectations is their relative stability compared with companies with less stringent governance and less of a portfolio of shareholders who demand a conservative corporate path.
Amazon stock has been climbing steadily over the past five days, registering a 2.86% increase during that period.
On April 27, Amazon stock rose suddenly, resulting in a spike at $109.82, before dropping back to $102.05 per share which is lower than its value five days previously, which was before said spike.
The period over the last two weeks may well appear to provide some excitement to Amazon investors, but it all started from a much lower point.
One month ago, Amazon stock was trading at less than $100 per share.
https://cutt.ly/o6hgFUr
To take advantage of price fluctuations in the foreign exchange markets, consider enlisting the services of a reliable broker like FXOpen.
⚠️
This forecast represents FXOpen Companies opinion only, it should not be construed as an offer, invitation or recommendation in respect to FXOpen Companies products and services or as financial advice
AMZN Analysis: Will Amazon hit last month’s highs again in May?
Amazon stock has been considerably volatile recently, something that is relatively rare for large-cap stocks listed on premium North American exchanges.
One of the main reasons for their overt popularity among so many people with differing means and expectations is their relative stability compared with companies with less stringent governance and less of a portfolio of shareholders who demand a conservative corporate path.
Amazon stock has been climbing steadily over the past five days, registering a 2.86% increase during that period.
On April 27, Amazon stock rose suddenly, resulting in a spike at $109.82, before dropping back to $102.05 per share which is lower than its value five days previously, which was before said spike.
The period over the last two weeks may well appear to provide some excitement to Amazon investors, but it all started from a much lower point.
One month ago, Amazon stock was trading at less than $100 per share.
https://cutt.ly/o6hgFUr
To take advantage of price fluctuations in the foreign exchange markets, consider enlisting the services of a reliable broker like FXOpen.
⚠️
This forecast represents FXOpen Companies opinion only, it should not be construed as an offer, invitation or recommendation in respect to FXOpen Companies products and services or as financial advice
Market Pulse
AMZN Analysis: Will Amazon hit last month’s highs again in May?
Amazon stock has been considerably volatile recently, something that is relatively rare for large-cap stocks listed on premium North American exchanges.
#MarketNews #stockmarket
S&P 500 Reacts Positively to Declining Inflation
Yesterday's news showed that the consumer price index fell to 4.9%. The last time inflation was below 5% was in May 2021. Thus, the Fed has received new evidence of success in its fight against rising prices, and market participants now expect that a halt will be made in a series of interest rate hikes.
The stock index reacted positively. As a result of yesterday, the price of the E-mini S&P 500 futures increased, and this morning it is growing towards yesterday's highs.
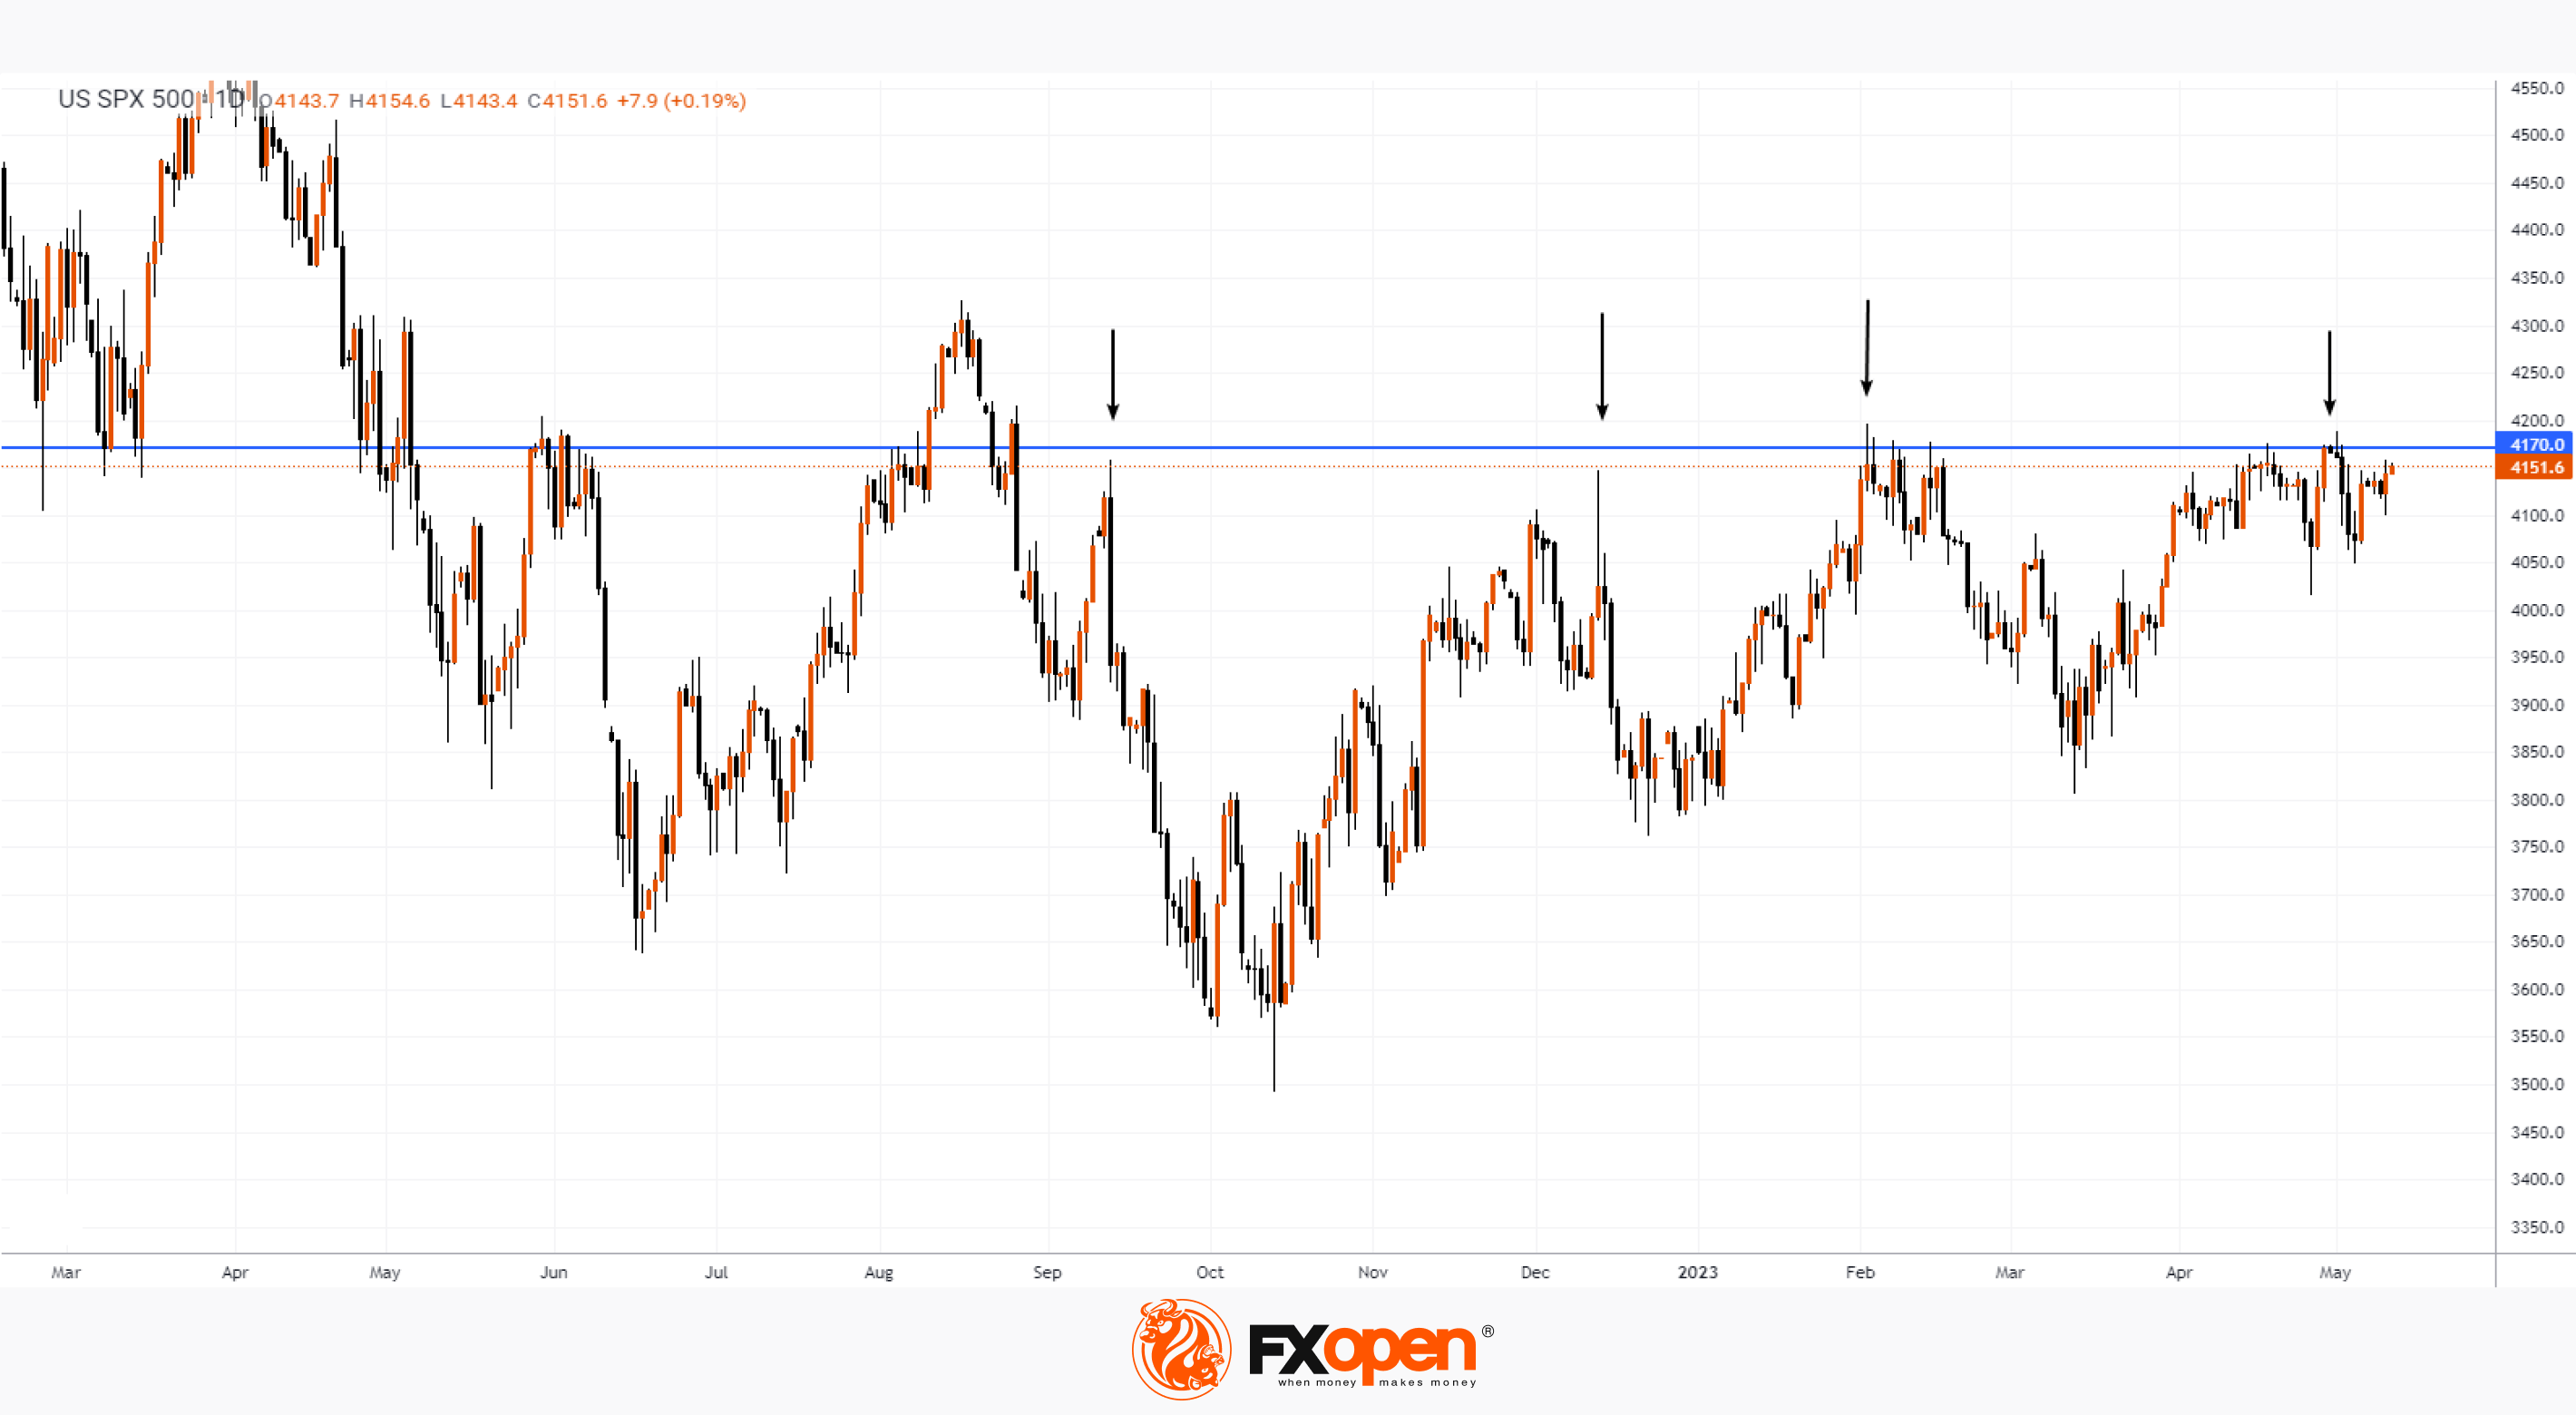
The E-mini S&P 500 futures chart also shows that the contract value is near the important resistance level of 4,170.
According to analysts at UBS Bank, the price will be flat. And according to analysts at Morgan Stanley, US stocks will decline as there is a possibility of the economy plunging into recession and keeping Fed rates at a high level.
It is also unlikely that the unresolved problem with the US debt ceiling will contribute to optimism in the stock market. Therefore, level 4,170 may continue to provide resistance as it did before (shown by arrows).
To take advantage of trends in the world's stock markets, consider enlisting the services of a reliable broker like FXOpen.
⚠️
CFDs are complex instruments and come with a high risk of losing your money.
This article represents the opinion of the Companies operating under the FXOpen brand only. It is not to be construed as an offer, solicitation, or recommendation with respect to products and services provided by the Companies operating under the FXOpen brand, nor is it to be considered financial advice.
S&P 500 Reacts Positively to Declining Inflation
Yesterday's news showed that the consumer price index fell to 4.9%. The last time inflation was below 5% was in May 2021. Thus, the Fed has received new evidence of success in its fight against rising prices, and market participants now expect that a halt will be made in a series of interest rate hikes.
The stock index reacted positively. As a result of yesterday, the price of the E-mini S&P 500 futures increased, and this morning it is growing towards yesterday's highs.
The E-mini S&P 500 futures chart also shows that the contract value is near the important resistance level of 4,170.
According to analysts at UBS Bank, the price will be flat. And according to analysts at Morgan Stanley, US stocks will decline as there is a possibility of the economy plunging into recession and keeping Fed rates at a high level.
It is also unlikely that the unresolved problem with the US debt ceiling will contribute to optimism in the stock market. Therefore, level 4,170 may continue to provide resistance as it did before (shown by arrows).
To take advantage of trends in the world's stock markets, consider enlisting the services of a reliable broker like FXOpen.
⚠️
CFDs are complex instruments and come with a high risk of losing your money.
This article represents the opinion of the Companies operating under the FXOpen brand only. It is not to be construed as an offer, solicitation, or recommendation with respect to products and services provided by the Companies operating under the FXOpen brand, nor is it to be considered financial advice.
👍1
#MarketNews #XAU
Gold Price Analysis: Bulls Are Missing Out Again
Kitco is relaying an opinion on the price of gold from Karen Karniol-Tambour, co-chief investment officer at Bridgewater Associates:
→ Gold is undervalued.
→ Gold is supported by the tense geopolitical situation, including the military operations in Ukraine.
→ Inflation is volatile. There is a possibility that purchasing power will be lost.
It looks like a positive assessment should be taken as a long-term perspective, because so far the XAU/USD gold price chart shows a bearish trend.
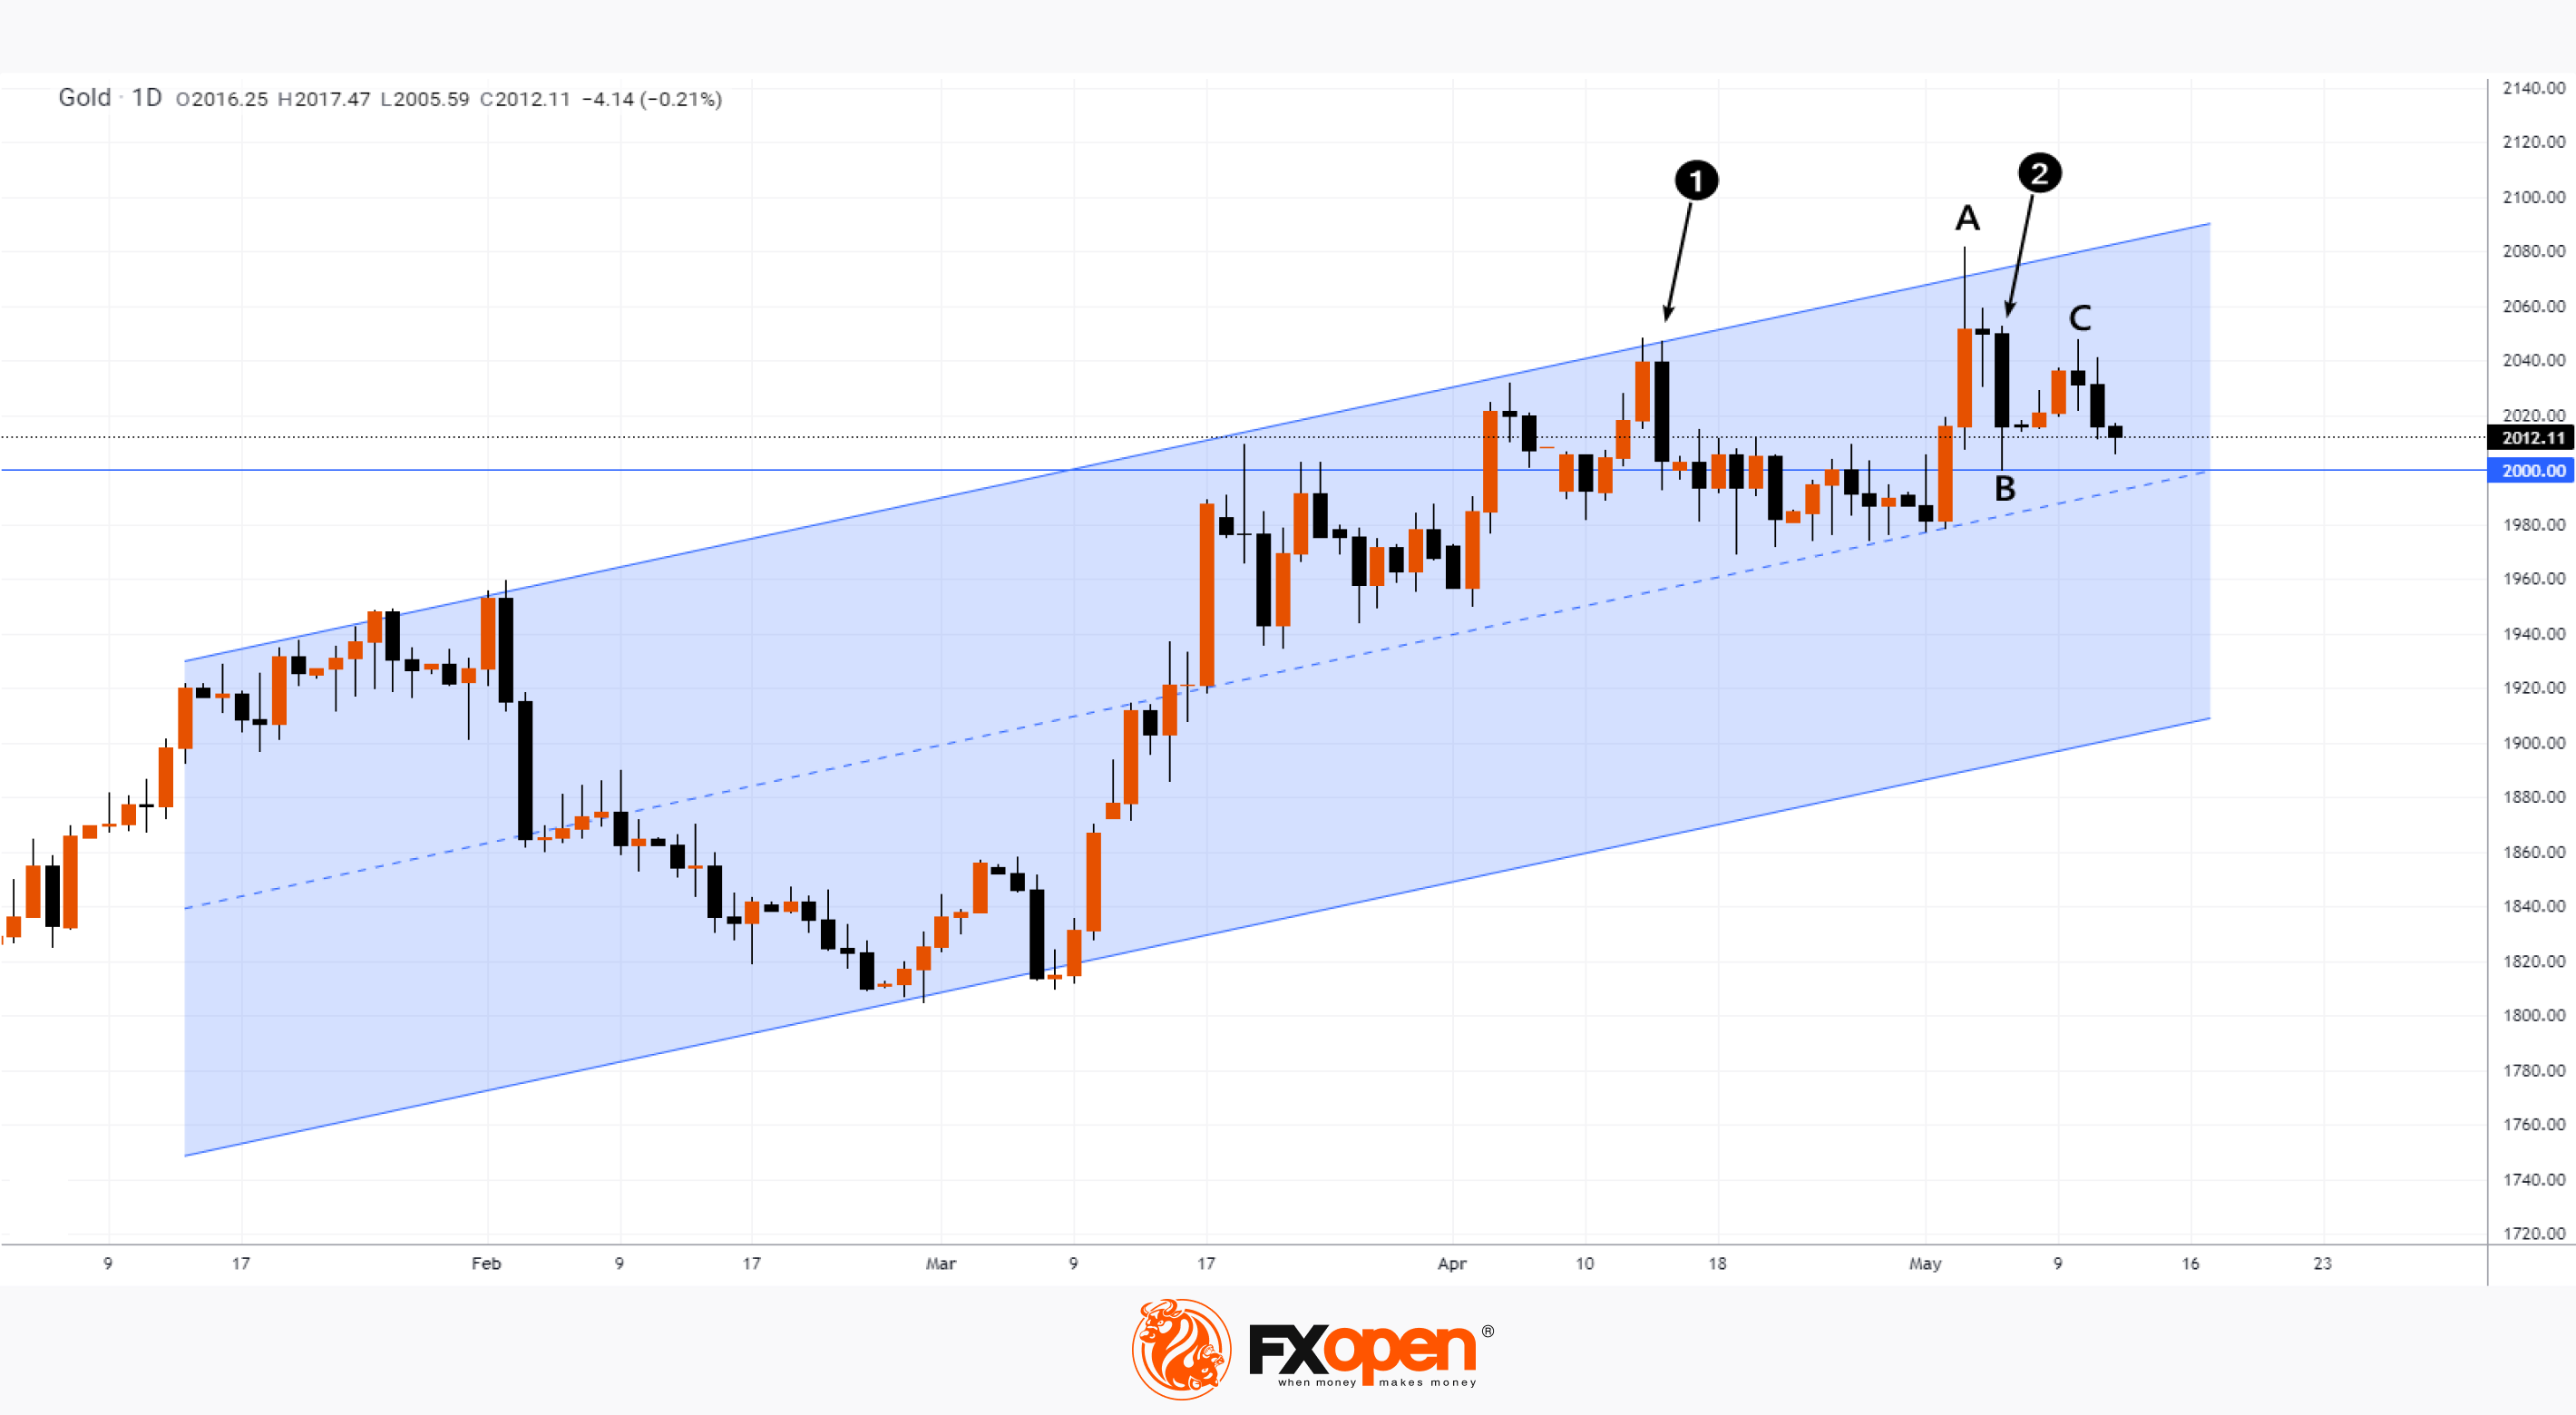
In April-May 2023, the price of XAU/USD exceeded the level of USD 2,000 for the third time (the first was in the summer of 2020, the second in the spring of 2022). But, judging by the analysis of the chart, this time the bulls will not be able to stay above this psychological mark.
→ On candles 1 and 2 bears are powerfully absorbing bullish efforts.
→ A long upper shadow on May 4 (A) indicates a lot of supply.
→ The rebound in B→C is approximately 50% of the decline in A→B
Therefore, there is a growing possibility that the price of gold XAU/USD may fall to the lower border of the current channel (shown in blue).
To take advantage of trends in the commodity markets, consider enlisting the services of a reliable broker like FXOpen.
⚠️
CFDs are complex instruments and come with a high risk of losing your money.
This article represents the opinion of the Companies operating under the FXOpen brand only. It is not to be construed as an offer, solicitation, or recommendation with respect to products and services provided by the Companies operating under the FXOpen brand, nor is it to be considered financial advice.
Gold Price Analysis: Bulls Are Missing Out Again
Kitco is relaying an opinion on the price of gold from Karen Karniol-Tambour, co-chief investment officer at Bridgewater Associates:
→ Gold is undervalued.
→ Gold is supported by the tense geopolitical situation, including the military operations in Ukraine.
→ Inflation is volatile. There is a possibility that purchasing power will be lost.
It looks like a positive assessment should be taken as a long-term perspective, because so far the XAU/USD gold price chart shows a bearish trend.
In April-May 2023, the price of XAU/USD exceeded the level of USD 2,000 for the third time (the first was in the summer of 2020, the second in the spring of 2022). But, judging by the analysis of the chart, this time the bulls will not be able to stay above this psychological mark.
→ On candles 1 and 2 bears are powerfully absorbing bullish efforts.
→ A long upper shadow on May 4 (A) indicates a lot of supply.
→ The rebound in B→C is approximately 50% of the decline in A→B
Therefore, there is a growing possibility that the price of gold XAU/USD may fall to the lower border of the current channel (shown in blue).
To take advantage of trends in the commodity markets, consider enlisting the services of a reliable broker like FXOpen.
⚠️
CFDs are complex instruments and come with a high risk of losing your money.
This article represents the opinion of the Companies operating under the FXOpen brand only. It is not to be construed as an offer, solicitation, or recommendation with respect to products and services provided by the Companies operating under the FXOpen brand, nor is it to be considered financial advice.
#MarketNews #bitcoin
Bitcoin Price Analysis: Support Is Approaching
Today, bitcoin has fallen in price below USD 27k per coin — for the first time in May.
According to Bloomberg, the reasons are as follows:
1→ Congestion of the bitcoin blockchain. Perhaps this is due to a surge in interest in cheap meme coins, which has led to an increase in transactions.
2→ Regulator pressure. Not to mention the SEC, we note that this week President Biden spoke out about the fact that holes in the legislation allow investors in cryptocurrencies to avoid paying taxes.
We also note the growth of the US dollar index, which automatically puts pressure on the ratio of one BTC to USD.
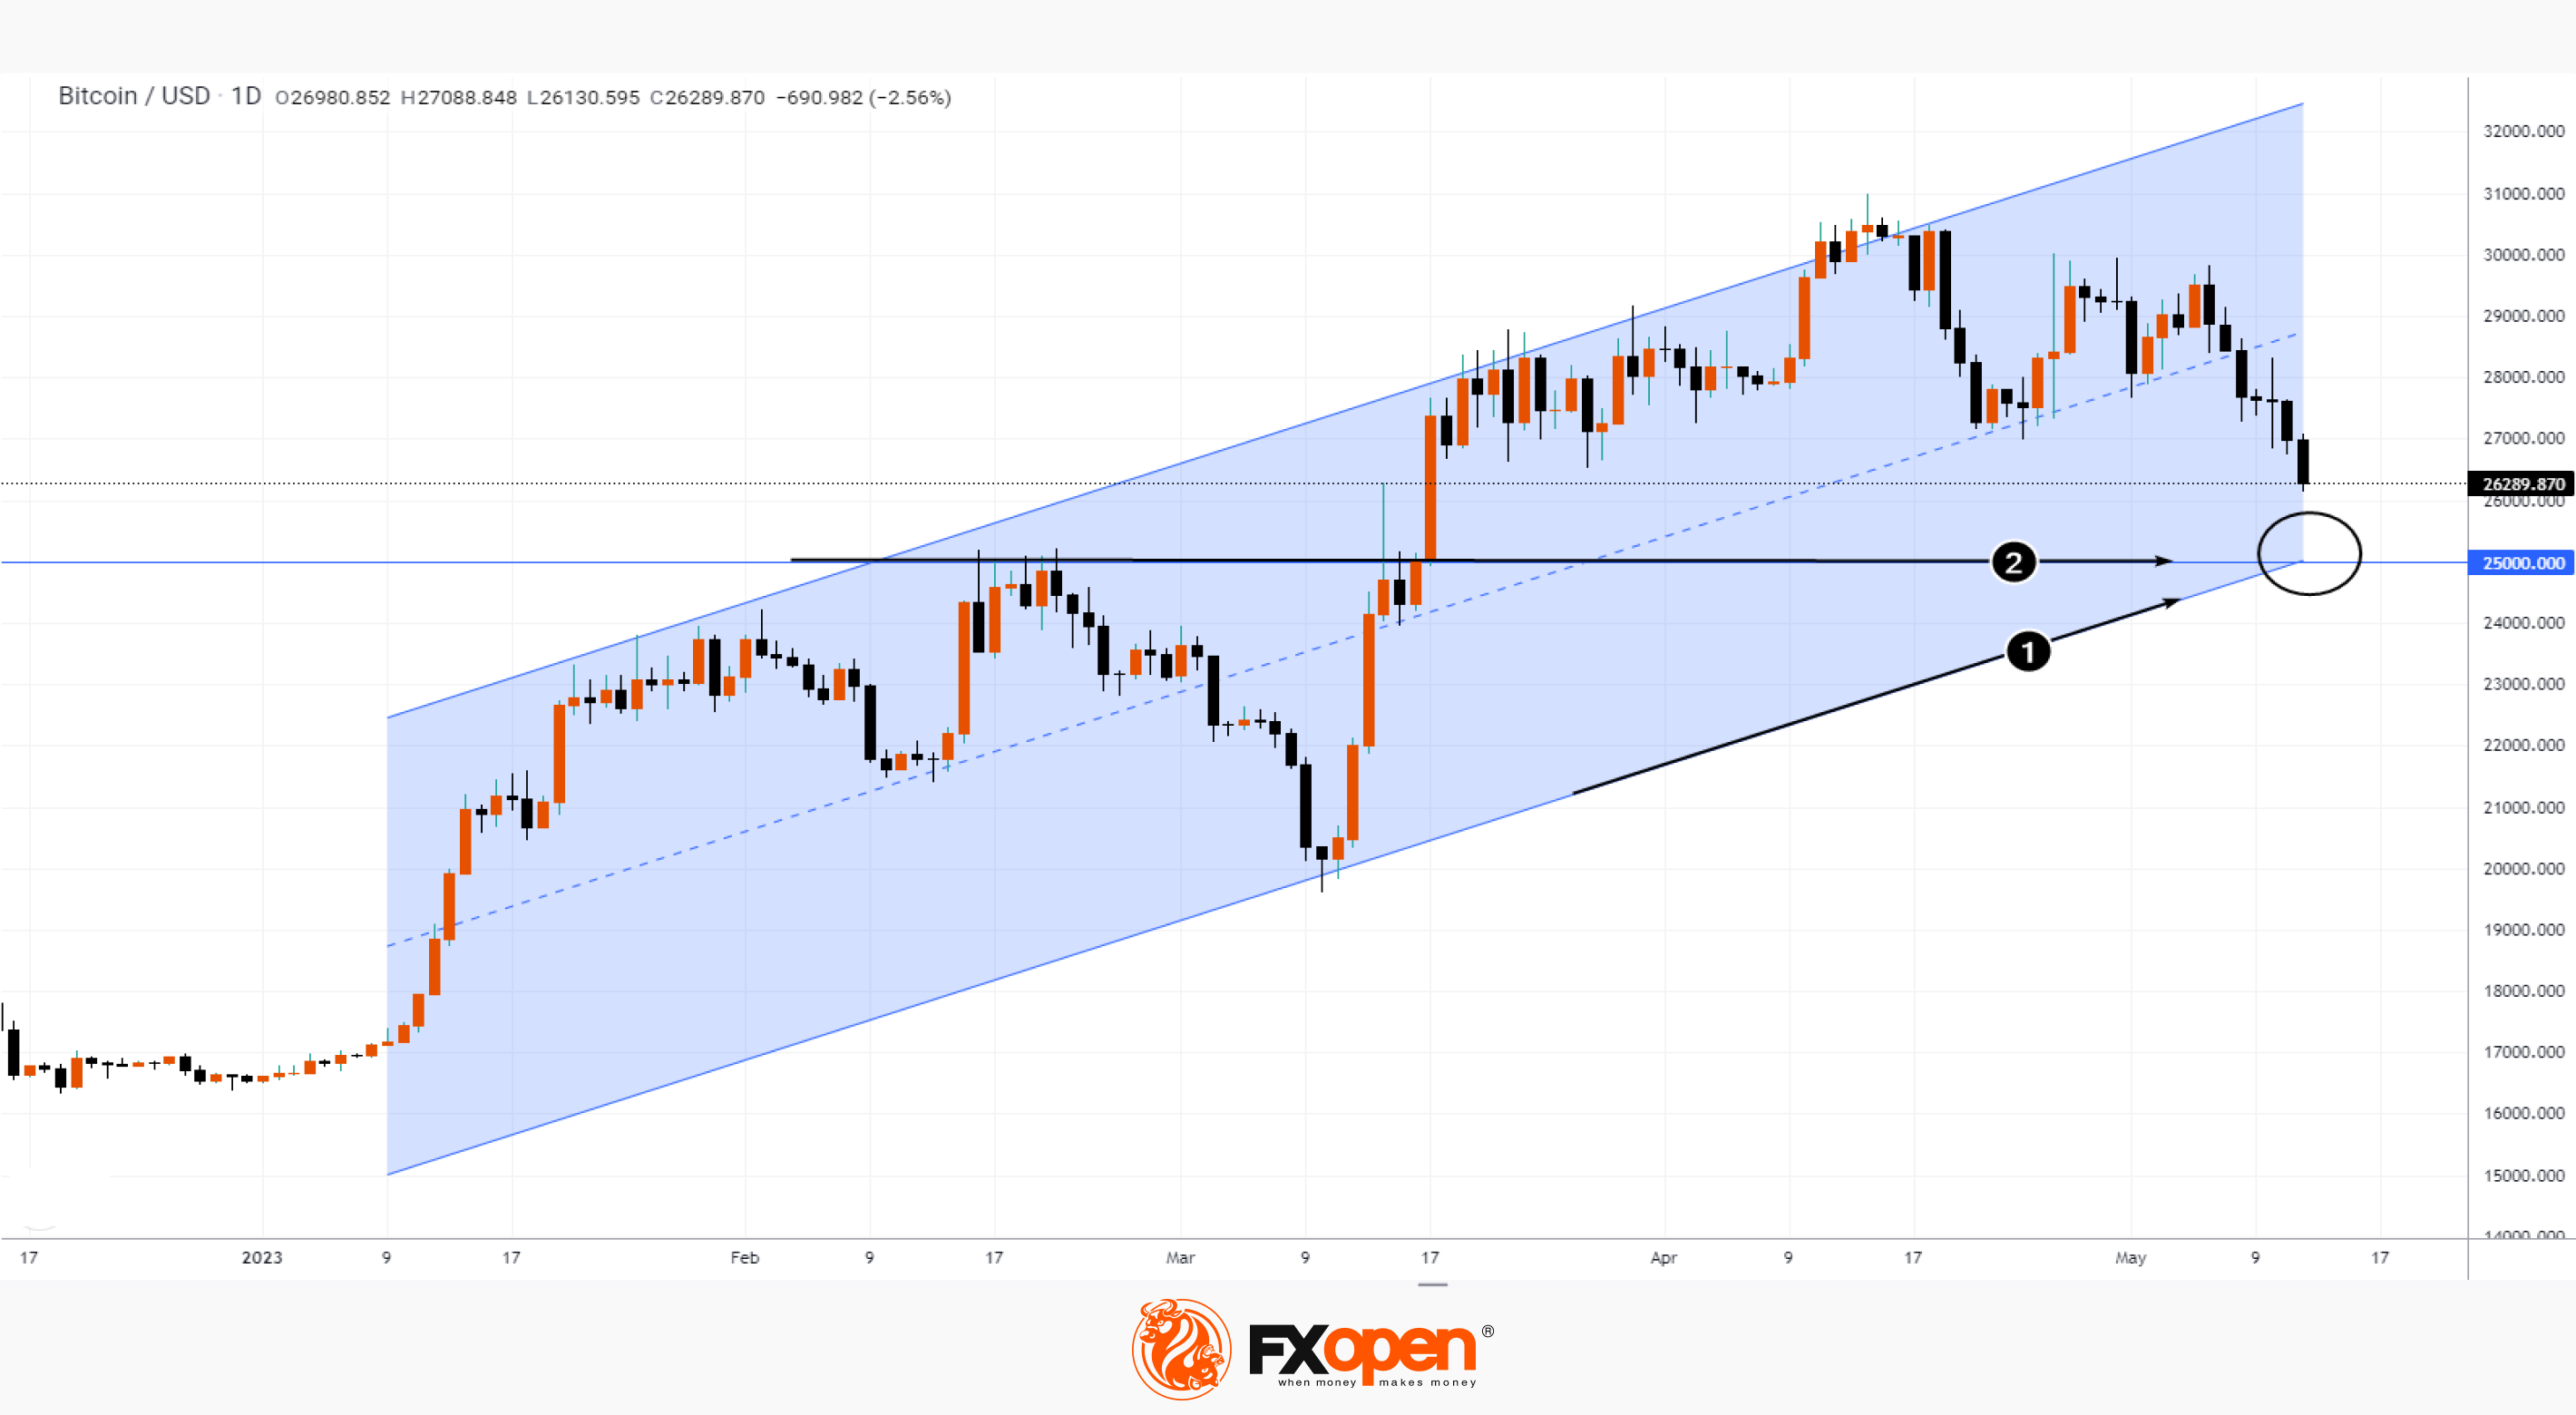
The bitcoin chart, meanwhile, shows that support may be close at hand.
We are talking about the crossing of the lower line (1) of the rising channel, as well as the psychological level (2) of USD 25k per bitcoin. If the price of bitcoin falls to this intersection, it can be assumed that the decline may culminate here.
To take advantage of the rise and fall in the price of bitcoin and other cryptocurrencies, consider enlisting the services of a reliable broker like FXOpen.
⚠️
CFDs are complex instruments and come with a high risk of losing your money.
This article represents the opinion of the Companies operating under the FXOpen brand only. It is not to be construed as an offer, solicitation, or recommendation with respect to products and services provided by the Companies operating under the FXOpen brand, nor is it to be considered financial advice.
At FXOpen UK and FXOpen AU, Cryptocurrency CFDs are only available for trading by those clients categorised as Professional clients under FCA Rules and Professional clients under ASIC Rules, respectively. They are not available for trading by Retail clients.
Bitcoin Price Analysis: Support Is Approaching
Today, bitcoin has fallen in price below USD 27k per coin — for the first time in May.
According to Bloomberg, the reasons are as follows:
1→ Congestion of the bitcoin blockchain. Perhaps this is due to a surge in interest in cheap meme coins, which has led to an increase in transactions.
2→ Regulator pressure. Not to mention the SEC, we note that this week President Biden spoke out about the fact that holes in the legislation allow investors in cryptocurrencies to avoid paying taxes.
We also note the growth of the US dollar index, which automatically puts pressure on the ratio of one BTC to USD.
The bitcoin chart, meanwhile, shows that support may be close at hand.
We are talking about the crossing of the lower line (1) of the rising channel, as well as the psychological level (2) of USD 25k per bitcoin. If the price of bitcoin falls to this intersection, it can be assumed that the decline may culminate here.
To take advantage of the rise and fall in the price of bitcoin and other cryptocurrencies, consider enlisting the services of a reliable broker like FXOpen.
⚠️
CFDs are complex instruments and come with a high risk of losing your money.
This article represents the opinion of the Companies operating under the FXOpen brand only. It is not to be construed as an offer, solicitation, or recommendation with respect to products and services provided by the Companies operating under the FXOpen brand, nor is it to be considered financial advice.
At FXOpen UK and FXOpen AU, Cryptocurrency CFDs are only available for trading by those clients categorised as Professional clients under FCA Rules and Professional clients under ASIC Rules, respectively. They are not available for trading by Retail clients.
#MarketNews
Watch FXOpen's May 8 - 12
Weekly Market Wrap Video
In this video, FXOpen UK COO Gary Thomson sums up the week’s happenings and discusses the most significant news reports.
🔸In Forex, GBP/USD reaches a new high since the beginning of the year
🔸FTSE 100 drops 108 points in 5 days despite strong pound
🔸British pound flying high against US dollar as King Charles crowned
🔸Will Amazon hit last month’s highs again in May?
🔸S&P 500 reacts positively to declining inflation
Watch our short and informative video, and stay updated with FXOpen.
https://cutt.ly/I6bgSEa
To take advantage of price fluctuations in the foreign exchange markets, consider enlisting the services of a reliable broker like FXOpen.
⚠️
This forecast represents FXOpen Companies opinion only, it should not be construed as an offer, invitation or recommendation in respect to FXOpen Companies products and services or as financial advice
Watch FXOpen's May 8 - 12
Weekly Market Wrap Video
In this video, FXOpen UK COO Gary Thomson sums up the week’s happenings and discusses the most significant news reports.
🔸In Forex, GBP/USD reaches a new high since the beginning of the year
🔸FTSE 100 drops 108 points in 5 days despite strong pound
🔸British pound flying high against US dollar as King Charles crowned
🔸Will Amazon hit last month’s highs again in May?
🔸S&P 500 reacts positively to declining inflation
Watch our short and informative video, and stay updated with FXOpen.
https://cutt.ly/I6bgSEa
To take advantage of price fluctuations in the foreign exchange markets, consider enlisting the services of a reliable broker like FXOpen.
⚠️
This forecast represents FXOpen Companies opinion only, it should not be construed as an offer, invitation or recommendation in respect to FXOpen Companies products and services or as financial advice
YouTube
Weekly Market Wrap With Gary Thomson: GBP/USD, FTSE 100 DROPS, S&P 500 REACTS, AMAZON
In this video, FXOpen UK COO Gary Thomson sums up the week’s happenings and discusses the most significant news reports.
- In Forex, GBP/USD reaches a new high since the beginning of the year
- FTSE 100 drops 108 points in 5 days despite strong pound
…
- In Forex, GBP/USD reaches a new high since the beginning of the year
- FTSE 100 drops 108 points in 5 days despite strong pound
…
👍1
#MarketNews
E-mini Nasdaq 100 Futures Hit Year's High
It happened on Friday. However, the last day of last week closed lower after the news report about consumer sentiment in the US falling to a six-month low.
Also on Friday, the Congressional Budget Office warned that the United States faced a "significant risk" of default on its payment obligations during the first two weeks of June unless the national debt ceiling was raised.
The second round of debt ceiling talks between the White House and Congressional leaders is scheduled for Tuesday, President Biden said Sunday. He added that there is no turning point in the negotiations yet, but real discussions are underway, because, naturally, the US is not interested in its own default.
On Monday, the price of E-mini Nasdaq 100 futures is rising again; it is possible that another update will take place this week. E-mini Nasdaq 100 futures are stronger than E-mini S&P 500 futures because:
→ the Nasdaq 100 index does not include shares of large banks that are under pressure due to the banking crisis;
→ the results of the leading companies for the Q1 did not disappoint investors.
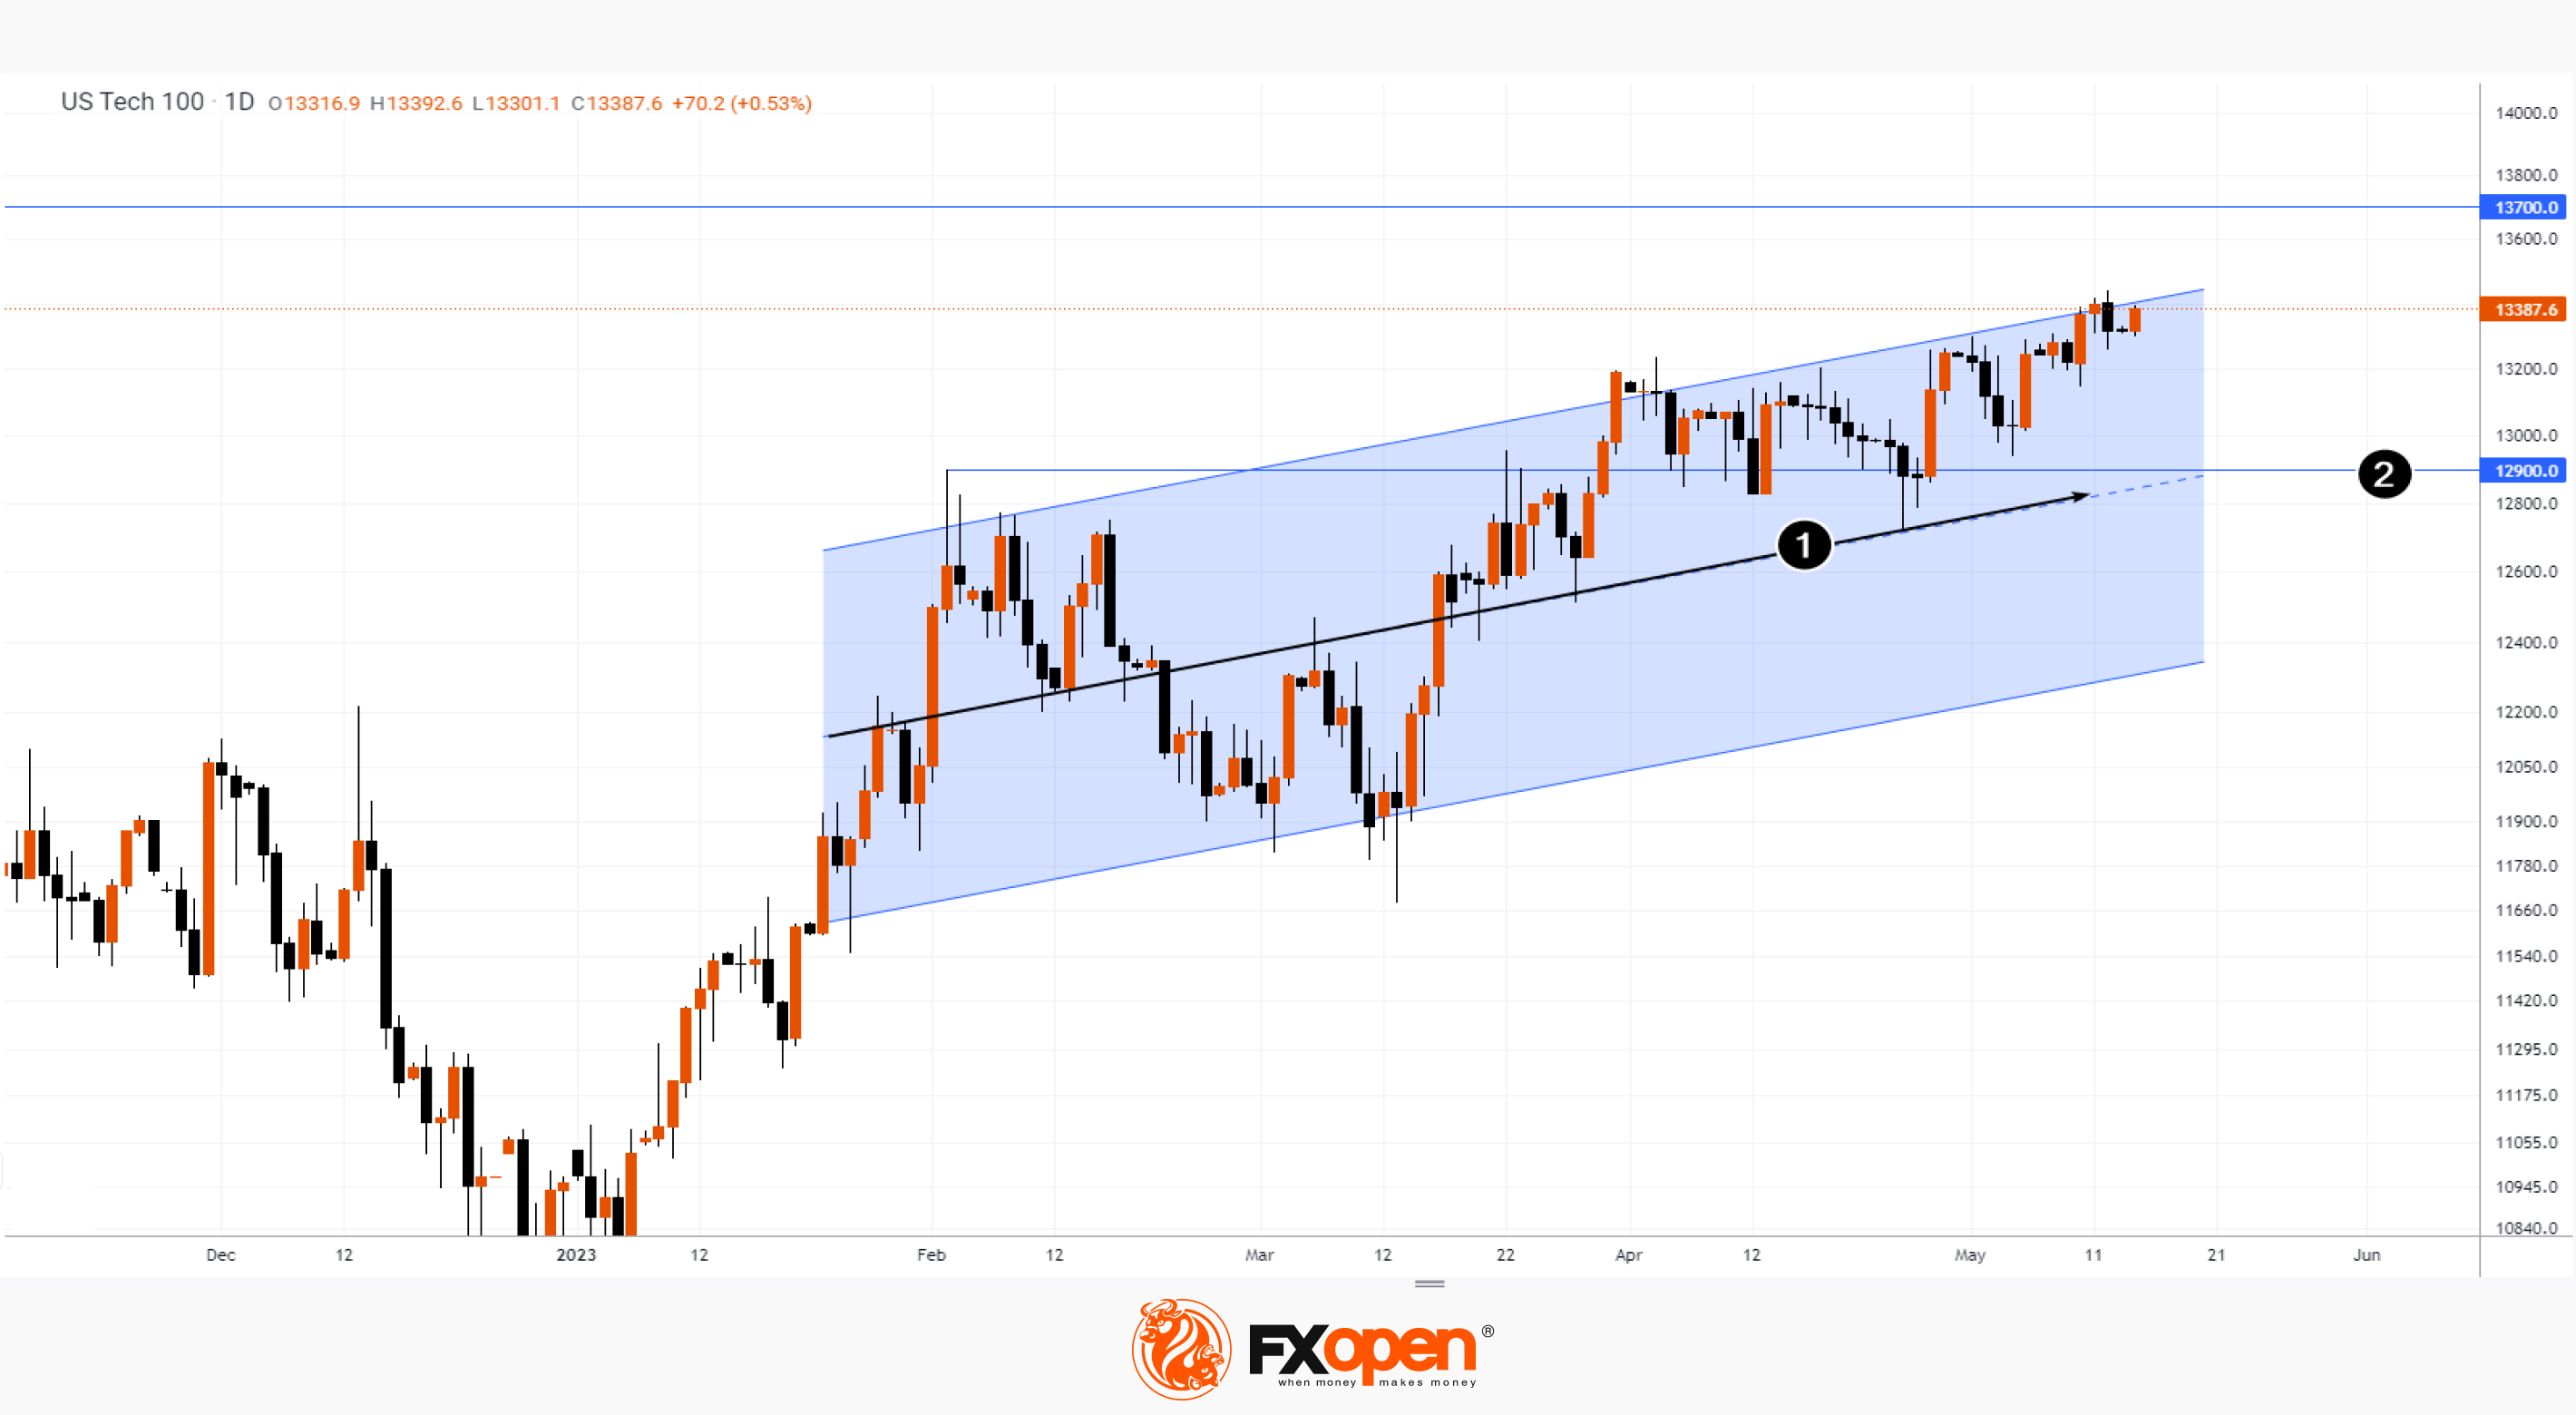
The Nasdaq 100 chart today shows that the price of the asset is at the upper border of the channel. It will prevent the price from exploding, which can only be believed with great optimism, given that the headlines about the US default create an increasingly negative background. If there is a correction, it is acceptable to assume that the futures price will find support from the median channel line (1) near the psychological level of 13,000 (2).
To take advantage of fluctuations in the stock markets of the US and other countries, consider enlisting the services of a reliable broker like FXOpen.
⚠️
CFDs are complex instruments and come with a high risk of losing your money.
This article represents the opinion of the Companies operating under the FXOpen brand only. It is not to be construed as an offer, solicitation, or recommendation with respect to products and services provided by the Companies operating under the FXOpen brand, nor is it to be considered financial advice.
E-mini Nasdaq 100 Futures Hit Year's High
It happened on Friday. However, the last day of last week closed lower after the news report about consumer sentiment in the US falling to a six-month low.
Also on Friday, the Congressional Budget Office warned that the United States faced a "significant risk" of default on its payment obligations during the first two weeks of June unless the national debt ceiling was raised.
The second round of debt ceiling talks between the White House and Congressional leaders is scheduled for Tuesday, President Biden said Sunday. He added that there is no turning point in the negotiations yet, but real discussions are underway, because, naturally, the US is not interested in its own default.
On Monday, the price of E-mini Nasdaq 100 futures is rising again; it is possible that another update will take place this week. E-mini Nasdaq 100 futures are stronger than E-mini S&P 500 futures because:
→ the Nasdaq 100 index does not include shares of large banks that are under pressure due to the banking crisis;
→ the results of the leading companies for the Q1 did not disappoint investors.
The Nasdaq 100 chart today shows that the price of the asset is at the upper border of the channel. It will prevent the price from exploding, which can only be believed with great optimism, given that the headlines about the US default create an increasingly negative background. If there is a correction, it is acceptable to assume that the futures price will find support from the median channel line (1) near the psychological level of 13,000 (2).
To take advantage of fluctuations in the stock markets of the US and other countries, consider enlisting the services of a reliable broker like FXOpen.
⚠️
CFDs are complex instruments and come with a high risk of losing your money.
This article represents the opinion of the Companies operating under the FXOpen brand only. It is not to be construed as an offer, solicitation, or recommendation with respect to products and services provided by the Companies operating under the FXOpen brand, nor is it to be considered financial advice.
#MarketNews #bitcoin
TOP-3 Assets To Look out for in Case of US Default
Bloomberg writes that the risk of default is higher than ever, adding that according to Janet Yellen, she has no plan for the fact that the national debt ceiling will not be raised. The Treasury secretary, who worked at the Fed in 2011 when the situation was similar, said she was focusing on working with Congress to raise the ceiling.
With the denouement looming, Bloomberg polled more than 600 finance professionals between May 8 and May 12 for the best safe haven asset in the event of a default.
→ Top 1. Gold. More than half of the respondents said they would buy gold if the US government failed to meet its obligations.
→ Top 2. US bonds. It's a little paradoxical to buy bonds of a defaulting government. The logic is that bond payments take precedence — bond holders are usually paid, albeit late.
In third place, one could expect the Japanese yen or the Swiss franc. However…
→ Top 3. Bitcoin. Its price has increased by about 65% since the beginning of the year.
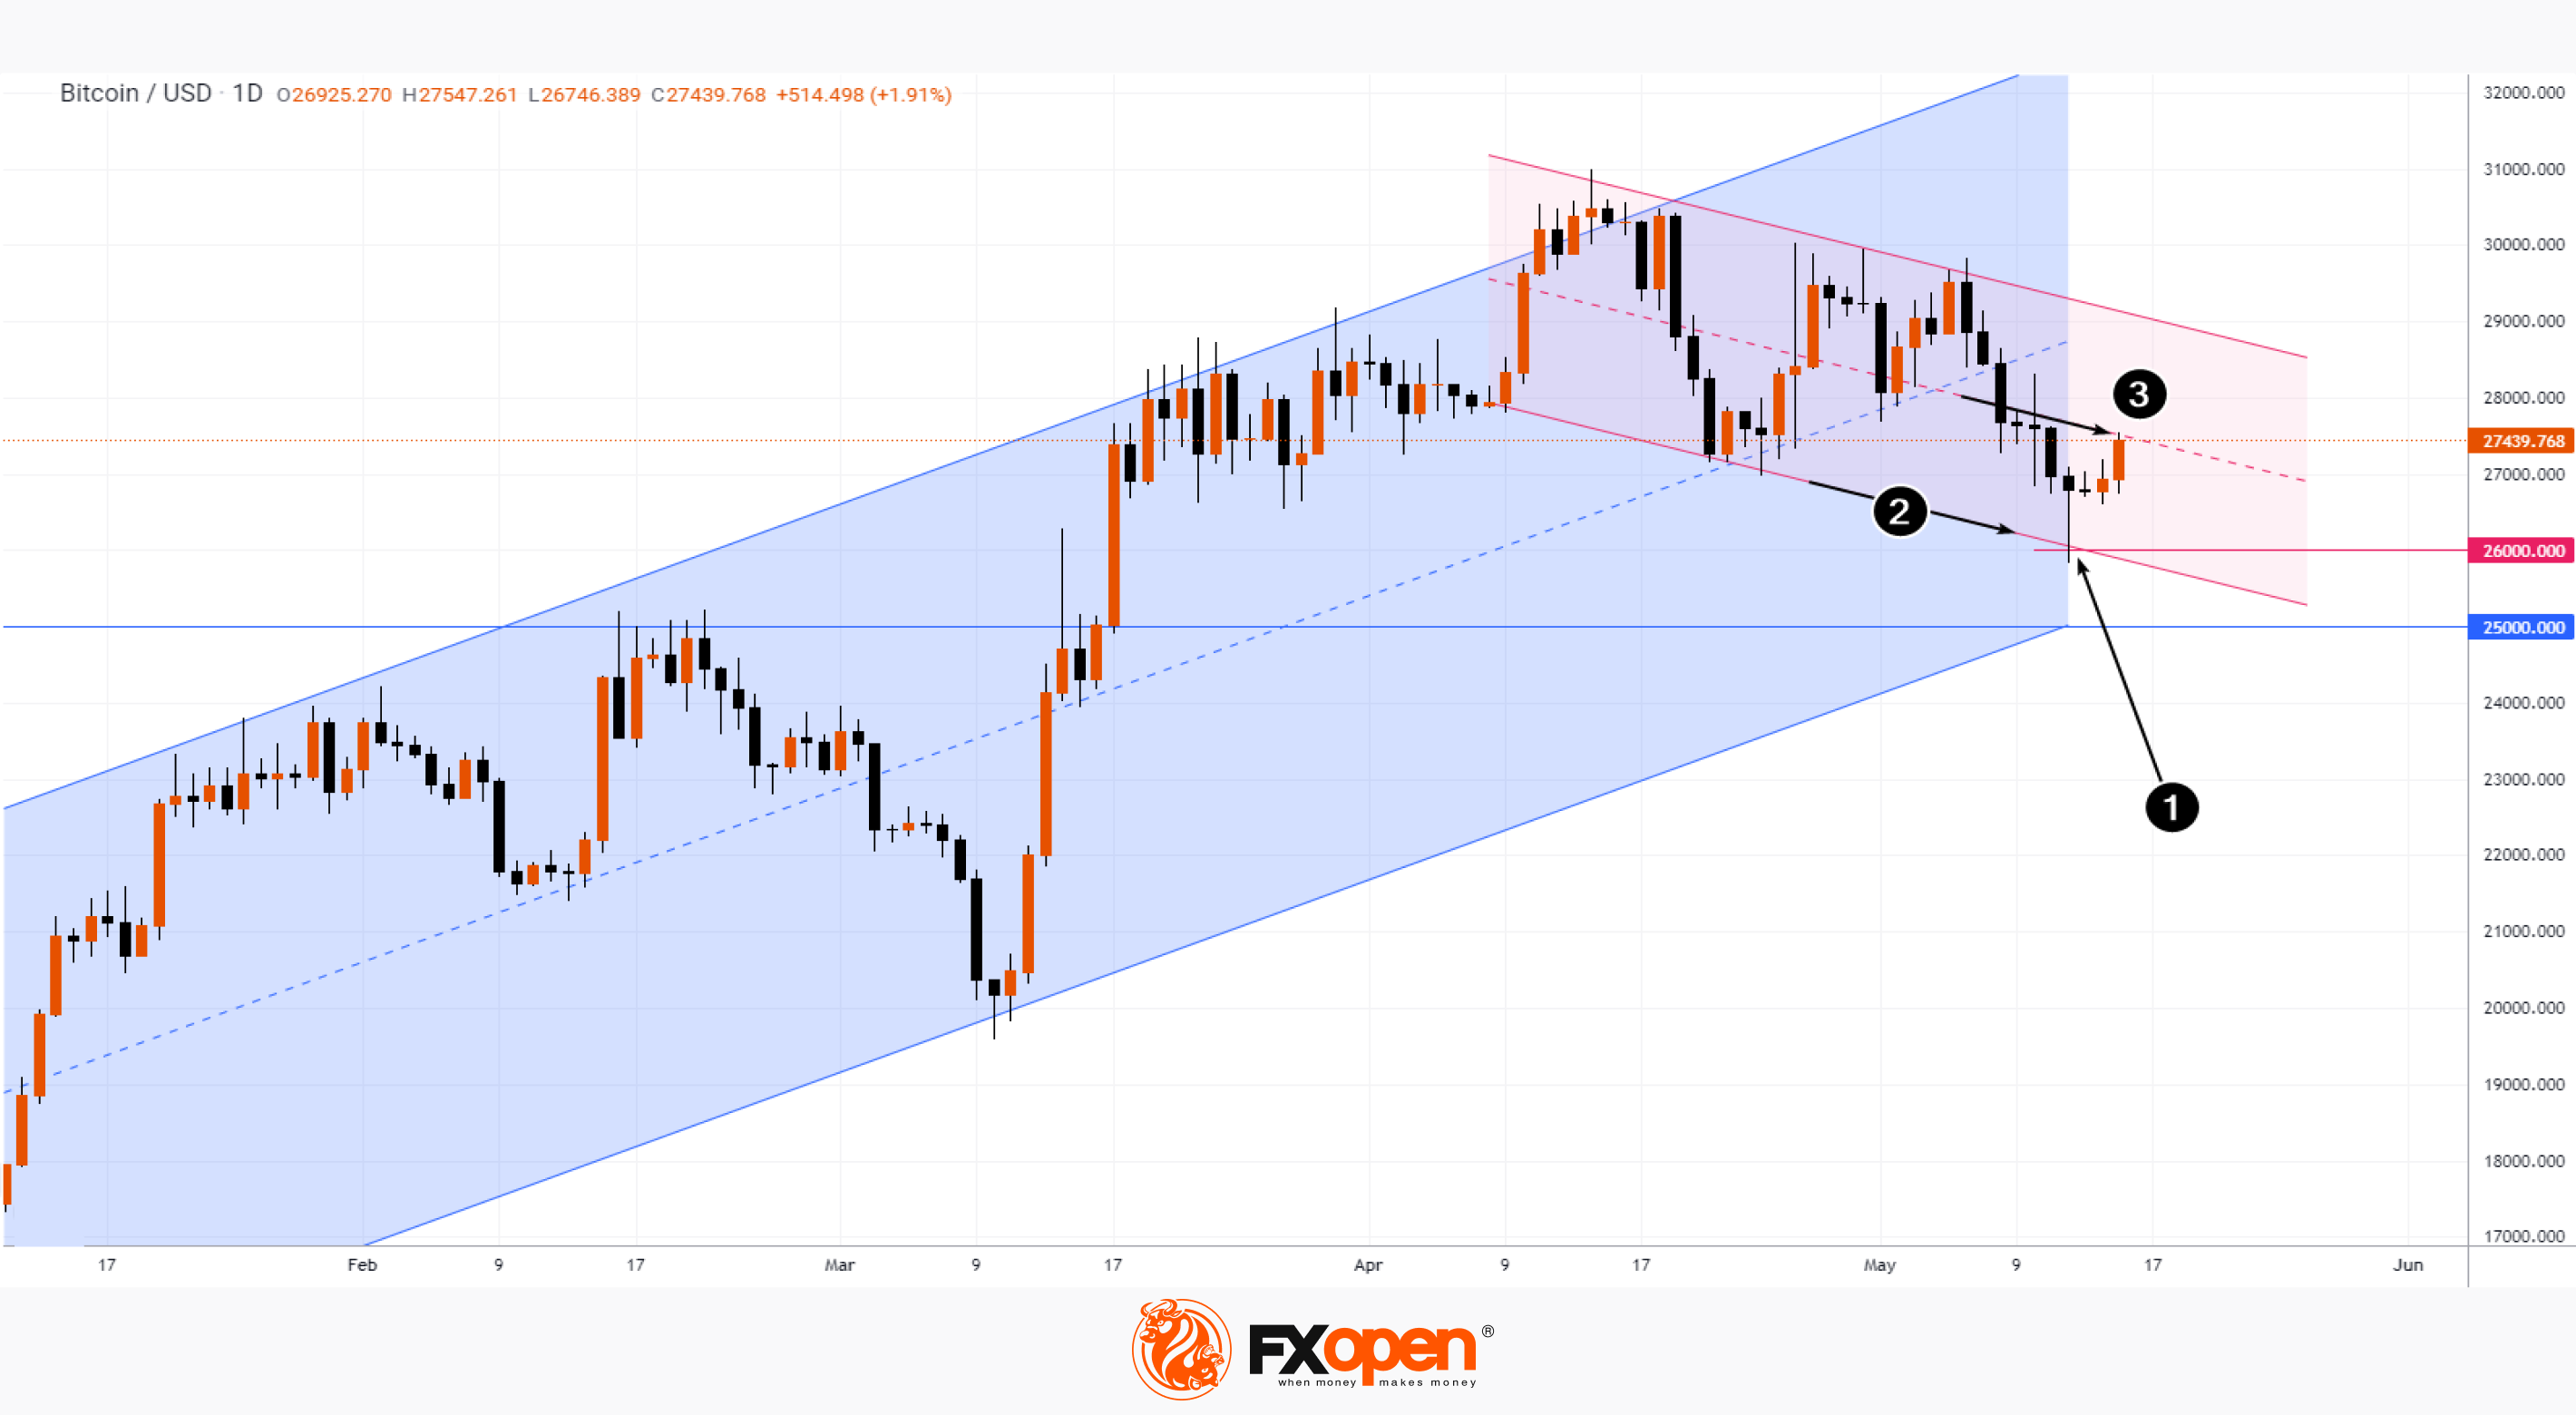
The BTC/USD chart today shows that the price of the coin has been in a downtrend since mid-April (shown in red) within a larger uptrend (shown in blue).
Having rebounded (1) from the intersection of the psychological level of USD $26k and the lower line of the red channel (2), the price of bitcoin found resistance from the red median line (3). If the bears are able to keep the momentum of BTC/USD within the downward channel, the price may drop to USD $25k or even lower, which will presumably reduce the attractiveness of bitcoin as a defensive asset.
To take advantage of the rise and fall of cryptocurrencies, consider enlisting the services of a reliable broker like FXOpen.
⚠️
CFDs are complex instruments and come with a high risk of losing your money.
This article represents the opinion of the Companies operating under the FXOpen brand only. It is not to be construed as an offer, solicitation, or recommendation with respect to products and services provided by the Companies operating under the FXOpen brand, nor is it to be considered financial advice.
Cryptocurrency CFDs are not available to Retail clients in the UK.
At FXOpen UK and FXOpen AU, Cryptocurrency CFDs are only available for trading by those clients categorised as Professional clients under FCA Rules and Professional clients under ASIC Rules, respectively. They are not available for trading by Retail clients.
TOP-3 Assets To Look out for in Case of US Default
Bloomberg writes that the risk of default is higher than ever, adding that according to Janet Yellen, she has no plan for the fact that the national debt ceiling will not be raised. The Treasury secretary, who worked at the Fed in 2011 when the situation was similar, said she was focusing on working with Congress to raise the ceiling.
With the denouement looming, Bloomberg polled more than 600 finance professionals between May 8 and May 12 for the best safe haven asset in the event of a default.
→ Top 1. Gold. More than half of the respondents said they would buy gold if the US government failed to meet its obligations.
→ Top 2. US bonds. It's a little paradoxical to buy bonds of a defaulting government. The logic is that bond payments take precedence — bond holders are usually paid, albeit late.
In third place, one could expect the Japanese yen or the Swiss franc. However…
→ Top 3. Bitcoin. Its price has increased by about 65% since the beginning of the year.
The BTC/USD chart today shows that the price of the coin has been in a downtrend since mid-April (shown in red) within a larger uptrend (shown in blue).
Having rebounded (1) from the intersection of the psychological level of USD $26k and the lower line of the red channel (2), the price of bitcoin found resistance from the red median line (3). If the bears are able to keep the momentum of BTC/USD within the downward channel, the price may drop to USD $25k or even lower, which will presumably reduce the attractiveness of bitcoin as a defensive asset.
To take advantage of the rise and fall of cryptocurrencies, consider enlisting the services of a reliable broker like FXOpen.
⚠️
CFDs are complex instruments and come with a high risk of losing your money.
This article represents the opinion of the Companies operating under the FXOpen brand only. It is not to be construed as an offer, solicitation, or recommendation with respect to products and services provided by the Companies operating under the FXOpen brand, nor is it to be considered financial advice.
Cryptocurrency CFDs are not available to Retail clients in the UK.
At FXOpen UK and FXOpen AU, Cryptocurrency CFDs are only available for trading by those clients categorised as Professional clients under FCA Rules and Professional clients under ASIC Rules, respectively. They are not available for trading by Retail clients.
#MarketNews
GBP/USD and USD/CAD Weekly Chart Outlook
· The British Pound was able to clear the 1.1880 and 1.2000 resistance levels.
· There was a break above a major bearish trend line with resistance near 1.2250 on the weekly chart of GBP/USD on FXOpen.
· USD/CAD is facing strong resistance near the 1.3750 zone.
· It is trading inside a key contracting triangle with resistance at 1.3750 on the weekly chart at FXOpen.
https://cutt.ly/u6YQsG5
CFDs are complex instruments and come with a high risk of losing your money.
This article represents the opinion of the Companies operating under the FXOpen brand only. It is not to be construed as an offer, solicitation, or recommendation with respect to products and services provided by the Companies operating under the FXOpen brand, nor is it to be considered financial advice.
GBP/USD and USD/CAD Weekly Chart Outlook
· The British Pound was able to clear the 1.1880 and 1.2000 resistance levels.
· There was a break above a major bearish trend line with resistance near 1.2250 on the weekly chart of GBP/USD on FXOpen.
· USD/CAD is facing strong resistance near the 1.3750 zone.
· It is trading inside a key contracting triangle with resistance at 1.3750 on the weekly chart at FXOpen.
https://cutt.ly/u6YQsG5
CFDs are complex instruments and come with a high risk of losing your money.
This article represents the opinion of the Companies operating under the FXOpen brand only. It is not to be construed as an offer, solicitation, or recommendation with respect to products and services provided by the Companies operating under the FXOpen brand, nor is it to be considered financial advice.
Market Pulse
GBP/USD and USD/CAD Weekly Chart Outlook
GBP/USD started a steady increase above the key 1.1880 resistance. USD/CAD is consolidating and might rise further toward 1.4000.