#MarketNews #stocks
Market Analysis: Insiders Sell NVDA Shares
According to MarketWatch, Mark Stevens, an Nvidia board member, sold 118,602 NVDA shares in the Friday and Tuesday trading sessions, raising over USD 50 million.
Earlier it became known about the sale of shares of 2 more top managers of Nvidia:
→ Tench Coxe announced a USD 21 million share sale, having sold USD 38 million worth of shares earlier this month.
→ Harvey Jones sold over USD 48 million worth of shares last week after selling over USD 28 million worth of NVDA shares earlier this month.
Are Nvidia executives rushing to get rid of stocks with insider information that could bring down their price?
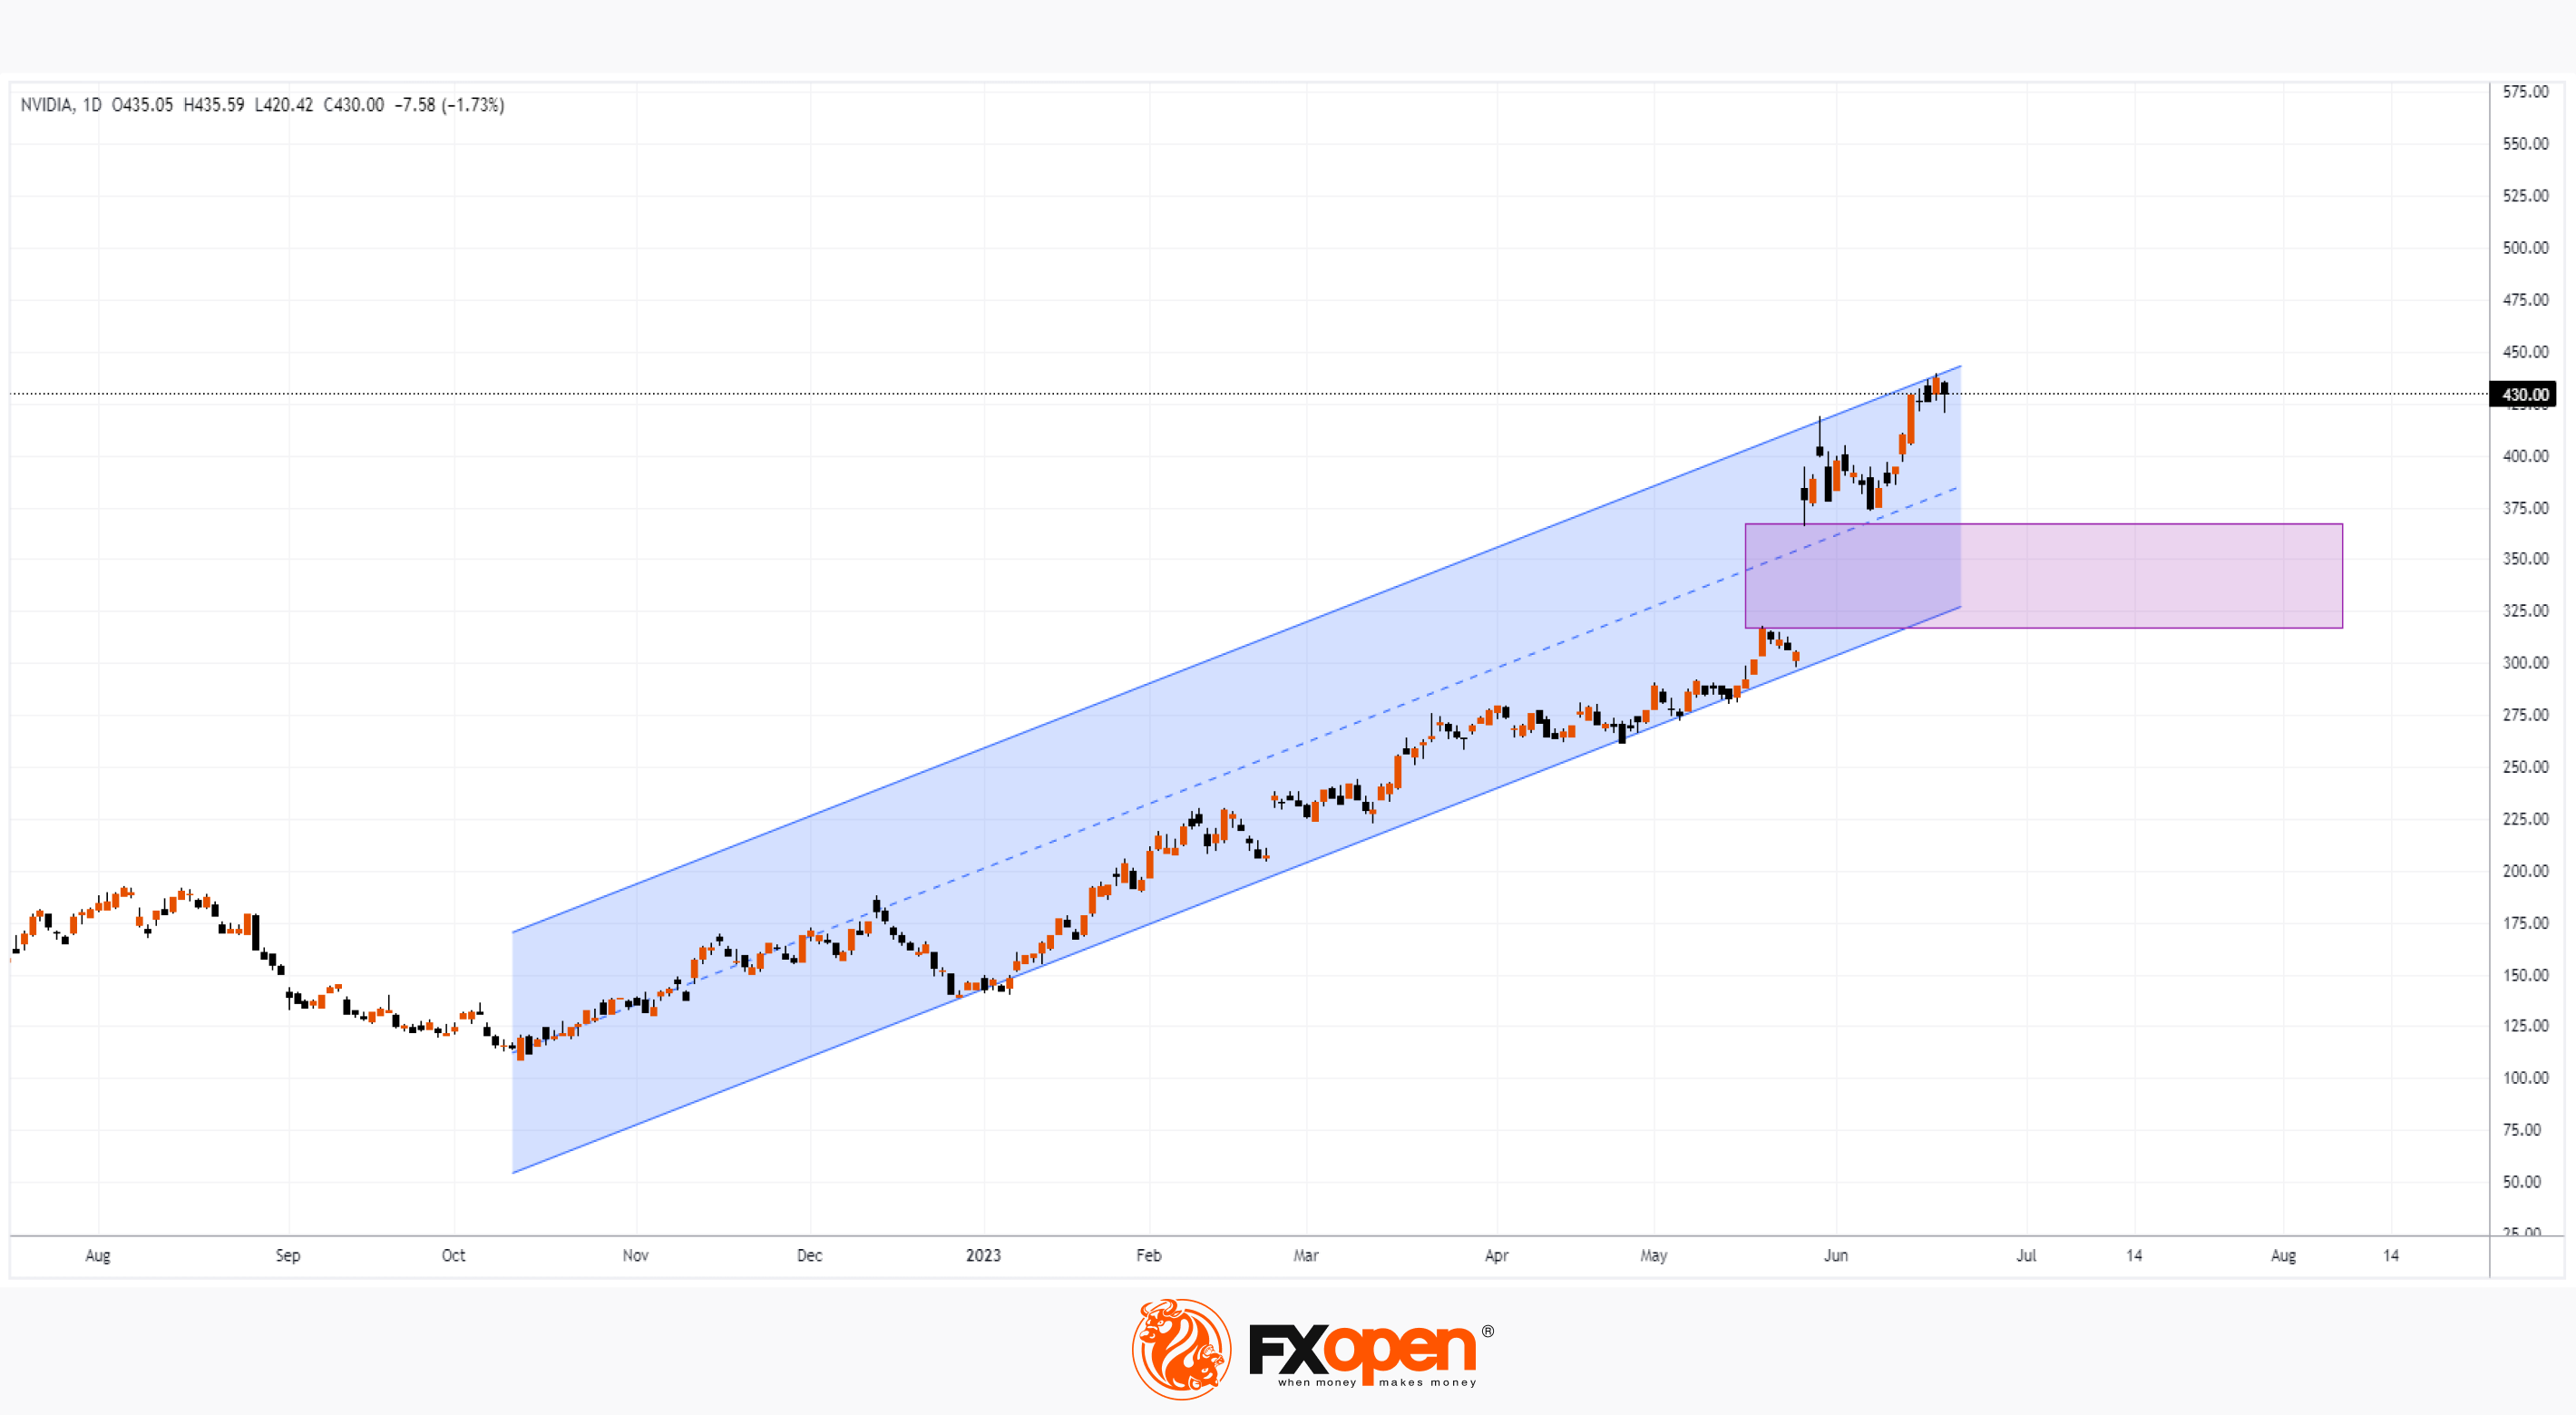
Hardly. Top executives continue to own hundreds of millions of dollars worth of stock, but have likely decided to partially take profits after a sharp rally in Nvidia's stock, which soared 195% this year amid the hype around AI. Perhaps Mark Stevens and colleagues see growing chances for NVDA stock price to correct from the upper line of the ascending channel into the gap area (shown in purple).
To benefit from the rise and fall of NVDA's share price, consider enlisting the services of a reliable broker like FXOpen.
⚠️
CFDs are complex instruments and come with a high risk of losing your money.
This article represents the opinion of the Companies operating under the FXOpen brand only. It is not to be construed as an offer, solicitation, or recommendation with respect to products and services provided by the Companies operating under the FXOpen brand, nor is it to be considered financial advice.
Market Analysis: Insiders Sell NVDA Shares
According to MarketWatch, Mark Stevens, an Nvidia board member, sold 118,602 NVDA shares in the Friday and Tuesday trading sessions, raising over USD 50 million.
Earlier it became known about the sale of shares of 2 more top managers of Nvidia:
→ Tench Coxe announced a USD 21 million share sale, having sold USD 38 million worth of shares earlier this month.
→ Harvey Jones sold over USD 48 million worth of shares last week after selling over USD 28 million worth of NVDA shares earlier this month.
Are Nvidia executives rushing to get rid of stocks with insider information that could bring down their price?
Hardly. Top executives continue to own hundreds of millions of dollars worth of stock, but have likely decided to partially take profits after a sharp rally in Nvidia's stock, which soared 195% this year amid the hype around AI. Perhaps Mark Stevens and colleagues see growing chances for NVDA stock price to correct from the upper line of the ascending channel into the gap area (shown in purple).
To benefit from the rise and fall of NVDA's share price, consider enlisting the services of a reliable broker like FXOpen.
⚠️
CFDs are complex instruments and come with a high risk of losing your money.
This article represents the opinion of the Companies operating under the FXOpen brand only. It is not to be construed as an offer, solicitation, or recommendation with respect to products and services provided by the Companies operating under the FXOpen brand, nor is it to be considered financial advice.
#MarketNews #stockmarket
Market Analysis: Stock Markets Are Falling on the Background of the Activity of Central Banks
This week could be the worst for stock markets in 3 months after a series of interest rate hikes by central banks, writes Bloomberg.
The UK and Switzerland raised the rate by 0.25%. While the US Fed has left rates unchanged for now, Jerome Powell said another rate hike or two may be needed in 2023. Higher-than-expected inflation in Japan has also fueled speculation that the BOJ may adjust its super-loose monetary policy.
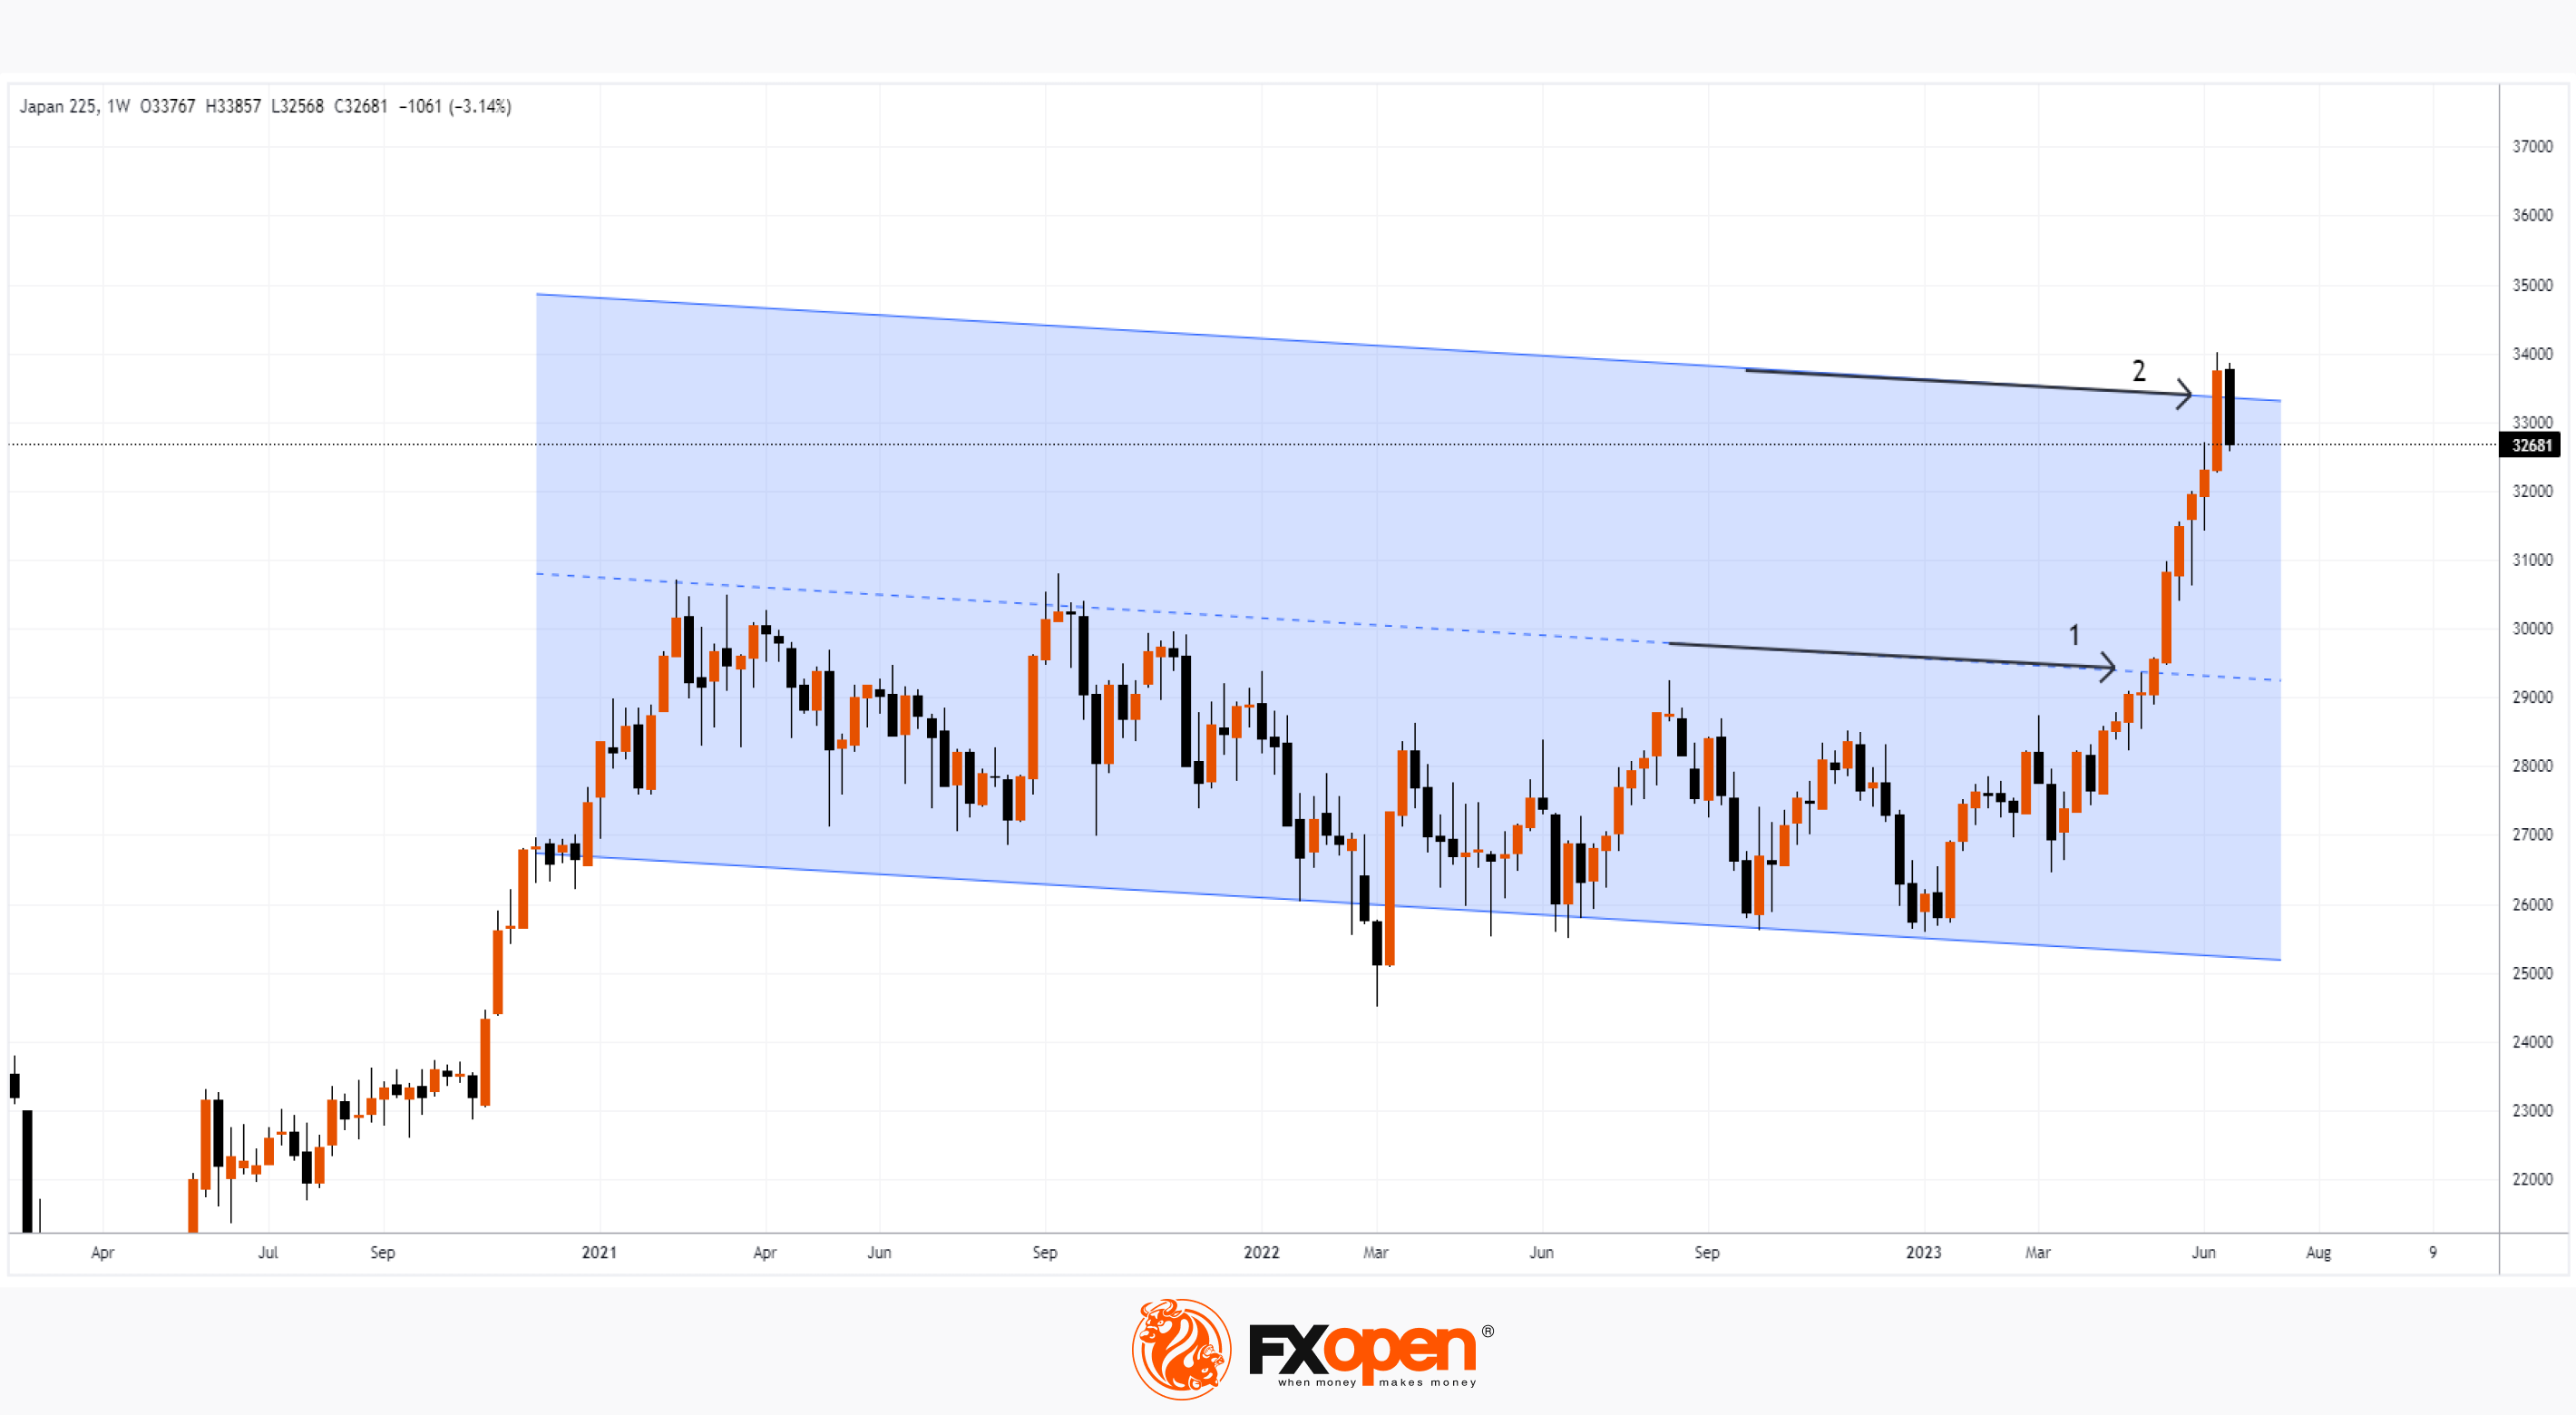
At the same time, an interesting situation is emerging on the Nikkei 225 chart. Having broken through the resistance line (1) in May, the Japanese stock index rushed up, attracting bullish speculators. Growth last week was particularly rapid, suggesting that the market is in the climax of the upward momentum. And the downward movement this week confirms this assumption. A bearish engulfing pattern may form on the Nikkei 225 chart, and, remarkably, if this happens, it will be at the border (2) of a large parallel channel, which begins in the first month of 2021. Thus, the area around 33,000 shows its strength as a resistance and can be used by the bears to build their trading campaigns.
To benefit from the rise and fall of the Nikkei 225 and other stock indexes, consider enlisting the services of a reliable broker like FXOpen.
⚠️
CFDs are complex instruments and come with a high risk of losing your money.
This article represents the opinion of the Companies operating under the FXOpen brand only. It is not to be construed as an offer, solicitation, or recommendation with respect to products and services provided by the Companies operating under the FXOpen brand, nor is it to be considered financial advice.
Market Analysis: Stock Markets Are Falling on the Background of the Activity of Central Banks
This week could be the worst for stock markets in 3 months after a series of interest rate hikes by central banks, writes Bloomberg.
The UK and Switzerland raised the rate by 0.25%. While the US Fed has left rates unchanged for now, Jerome Powell said another rate hike or two may be needed in 2023. Higher-than-expected inflation in Japan has also fueled speculation that the BOJ may adjust its super-loose monetary policy.
At the same time, an interesting situation is emerging on the Nikkei 225 chart. Having broken through the resistance line (1) in May, the Japanese stock index rushed up, attracting bullish speculators. Growth last week was particularly rapid, suggesting that the market is in the climax of the upward momentum. And the downward movement this week confirms this assumption. A bearish engulfing pattern may form on the Nikkei 225 chart, and, remarkably, if this happens, it will be at the border (2) of a large parallel channel, which begins in the first month of 2021. Thus, the area around 33,000 shows its strength as a resistance and can be used by the bears to build their trading campaigns.
To benefit from the rise and fall of the Nikkei 225 and other stock indexes, consider enlisting the services of a reliable broker like FXOpen.
⚠️
CFDs are complex instruments and come with a high risk of losing your money.
This article represents the opinion of the Companies operating under the FXOpen brand only. It is not to be construed as an offer, solicitation, or recommendation with respect to products and services provided by the Companies operating under the FXOpen brand, nor is it to be considered financial advice.
#MarketNews #TSLA #meta
Market Analysis: Musk vs Zuckerberg
Since the beginning of 2021, META and TSLA shares have seemingly been in competition with each other. Either the price of META is higher than the price of TSLA, or vice versa. The turn has come to the rivalry of the CEOs, in the literal sense.
It started when Zuckerberg announced the idea to create a competitor to Twitter. Musk probably didn’t like it, and in response he offered to fight. Zuckerberg accepted the challenge, asking him to name a venue. Musk chose an arena in Vegas as the venue for the fight.
Musk has a size advantage, and according to him, he has experience in tough street fights in South Africa. Zuckerberg has an age advantage as well as a jiu-jitsu belt.
In anticipation of the battle of billionaires, it is worth paying attention to the META stock chart.
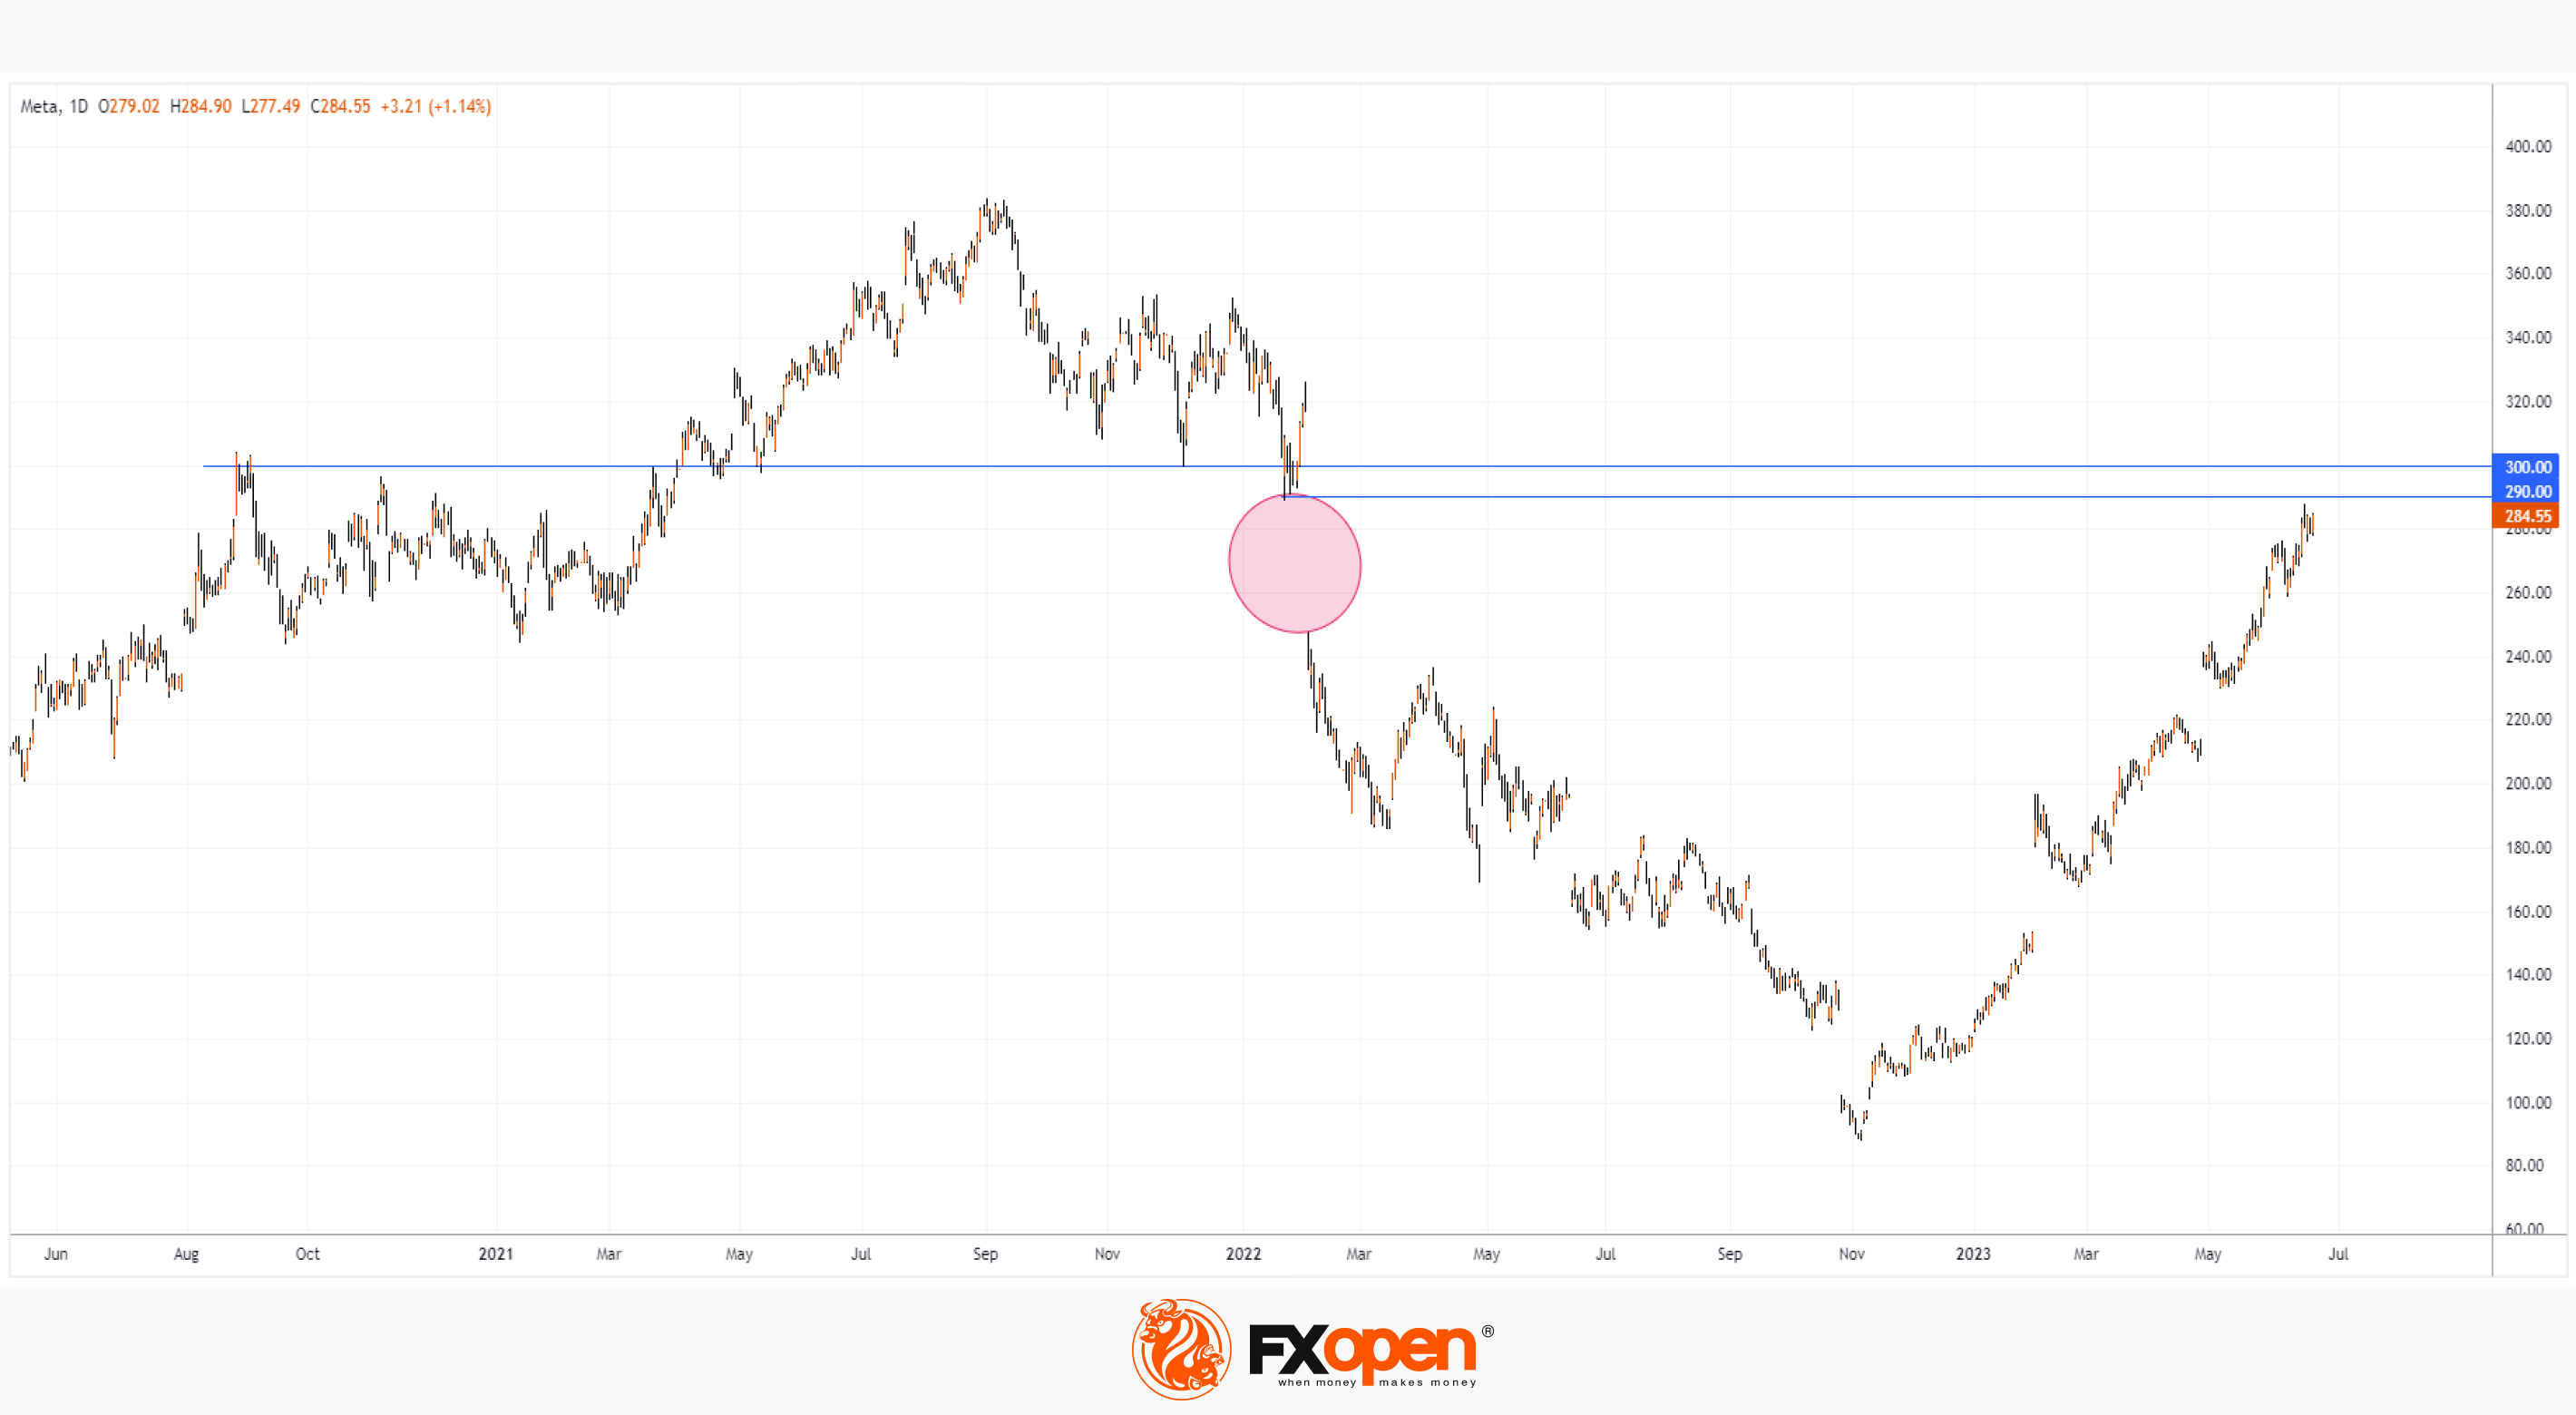
The price of META is near the level of USD 290 per share, which practically means the closing of the gap that formed in 2022. Also, the price of META shares is near the psychological mark of USD 300 – it has influenced the price more than once since 2021. So the 290-300 resistance area may well contribute to the start of a correction for the META share price, which has risen by more than 140% since the beginning of the year.
To benefit from the movement of stock prices of popular companies, consider enlisting the services of a reliable broker like FXOpen.
⚠️
CFDs are complex instruments and come with a high risk of losing your money.
This article represents the opinion of the Companies operating under the FXOpen brand only. It is not to be construed as an offer, solicitation, or recommendation with respect to products and services provided by the Companies operating under the FXOpen brand, nor is it to be considered financial advice.
Market Analysis: Musk vs Zuckerberg
Since the beginning of 2021, META and TSLA shares have seemingly been in competition with each other. Either the price of META is higher than the price of TSLA, or vice versa. The turn has come to the rivalry of the CEOs, in the literal sense.
It started when Zuckerberg announced the idea to create a competitor to Twitter. Musk probably didn’t like it, and in response he offered to fight. Zuckerberg accepted the challenge, asking him to name a venue. Musk chose an arena in Vegas as the venue for the fight.
Musk has a size advantage, and according to him, he has experience in tough street fights in South Africa. Zuckerberg has an age advantage as well as a jiu-jitsu belt.
In anticipation of the battle of billionaires, it is worth paying attention to the META stock chart.
The price of META is near the level of USD 290 per share, which practically means the closing of the gap that formed in 2022. Also, the price of META shares is near the psychological mark of USD 300 – it has influenced the price more than once since 2021. So the 290-300 resistance area may well contribute to the start of a correction for the META share price, which has risen by more than 140% since the beginning of the year.
To benefit from the movement of stock prices of popular companies, consider enlisting the services of a reliable broker like FXOpen.
⚠️
CFDs are complex instruments and come with a high risk of losing your money.
This article represents the opinion of the Companies operating under the FXOpen brand only. It is not to be construed as an offer, solicitation, or recommendation with respect to products and services provided by the Companies operating under the FXOpen brand, nor is it to be considered financial advice.
#MarketNews #bitcoins #BTC
Market Analysis: The Price of Bitcoin Updates the Maximum of the Year, What's Next?
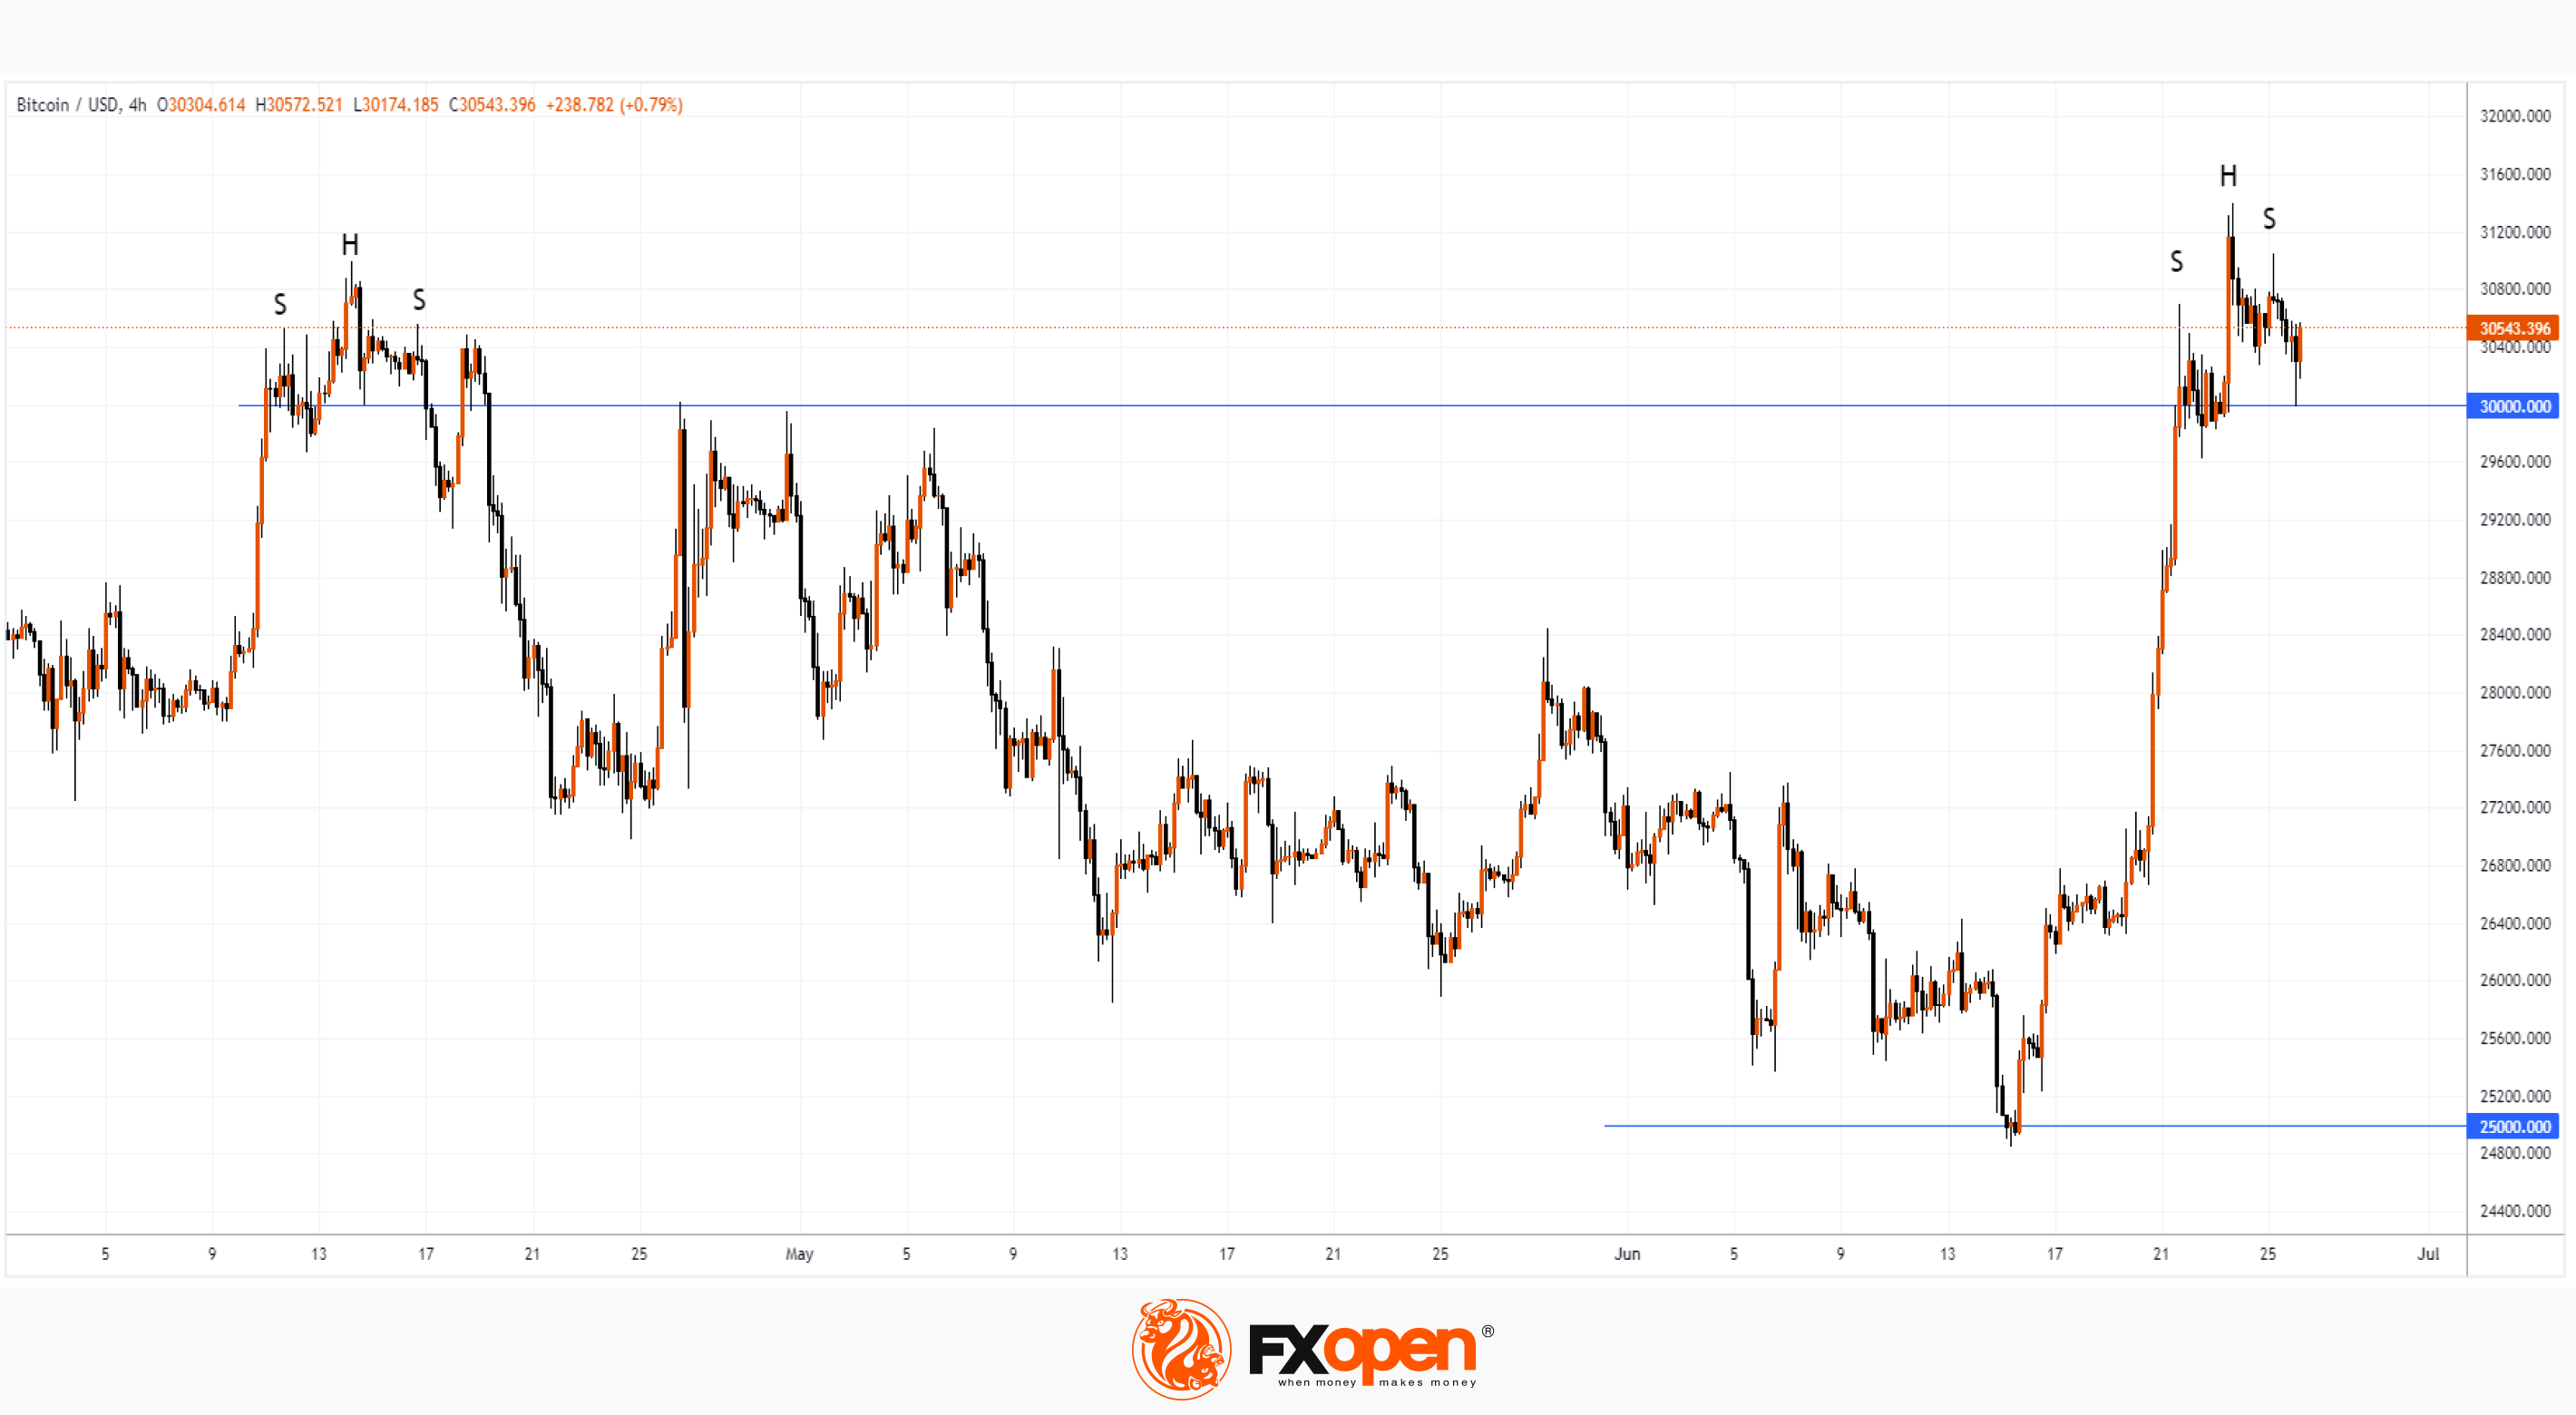
After skyrocketing last week for the 3 reasons we wrote about earlier, the price of bitcoin hit a 2023 high on Friday, surpassing USD 31,400 per bitcoin. This was facilitated by the news that the SEC approved the first exchange-traded fund (ETF) of bitcoin futures with leverage.
In April, the bulls were already above the psychological level of USD 30k per bitcoin, but after that a pullback followed, culminating in the price dropping below the psychological level of USD 25k per bitcoin. The BTC/USD market once again emphasized the emotionality of its participants — this is how you can interpret the tendency of the bitcoin exchange rate to the US dollar to make reversals after the breakdown of psychological levels.
What will happen next? Will the price of bitcoin follow the June breakdown according to the rollback scenario that was realized after the April breakdown? The probability of this is indicated by the bearish SHS patterns (head-and-shoulders), which formed when the price of bitcoin exceeded the level of 30k. You may also have deja vu, as the 2 peaks above 30k in 2023 resemble the 2 peaks (in April and November) above 60k in 2021.
The ability of the price of bitcoin to recover from declines under the 30k level (if any) will give more evidence that the bull market is indeed sustainable.
To benefit from the rise and fall of the price of bitcoin and other cryptocurrencies, consider enlisting the services of a reliable broker like FXOpen.
⚠️
CFDs are complex instruments and come with a high risk of losing your money.
This article represents the opinion of the Companies operating under the FXOpen brand only. It is not to be construed as an offer, solicitation, or recommendation with respect to products and services provided by the Companies operating under the FXOpen brand, nor is it to be considered financial advice.
At FXOpen UK and FXOpen AU, Cryptocurrency CFDs are only available for trading by those clients categorised as Professional clients under FCA Rules and Professional clients under ASIC Rules, respectively. They are not available for trading by Retail clients.
Market Analysis: The Price of Bitcoin Updates the Maximum of the Year, What's Next?
After skyrocketing last week for the 3 reasons we wrote about earlier, the price of bitcoin hit a 2023 high on Friday, surpassing USD 31,400 per bitcoin. This was facilitated by the news that the SEC approved the first exchange-traded fund (ETF) of bitcoin futures with leverage.
In April, the bulls were already above the psychological level of USD 30k per bitcoin, but after that a pullback followed, culminating in the price dropping below the psychological level of USD 25k per bitcoin. The BTC/USD market once again emphasized the emotionality of its participants — this is how you can interpret the tendency of the bitcoin exchange rate to the US dollar to make reversals after the breakdown of psychological levels.
What will happen next? Will the price of bitcoin follow the June breakdown according to the rollback scenario that was realized after the April breakdown? The probability of this is indicated by the bearish SHS patterns (head-and-shoulders), which formed when the price of bitcoin exceeded the level of 30k. You may also have deja vu, as the 2 peaks above 30k in 2023 resemble the 2 peaks (in April and November) above 60k in 2021.
The ability of the price of bitcoin to recover from declines under the 30k level (if any) will give more evidence that the bull market is indeed sustainable.
To benefit from the rise and fall of the price of bitcoin and other cryptocurrencies, consider enlisting the services of a reliable broker like FXOpen.
⚠️
CFDs are complex instruments and come with a high risk of losing your money.
This article represents the opinion of the Companies operating under the FXOpen brand only. It is not to be construed as an offer, solicitation, or recommendation with respect to products and services provided by the Companies operating under the FXOpen brand, nor is it to be considered financial advice.
At FXOpen UK and FXOpen AU, Cryptocurrency CFDs are only available for trading by those clients categorised as Professional clients under FCA Rules and Professional clients under ASIC Rules, respectively. They are not available for trading by Retail clients.
#MarketNews
Market Analysis: GBP/USD Eyes Fresh Increase, USD/CAD Could Extend Losses
🔸The British Pound started a downside correction below the 1.2845 zone.
🔸There is a key bearish trend line forming with resistance near 1.2740 on the hourly chart of GBP/USD at FXOpen.
🔸USD/CAD declined below the 1.3210 and 1.3185 support levels.
🔸A connecting bearish trend line is forming with resistance near 1.3185 on the hourly chart at FXOpen.
https://cutt.ly/NwysBxYf
To take advantage of price fluctuations in the foreign exchange markets, consider enlisting the services of a reliable broker like FXOpen.
⚠️
This forecast represents FXOpen Companies opinion only, it should not be construed as an offer, invitation or recommendation in respect to FXOpen Companies products and services or as financial advice
Market Analysis: GBP/USD Eyes Fresh Increase, USD/CAD Could Extend Losses
🔸The British Pound started a downside correction below the 1.2845 zone.
🔸There is a key bearish trend line forming with resistance near 1.2740 on the hourly chart of GBP/USD at FXOpen.
🔸USD/CAD declined below the 1.3210 and 1.3185 support levels.
🔸A connecting bearish trend line is forming with resistance near 1.3185 on the hourly chart at FXOpen.
https://cutt.ly/NwysBxYf
To take advantage of price fluctuations in the foreign exchange markets, consider enlisting the services of a reliable broker like FXOpen.
⚠️
This forecast represents FXOpen Companies opinion only, it should not be construed as an offer, invitation or recommendation in respect to FXOpen Companies products and services or as financial advice
Market Pulse
GBP/USD Eyes Fresh Increase, USD/CAD Could Extend Losses
USD/CAD is struggling below 1.3210 and might decline further.
#MarketNews #stockmarket #stocktrading
Market Analysis: Yield Curve and Stock Market Downside Risks
The yield curve compares three-month, two-year, five-year, 10-year and 30-year US Treasury bonds. Under a normal curve, the longer the maturity, the higher the yield.
However, analysts at Crescat Capital point to an inversion in the current bond market — yields on short-term bonds are clearly higher. This can be used as a harbinger of a sharp decline in the price of stock indices, as history shows: the inversion was observed before the crisis of 2008, during the dot-com bubble in 2000, and even during the sharp decline in the price of the S&P 500 during the pandemic in 2020.
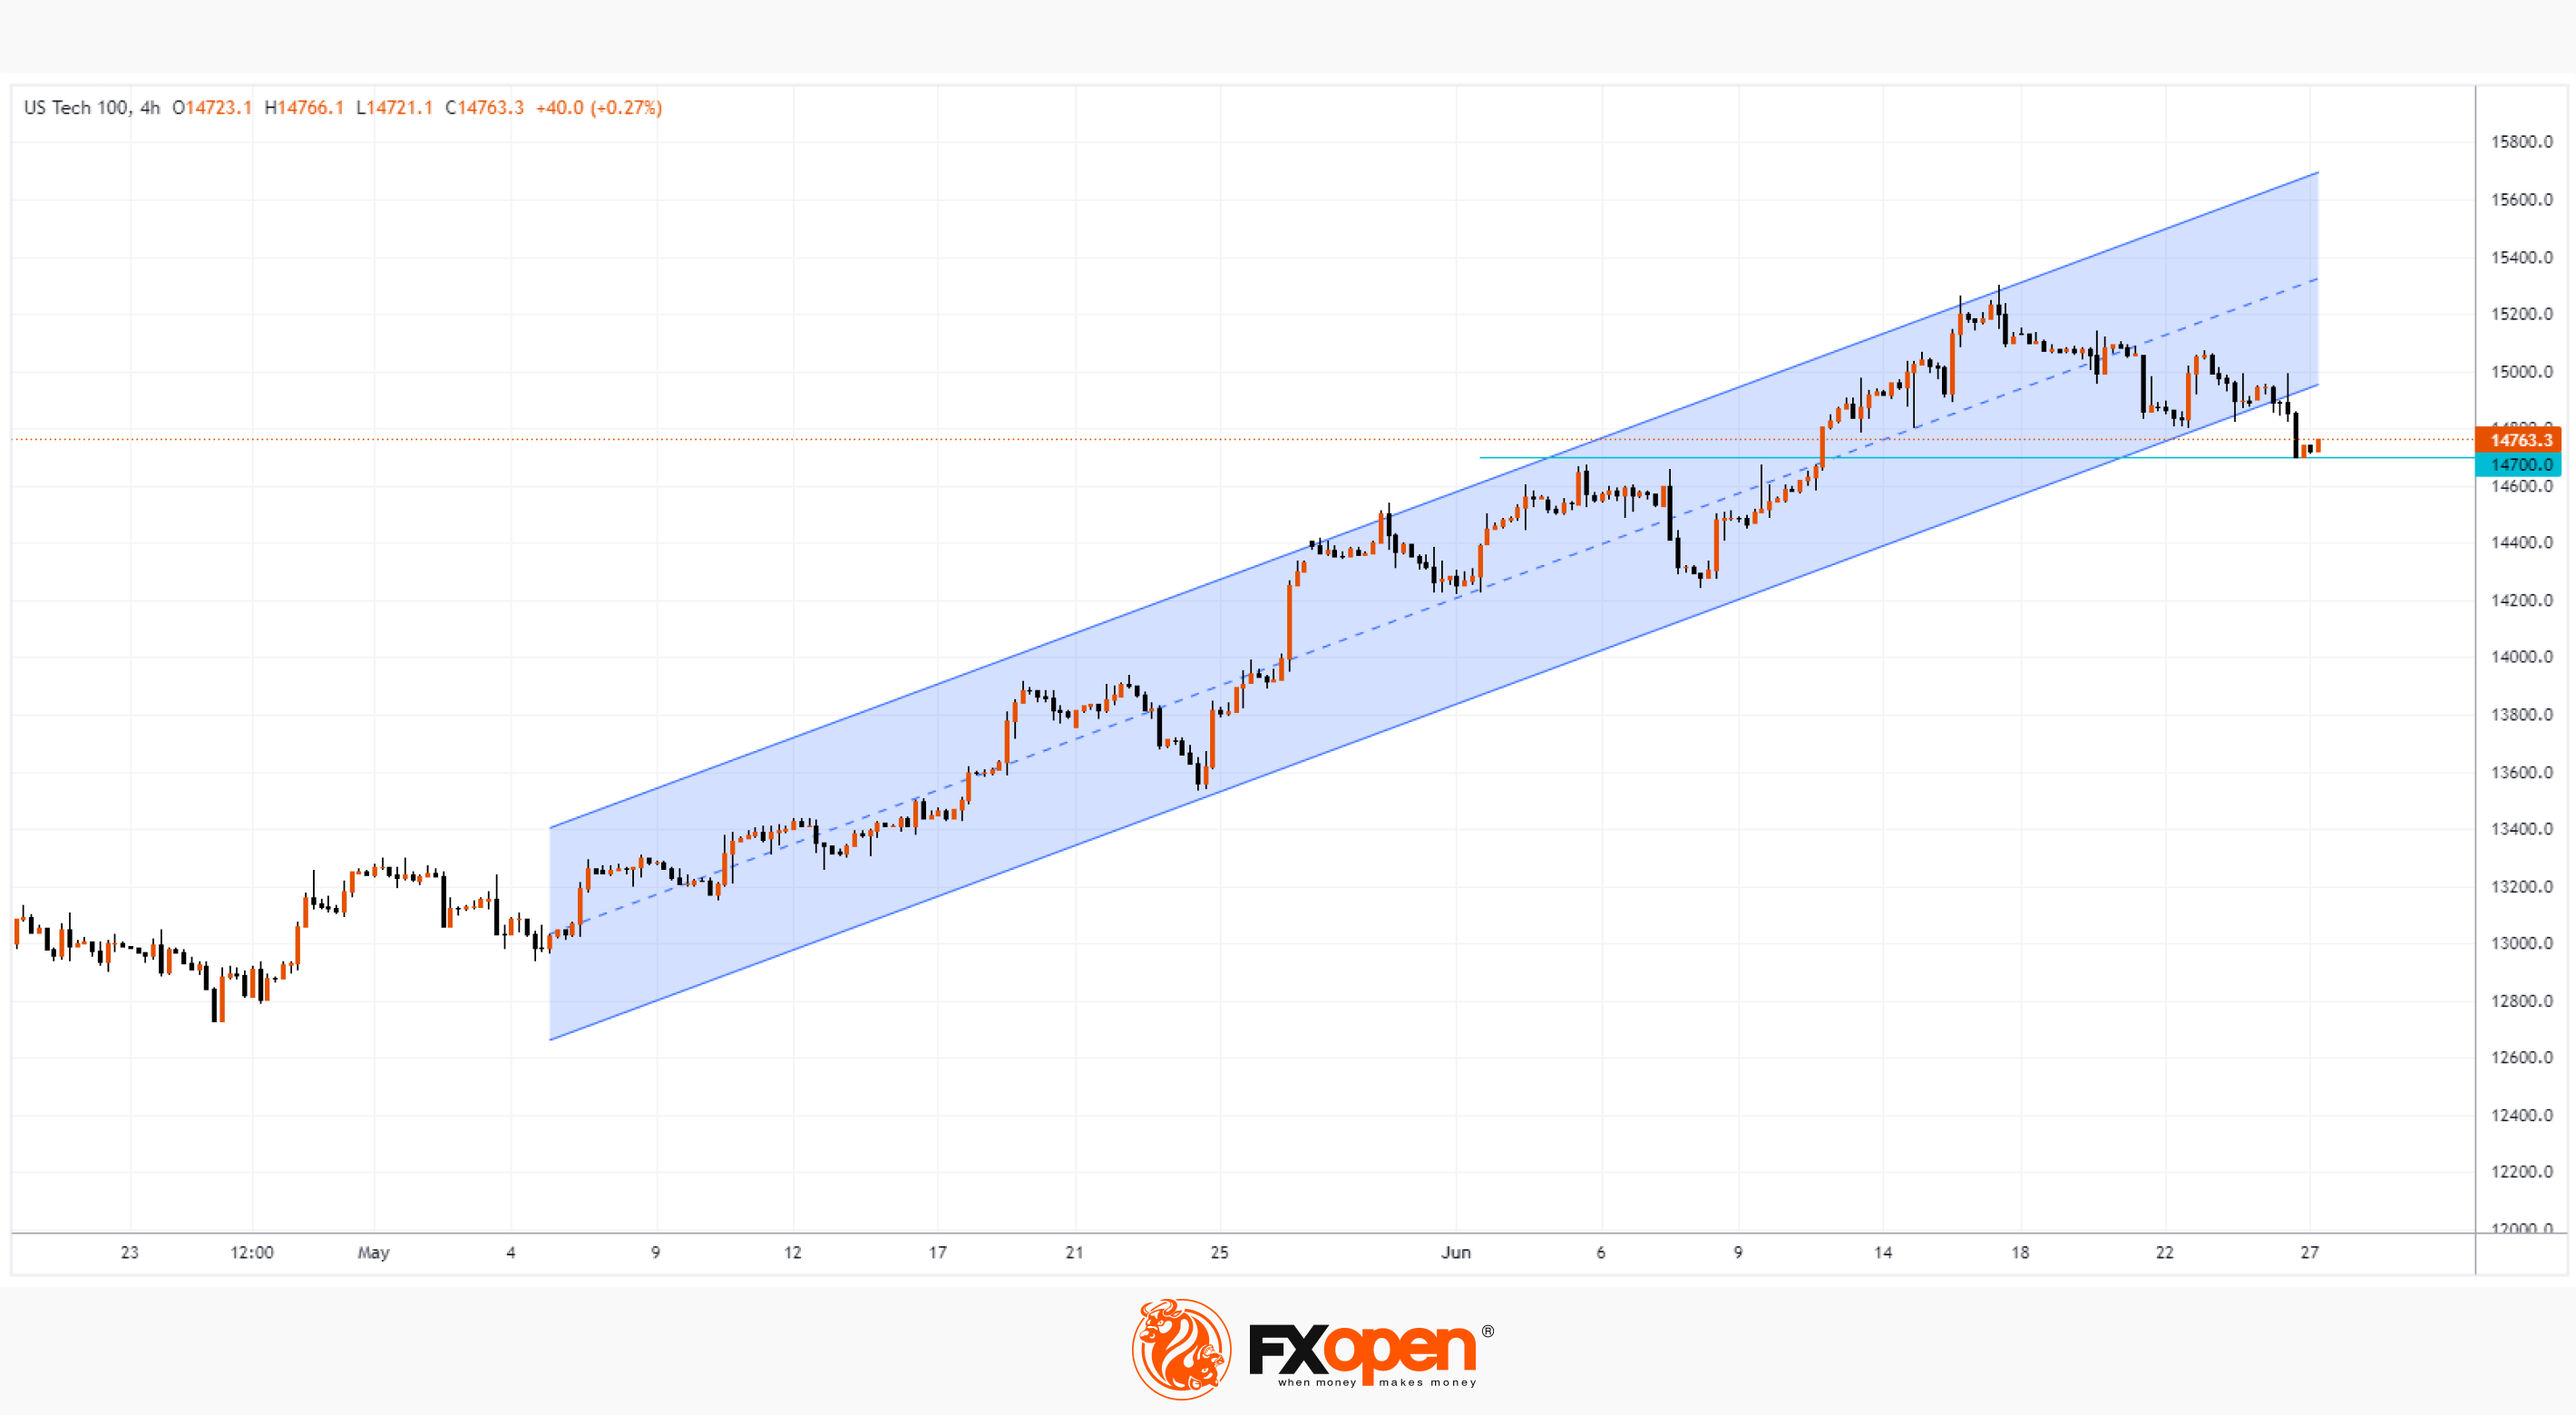
At the same time, the danger may lie primarily for the technology stocks included in the Nasdaq 100, because this market feels the hype due to AI. So, during yesterday's trading, futures for technology stocks E-mini Nasdaq 100 fell much faster than the E-mini S&P 500.
The Nasdaq 100 chart is also showing alarming signals. The price of the index broke down the channel (shown in blue) of the uptrend, which has been operating on the market since May. So far, the bulls are feeling support from the 14,700 level, which served as resistance earlier this month. But the support could be short-lived and the market could become bearish, adding to the urgency of the yield curve warning.
To benefit from the rise and fall of the Nasdaq 100 and other stock indices, consider enlisting the services of a reliable broker like FXOpen.
⚠️
CFDs are complex instruments and come with a high risk of losing your money.
This article represents the opinion of the Companies operating under the FXOpen brand only. It is not to be construed as an offer, solicitation, or recommendation with respect to products and services provided by the Companies operating under the FXOpen brand, nor is it to be considered financial advice.
Market Analysis: Yield Curve and Stock Market Downside Risks
The yield curve compares three-month, two-year, five-year, 10-year and 30-year US Treasury bonds. Under a normal curve, the longer the maturity, the higher the yield.
However, analysts at Crescat Capital point to an inversion in the current bond market — yields on short-term bonds are clearly higher. This can be used as a harbinger of a sharp decline in the price of stock indices, as history shows: the inversion was observed before the crisis of 2008, during the dot-com bubble in 2000, and even during the sharp decline in the price of the S&P 500 during the pandemic in 2020.
At the same time, the danger may lie primarily for the technology stocks included in the Nasdaq 100, because this market feels the hype due to AI. So, during yesterday's trading, futures for technology stocks E-mini Nasdaq 100 fell much faster than the E-mini S&P 500.
The Nasdaq 100 chart is also showing alarming signals. The price of the index broke down the channel (shown in blue) of the uptrend, which has been operating on the market since May. So far, the bulls are feeling support from the 14,700 level, which served as resistance earlier this month. But the support could be short-lived and the market could become bearish, adding to the urgency of the yield curve warning.
To benefit from the rise and fall of the Nasdaq 100 and other stock indices, consider enlisting the services of a reliable broker like FXOpen.
⚠️
CFDs are complex instruments and come with a high risk of losing your money.
This article represents the opinion of the Companies operating under the FXOpen brand only. It is not to be construed as an offer, solicitation, or recommendation with respect to products and services provided by the Companies operating under the FXOpen brand, nor is it to be considered financial advice.
#MarketNews #forex #usdollar
Market Analysis. USD/CAD: Low of the Year
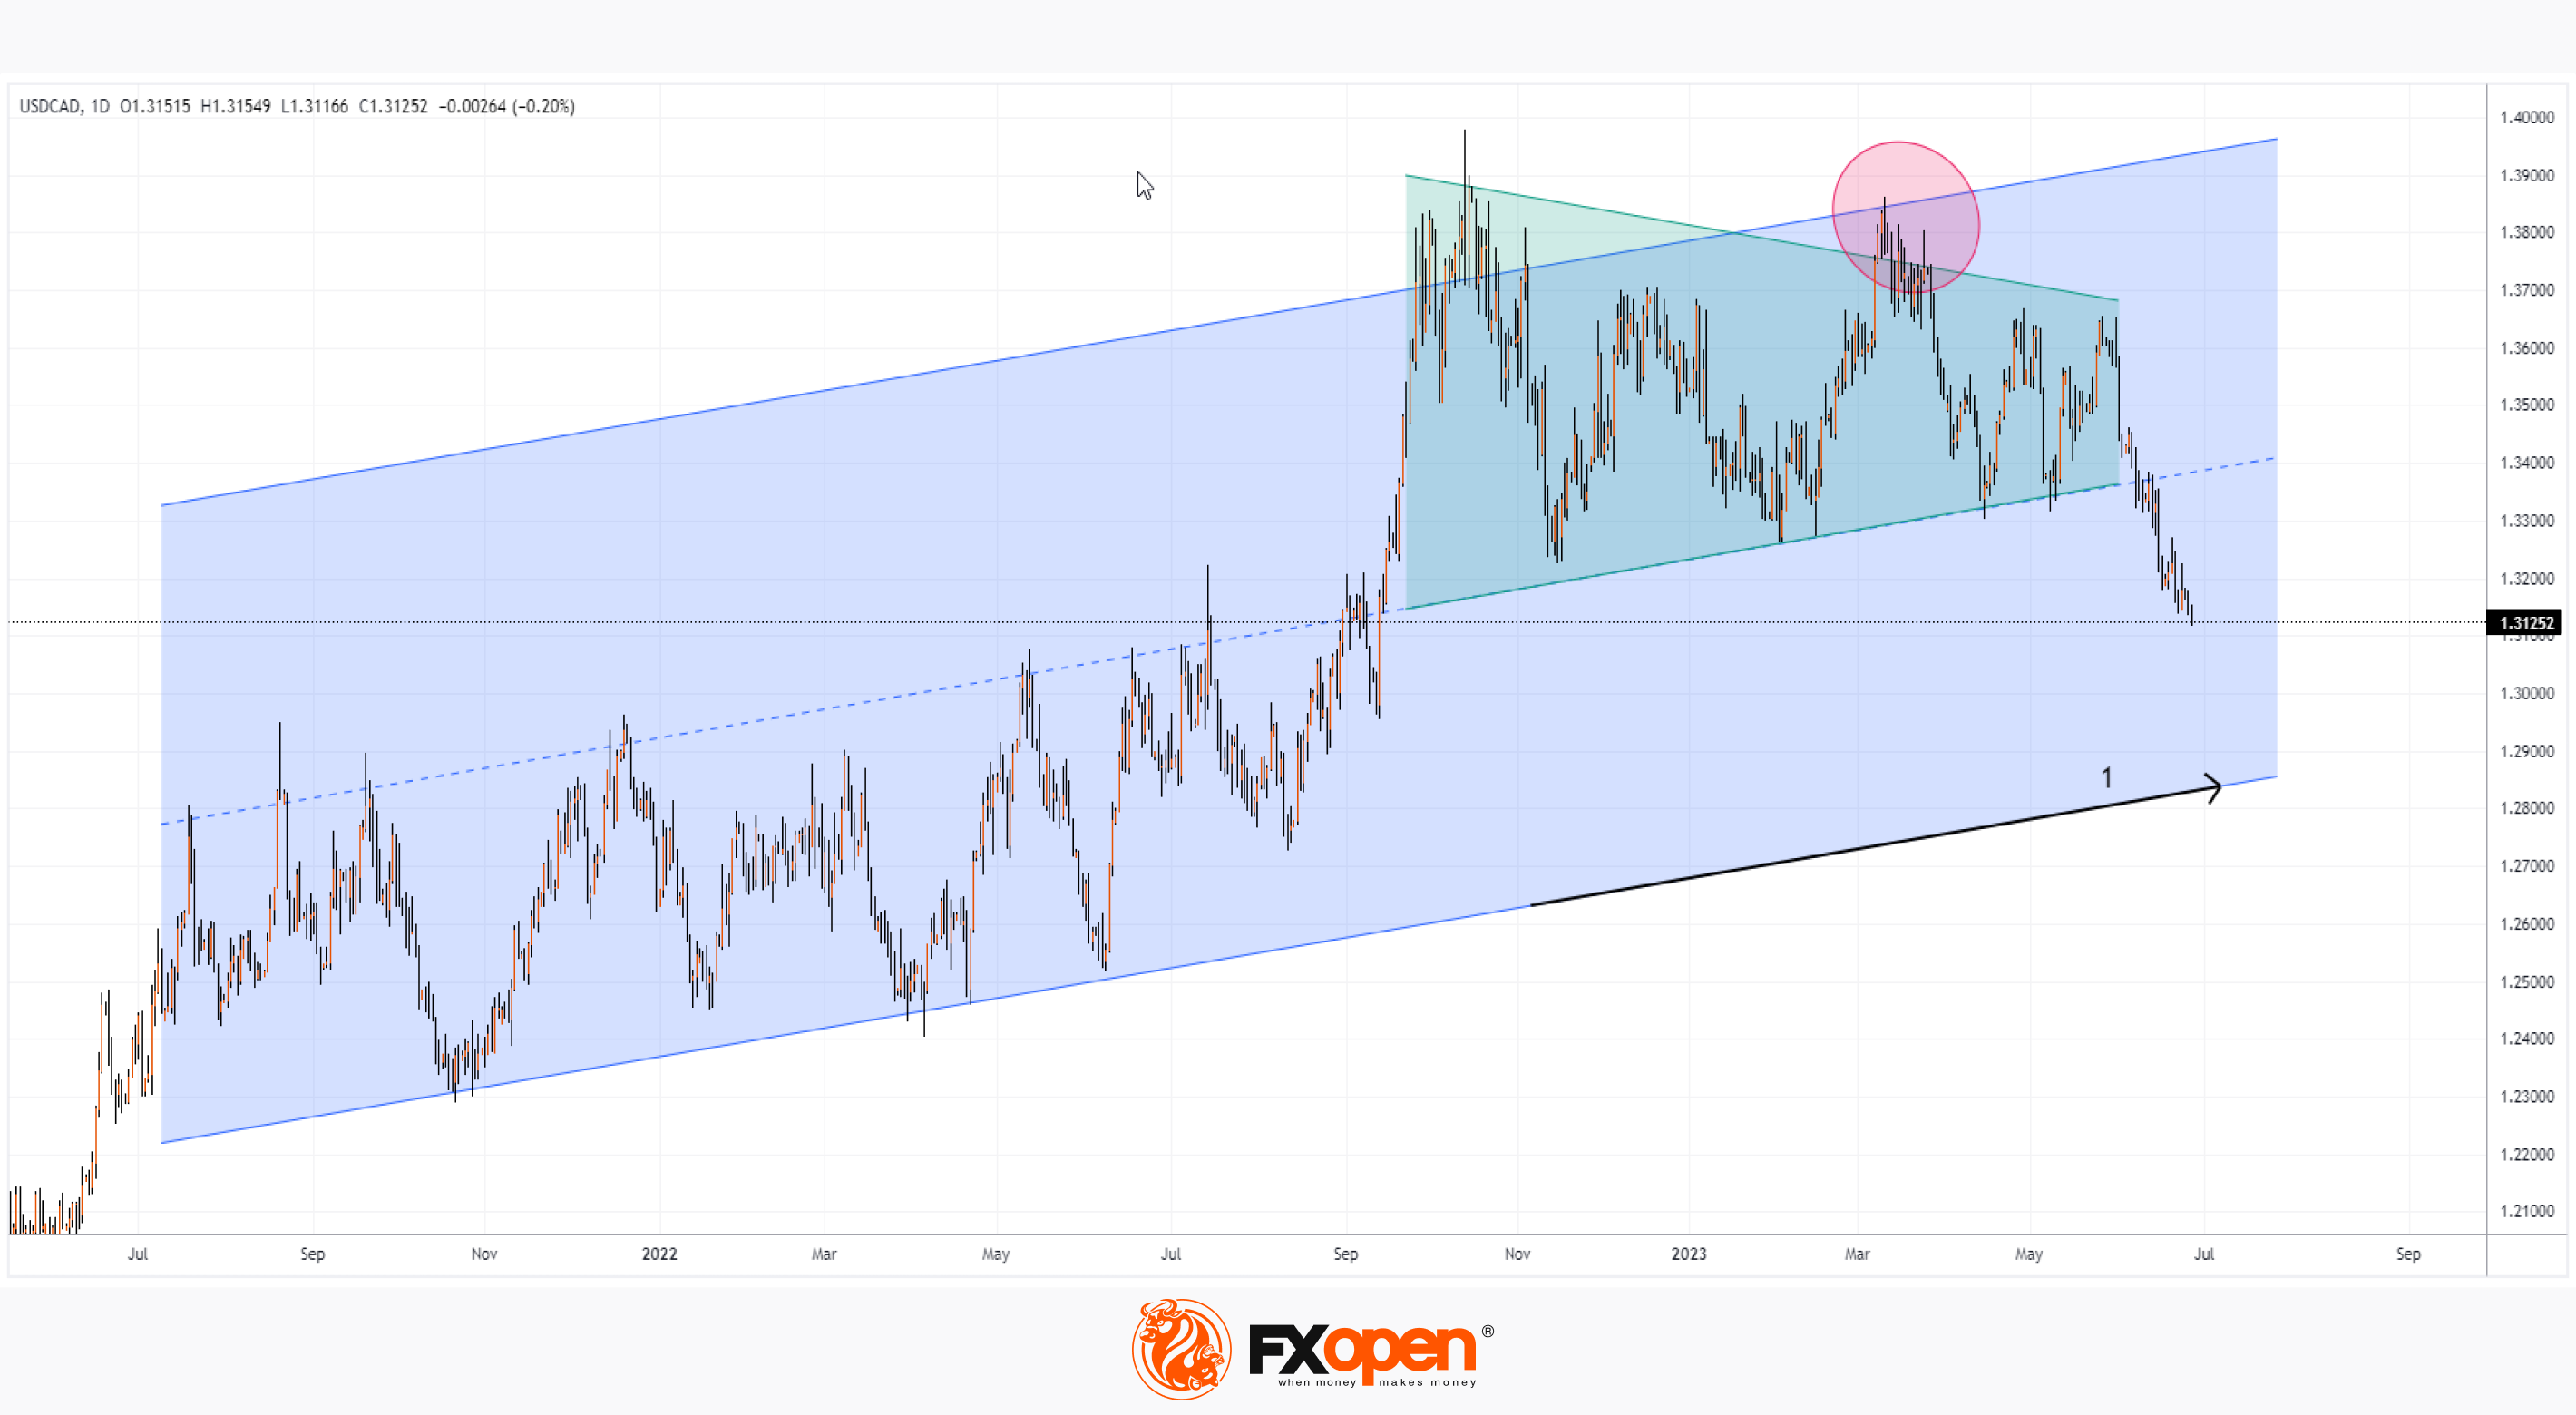
USD/CAD fell below 1.3130 this morning, a level not seen since September 2022. The strength of the Canadian dollar can be justified, among other things, by the fact that the inflation rate in Canada is lower than in the US.
In April, we wrote that a false bullish break (indicated by a circle) of a triangle (shown in green) could indicate that a genuine break would occur in a bearish direction and set a downtrend in the USD/CAD market. And so it happened.
Today's news on inflation in Canada (15:30 GMT+3) may significantly affect the dynamics of the current downtrend, which, if continued, has the prospect of reaching the bottom line (1) of the long-term channel.
To benefit from the rise and fall of USD/CAD and other currencies, consider enlisting the services of a reliable broker like FXOpen.
⚠️
CFDs are complex instruments and come with a high risk of losing your money.
This article represents the opinion of the Companies operating under the FXOpen brand only. It is not to be construed as an offer, solicitation, or recommendation with respect to products and services provided by the Companies operating under the FXOpen brand, nor is it to be considered financial advice.
Market Analysis. USD/CAD: Low of the Year
USD/CAD fell below 1.3130 this morning, a level not seen since September 2022. The strength of the Canadian dollar can be justified, among other things, by the fact that the inflation rate in Canada is lower than in the US.
In April, we wrote that a false bullish break (indicated by a circle) of a triangle (shown in green) could indicate that a genuine break would occur in a bearish direction and set a downtrend in the USD/CAD market. And so it happened.
Today's news on inflation in Canada (15:30 GMT+3) may significantly affect the dynamics of the current downtrend, which, if continued, has the prospect of reaching the bottom line (1) of the long-term channel.
To benefit from the rise and fall of USD/CAD and other currencies, consider enlisting the services of a reliable broker like FXOpen.
⚠️
CFDs are complex instruments and come with a high risk of losing your money.
This article represents the opinion of the Companies operating under the FXOpen brand only. It is not to be construed as an offer, solicitation, or recommendation with respect to products and services provided by the Companies operating under the FXOpen brand, nor is it to be considered financial advice.
#MarketNews #forex
Market Analysis. GBP/JPY: Highs Since December 2015
The GBP/JPY chart shows that this currency pair is in an uptrend (nearly +17% YTD) which can be explained by differences in economies. While the UK is fighting a rate hike against inflation (which has shown double digits), Japan continues to pursue an ultra-soft monetary policy.
Technically, the bulls still have a chance to reach the upper boundary of the channel (shown in blue), where the psychological resistance level of 190 yen per pound passes, but the situation may change:
→ First, the Japanese authorities are concerned. “We closely monitor the movement of the currency. We will respond appropriately if it becomes excessive,” Vice Finance Minister and Chief Currency Strategist Masato Kanda said today. Recall that the Bank of Japan has already taken interventions in the foreign exchange market to support the yen in September and October last year — and this has yielded results.
→ Secondly, the bullish momentum for the pound may weaken. Bank of America analysts' forecast for the pound is one of the most pessimistic among the G10. In their opinion, the fight against inflation in the UK will be the strongest, and the risk of a hard landing has increased.
(!) Please note that today at 16:30 GMT+3 speeches of the heads of central banks, including those of Japan and Great Britain, are scheduled. Get ready for a surge in volatility.
To benefit from the movement of the GBP/JPY and other currencies, consider enlisting the services of a reliable broker like FXOpen.
⚠️
CFDs are complex instruments and come with a high risk of losing your money.
This article represents the opinion of the Companies operating under the FXOpen brand only. It is not to be construed as an offer, solicitation, or recommendation with respect to products and services provided by the Companies operating under the FXOpen brand, nor is it to be considered financial advice.
Market Analysis. GBP/JPY: Highs Since December 2015
The GBP/JPY chart shows that this currency pair is in an uptrend (nearly +17% YTD) which can be explained by differences in economies. While the UK is fighting a rate hike against inflation (which has shown double digits), Japan continues to pursue an ultra-soft monetary policy.
Technically, the bulls still have a chance to reach the upper boundary of the channel (shown in blue), where the psychological resistance level of 190 yen per pound passes, but the situation may change:
→ First, the Japanese authorities are concerned. “We closely monitor the movement of the currency. We will respond appropriately if it becomes excessive,” Vice Finance Minister and Chief Currency Strategist Masato Kanda said today. Recall that the Bank of Japan has already taken interventions in the foreign exchange market to support the yen in September and October last year — and this has yielded results.
→ Secondly, the bullish momentum for the pound may weaken. Bank of America analysts' forecast for the pound is one of the most pessimistic among the G10. In their opinion, the fight against inflation in the UK will be the strongest, and the risk of a hard landing has increased.
(!) Please note that today at 16:30 GMT+3 speeches of the heads of central banks, including those of Japan and Great Britain, are scheduled. Get ready for a surge in volatility.
To benefit from the movement of the GBP/JPY and other currencies, consider enlisting the services of a reliable broker like FXOpen.
⚠️
CFDs are complex instruments and come with a high risk of losing your money.
This article represents the opinion of the Companies operating under the FXOpen brand only. It is not to be construed as an offer, solicitation, or recommendation with respect to products and services provided by the Companies operating under the FXOpen brand, nor is it to be considered financial advice.

#MarketNews #forex #tradingforex
Market Analysis: EUR/USD Resumes And USD/JPY Could Extend Rally
🔸 The Euro is rising and trading well above the 1.0925 resistance zone.
🔸 There is a key bullish trend line forming with support near 1.0940 on the hourly chart of EUR/USD at FXOpen.
🔸 USD/JPY is trading in a positive zone above the 143.40 and 143.70 levels.
🔸 There is a major bullish trend line forming with support near 143.70 on the hourly chart at FXOpen.
https://cutt.ly/CwyILz8r
To take advantage of price fluctuations in the foreign exchange markets, consider enlisting the services of a reliable broker like FXOpen.
⚠️
This forecast represents FXOpen Companies opinion only, it should not be construed as an offer, invitation or recommendation in respect to FXOpen Companies products and services or as financial advice
Market Analysis: EUR/USD Resumes And USD/JPY Could Extend Rally
🔸 The Euro is rising and trading well above the 1.0925 resistance zone.
🔸 There is a key bullish trend line forming with support near 1.0940 on the hourly chart of EUR/USD at FXOpen.
🔸 USD/JPY is trading in a positive zone above the 143.40 and 143.70 levels.
🔸 There is a major bullish trend line forming with support near 143.70 on the hourly chart at FXOpen.
https://cutt.ly/CwyILz8r
To take advantage of price fluctuations in the foreign exchange markets, consider enlisting the services of a reliable broker like FXOpen.
⚠️
This forecast represents FXOpen Companies opinion only, it should not be construed as an offer, invitation or recommendation in respect to FXOpen Companies products and services or as financial advice
Market Pulse
Market Analysis: EUR/USD Resumes And USD/JPY Could Extend Rally
EUR/USD started a fresh increase above the 1.0890 resistance. USD/JPY is consolidating gains and might rally further above 144.20.
#MarketNews #AAPL #stockmarket
Market Analysis: AAPL Share Price Hits All-time High
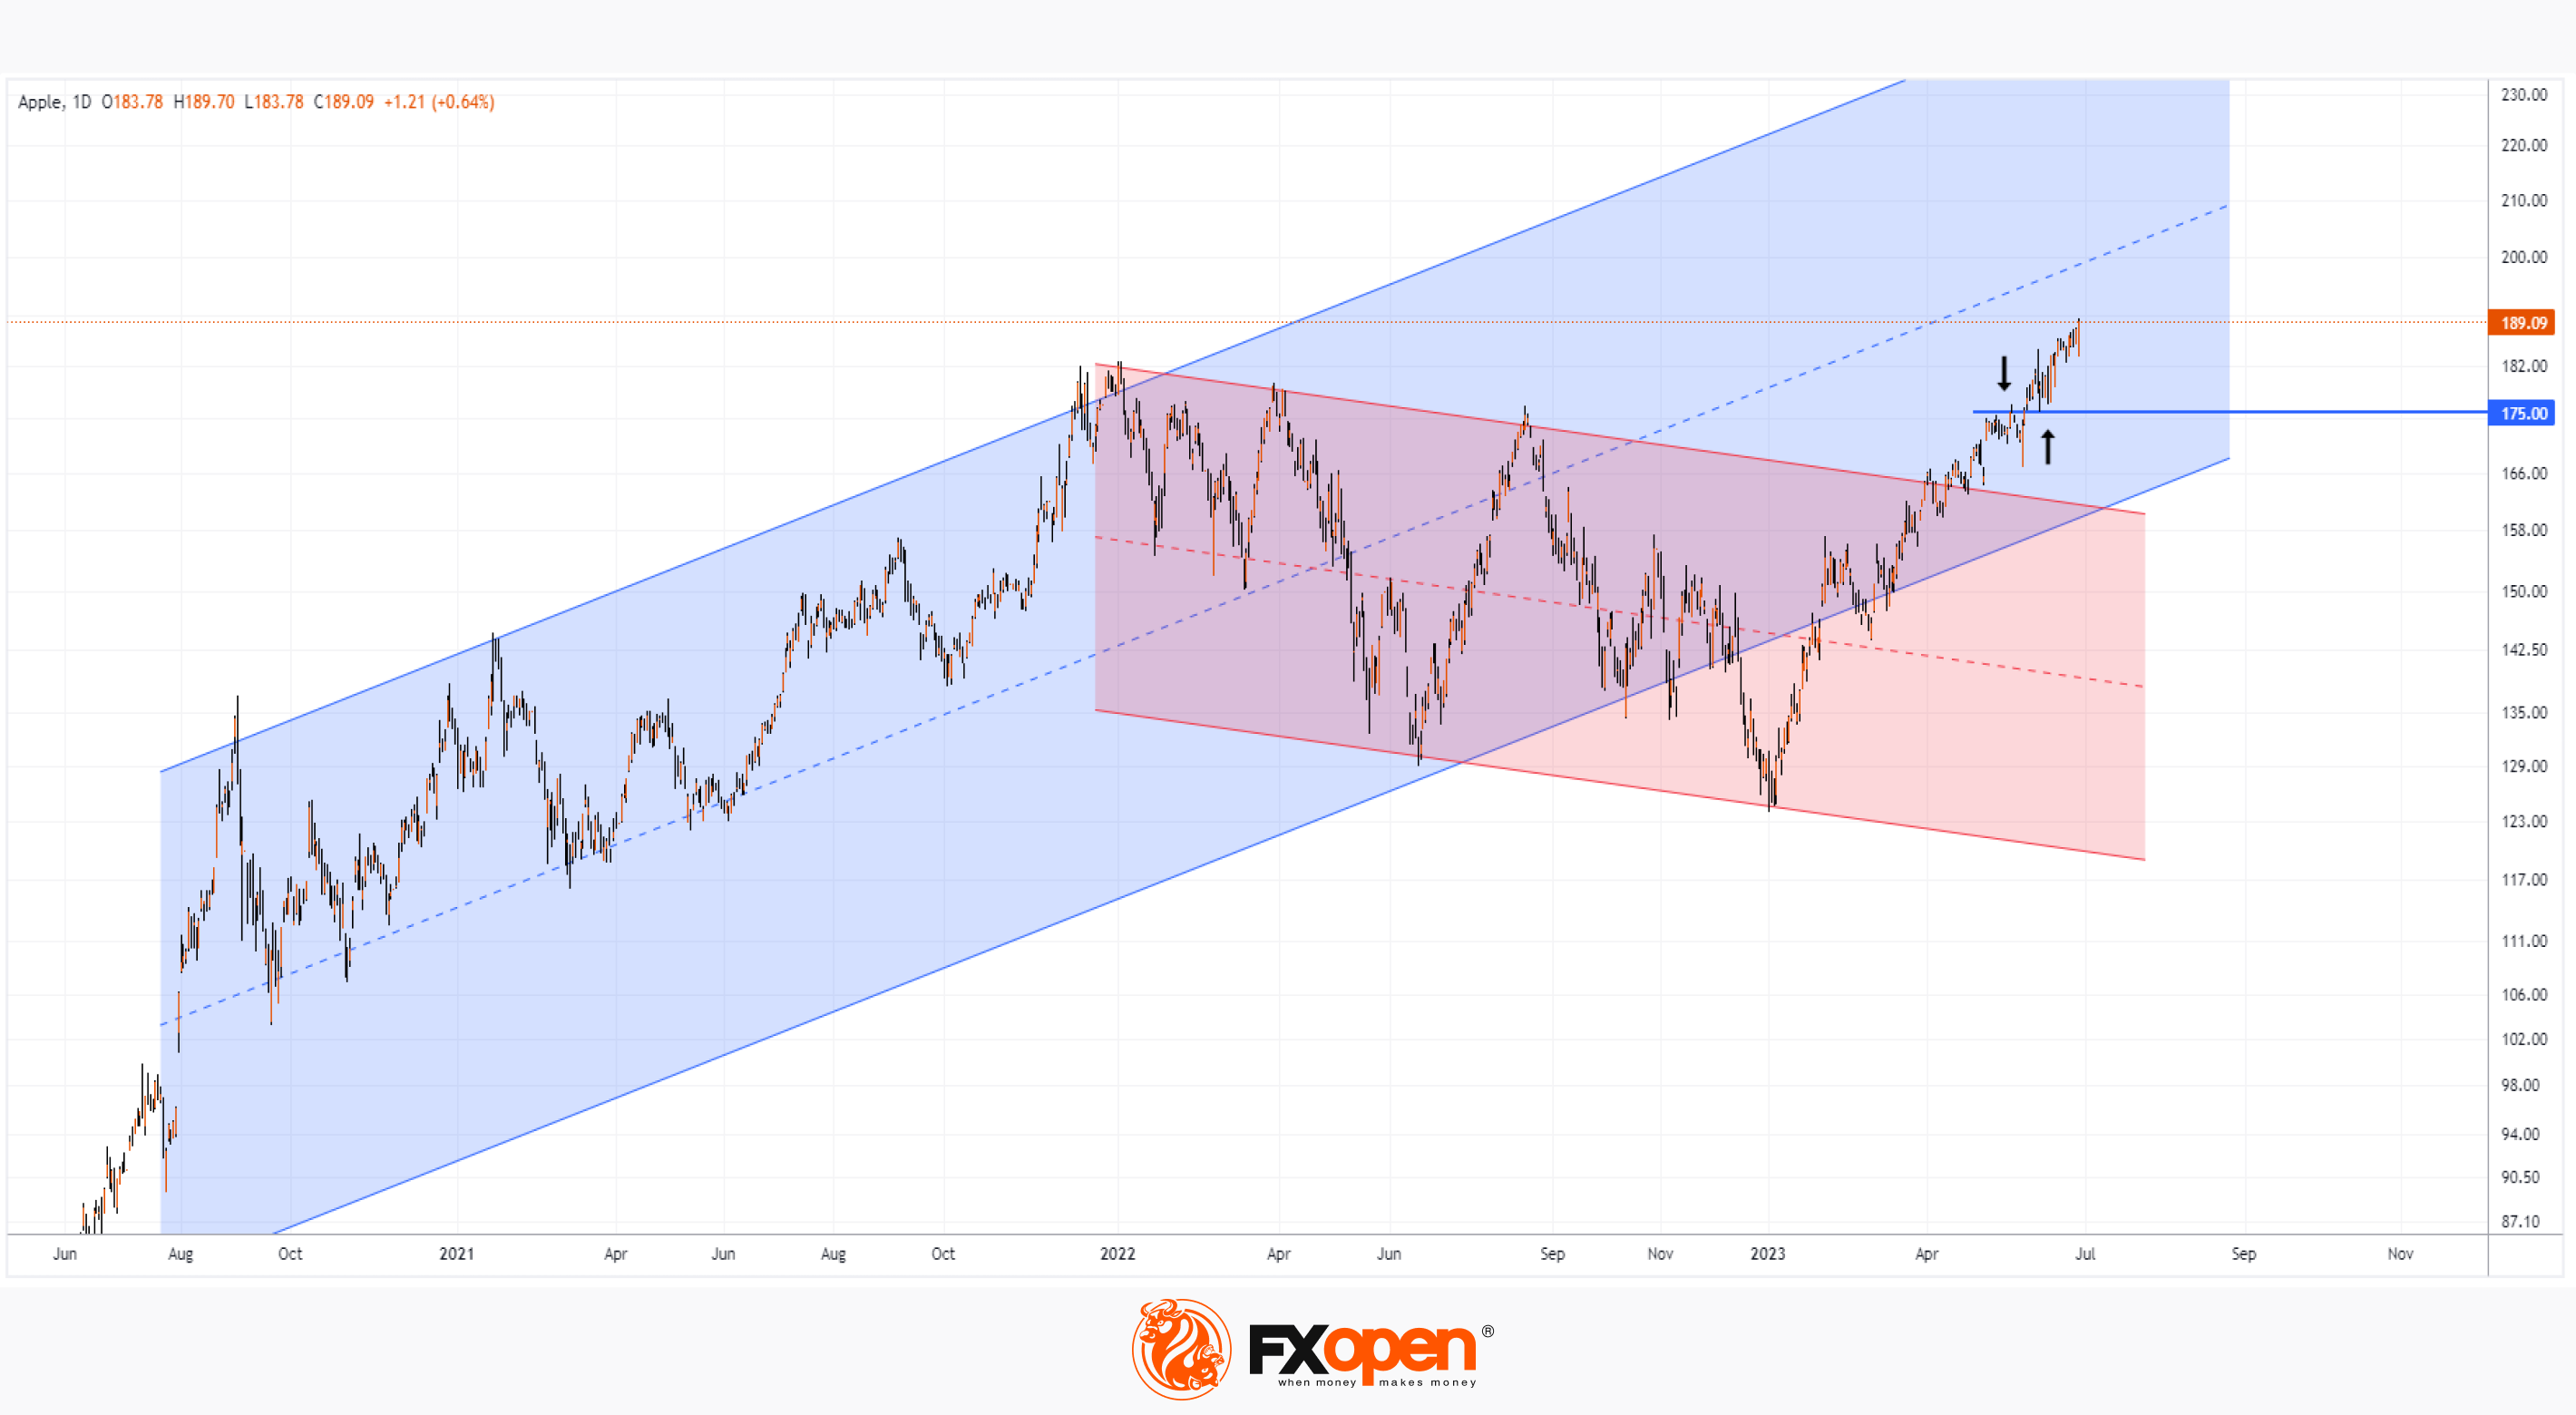
AAPL's price topped USD 189/share yesterday, coming close to the psychological USD 190/share level. Since the beginning of the year, the AAPL price has risen by about 50%.
The bullish momentum is fueled by both the AI hype and the improvement in Apple's product line:
→ Apple Watch Ultra and iPhone 15 expected this fall.
→ According to CNBC, the company is working on a second-generation Vision Pro, as well as a cheaper model of a virtual reality helmet.
→ The line of laptops will be replenished with models with the M3 processor.
The AAPL stock chart shows that the price has said goodbye to the down channel (shown in red), showing a strong pattern near the USD 175 level — first acting as resistance, then providing support (indicated by arrows).
If the bullish momentum continues, we will soon see the company's capitalization reach USD 3 trillion.
Of the 42 analysts surveyed by MarketWatch, only 1 gives a sell rating to AAPL stock. By the way, news about the increase in the target price of the AAPL share is likely to follow soon, its average value, according to analysts, is USD 187.19 today, which is already lower than the current values.
To benefit from the rise and fall of AAPL and other popular companies’ stocks, consider enlisting the services of a reliable broker like FXOpen.
⚠️
CFDs are complex instruments and come with a high risk of losing your money.
This article represents the opinion of the Companies operating under the FXOpen brand only. It is not to be construed as an offer, solicitation, or recommendation with respect to products and services provided by the Companies operating under the FXOpen brand, nor is it to be considered financial advice.
Market Analysis: AAPL Share Price Hits All-time High
AAPL's price topped USD 189/share yesterday, coming close to the psychological USD 190/share level. Since the beginning of the year, the AAPL price has risen by about 50%.
The bullish momentum is fueled by both the AI hype and the improvement in Apple's product line:
→ Apple Watch Ultra and iPhone 15 expected this fall.
→ According to CNBC, the company is working on a second-generation Vision Pro, as well as a cheaper model of a virtual reality helmet.
→ The line of laptops will be replenished with models with the M3 processor.
The AAPL stock chart shows that the price has said goodbye to the down channel (shown in red), showing a strong pattern near the USD 175 level — first acting as resistance, then providing support (indicated by arrows).
If the bullish momentum continues, we will soon see the company's capitalization reach USD 3 trillion.
Of the 42 analysts surveyed by MarketWatch, only 1 gives a sell rating to AAPL stock. By the way, news about the increase in the target price of the AAPL share is likely to follow soon, its average value, according to analysts, is USD 187.19 today, which is already lower than the current values.
To benefit from the rise and fall of AAPL and other popular companies’ stocks, consider enlisting the services of a reliable broker like FXOpen.
⚠️
CFDs are complex instruments and come with a high risk of losing your money.
This article represents the opinion of the Companies operating under the FXOpen brand only. It is not to be construed as an offer, solicitation, or recommendation with respect to products and services provided by the Companies operating under the FXOpen brand, nor is it to be considered financial advice.
#MarketNews #xauusd
Market Analysis: Gold Drops to 3-Month Low
Yesterday, a forum of heads of central banks was held, organized by the ECB, with speeches by Lagarde, Powell, Ueda, Bailey. In general (with the exception of Japan), according to bankers, they intend to maintain a tight monetary policy, not excluding new increases in interest rates, and plan that inflation will continue to decline.
Against the background of this information, the price of gold in dollars fell — perhaps because forecasts for lower inflation, according to market participants, reduce the value of gold as a "rescue" asset.
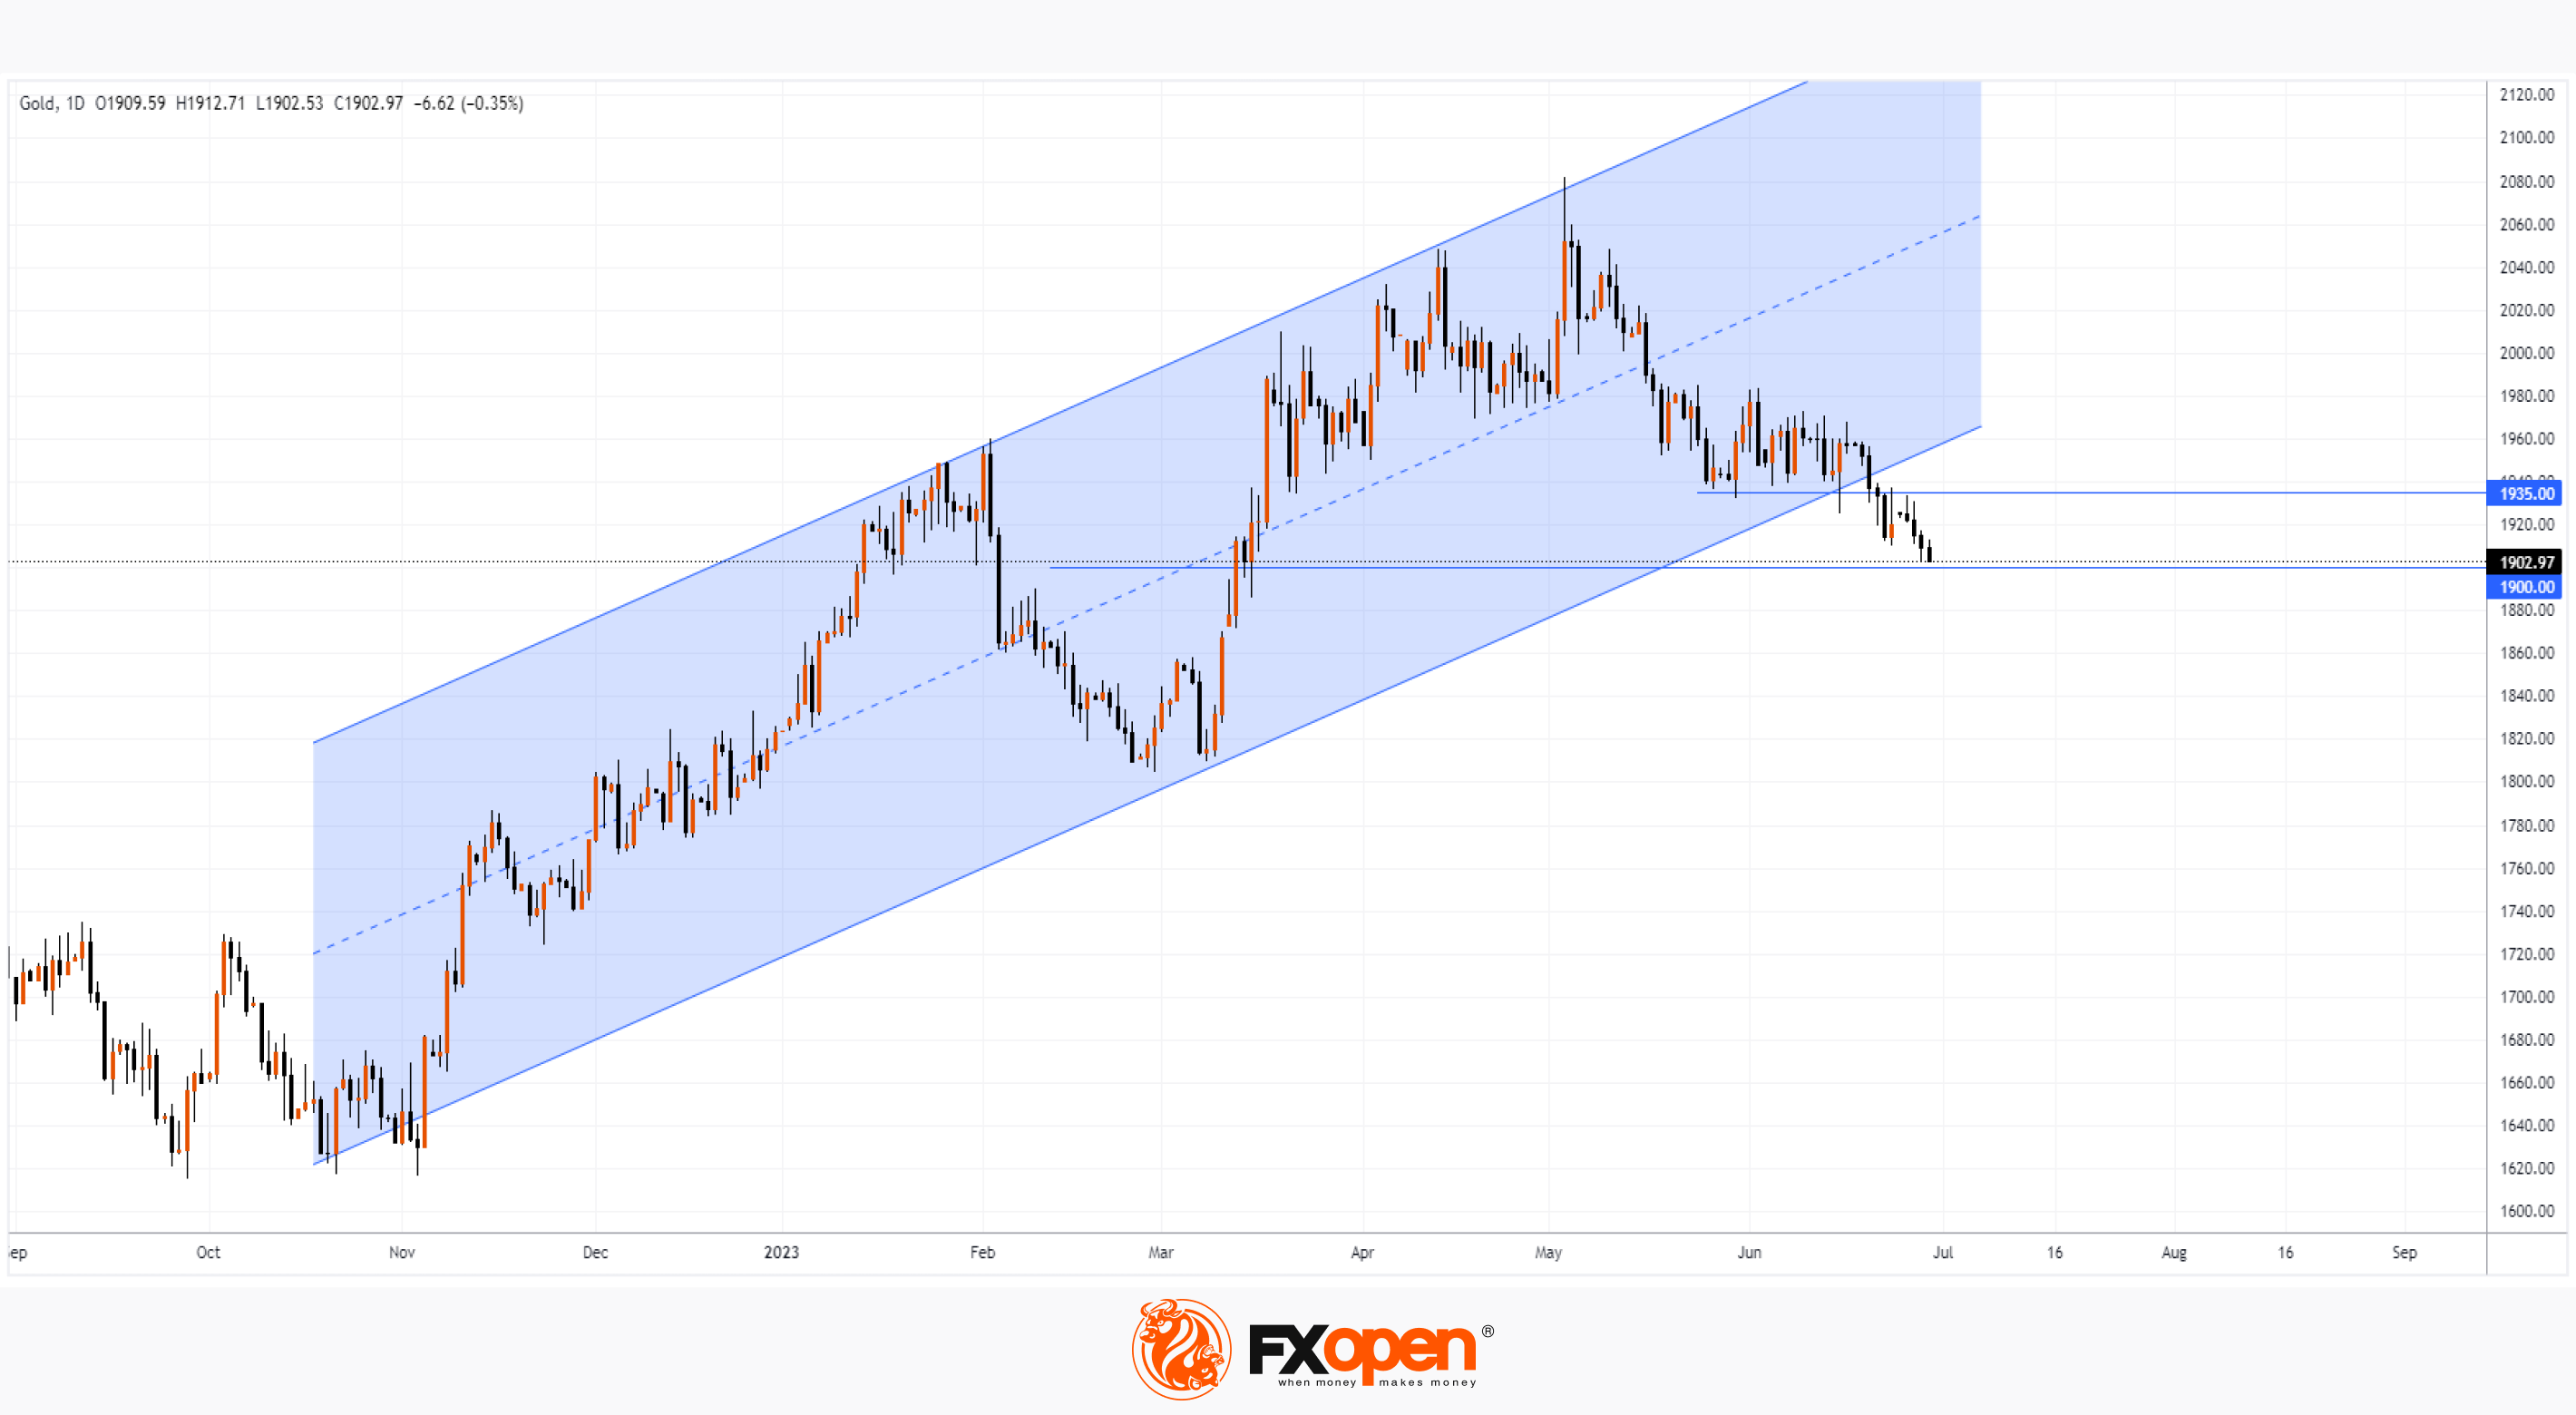
The XAU/USD price chart shows that it has made a bearish breakout of the ascending channel that has been in place since last fall and is approaching the psychological level of USD 1,900 per ounce. A rebound can be expected from this level — for example, to the resistance of 1,935 USD per ounce, which was still a pronounced support in early May.
To benefit from the trends in the price of XAU/USD gold and other financial instruments, consider enlisting the services of a reliable broker like FXOpen.
⚠️
CFDs are complex instruments and come with a high risk of losing your money.
This article represents the opinion of the Companies operating under the FXOpen brand only. It is not to be construed as an offer, solicitation, or recommendation with respect to products and services provided by the Companies operating under the FXOpen brand, nor is it to be considered financial advice.
Market Analysis: Gold Drops to 3-Month Low
Yesterday, a forum of heads of central banks was held, organized by the ECB, with speeches by Lagarde, Powell, Ueda, Bailey. In general (with the exception of Japan), according to bankers, they intend to maintain a tight monetary policy, not excluding new increases in interest rates, and plan that inflation will continue to decline.
Against the background of this information, the price of gold in dollars fell — perhaps because forecasts for lower inflation, according to market participants, reduce the value of gold as a "rescue" asset.
The XAU/USD price chart shows that it has made a bearish breakout of the ascending channel that has been in place since last fall and is approaching the psychological level of USD 1,900 per ounce. A rebound can be expected from this level — for example, to the resistance of 1,935 USD per ounce, which was still a pronounced support in early May.
To benefit from the trends in the price of XAU/USD gold and other financial instruments, consider enlisting the services of a reliable broker like FXOpen.
⚠️
CFDs are complex instruments and come with a high risk of losing your money.
This article represents the opinion of the Companies operating under the FXOpen brand only. It is not to be construed as an offer, solicitation, or recommendation with respect to products and services provided by the Companies operating under the FXOpen brand, nor is it to be considered financial advice.
#MarketNews #EURUSD
Market Analysis. EUR/USD: Double Bearish Pattern
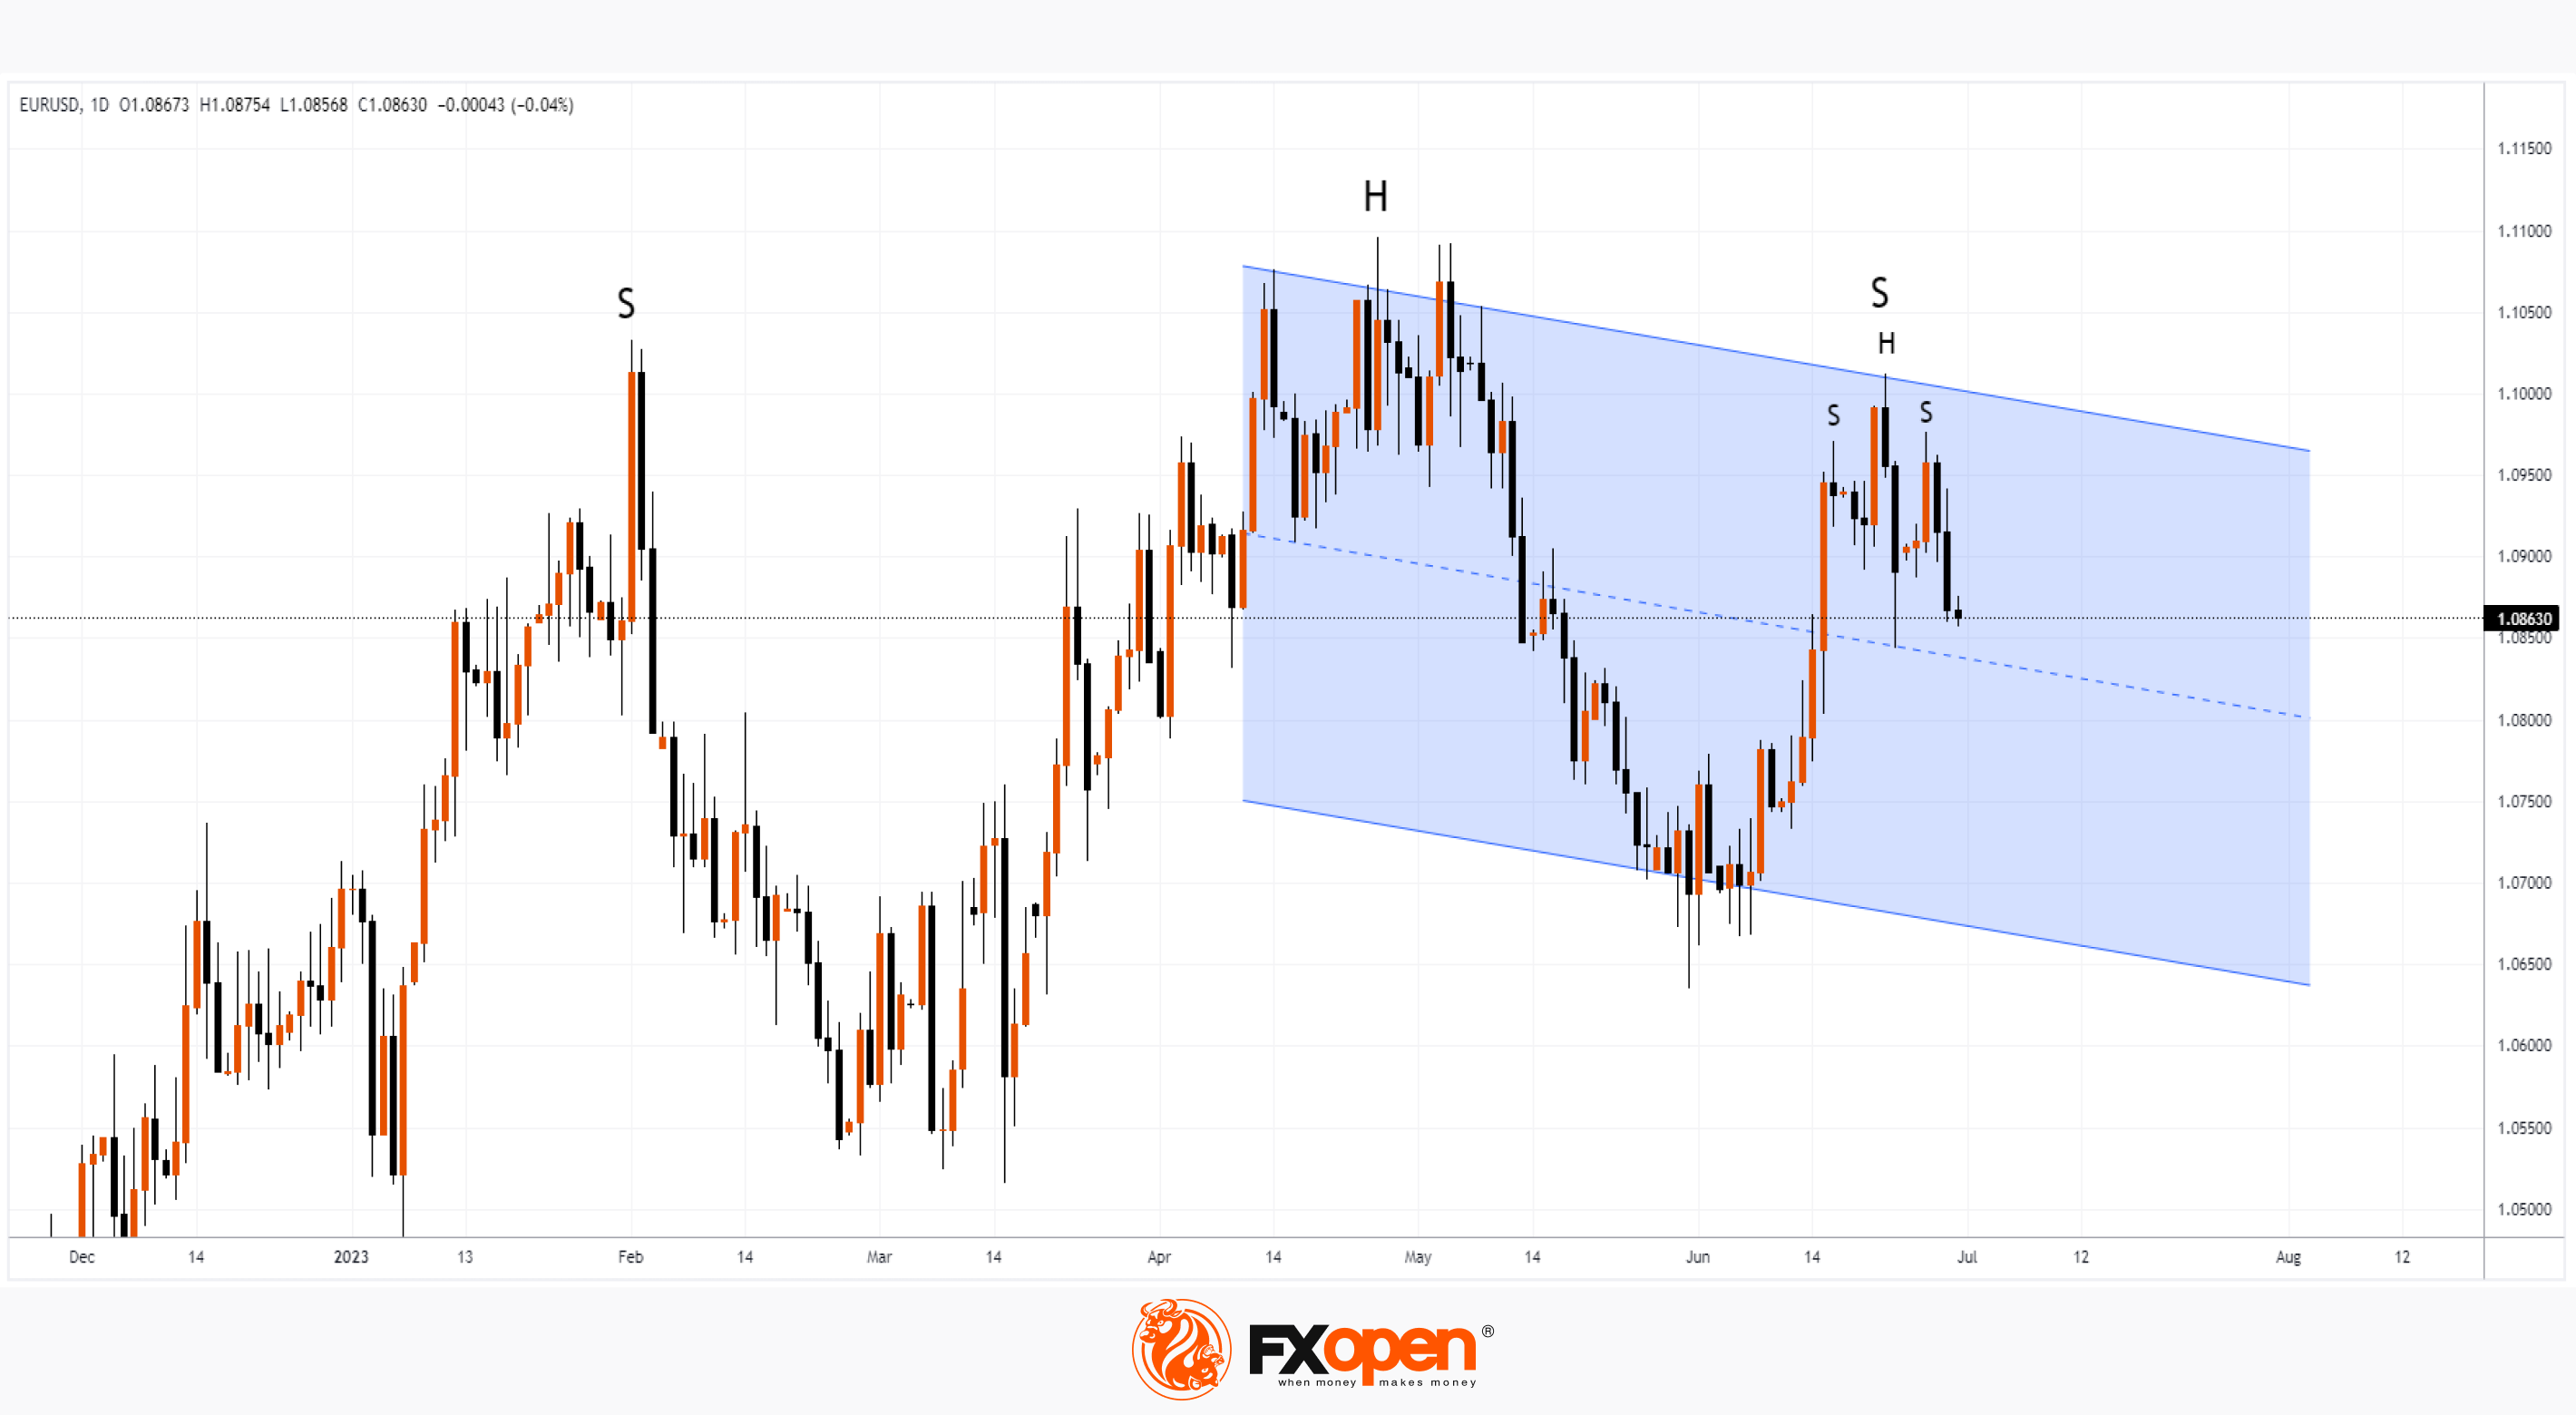
The EUR/USD chart indicates an interesting situation from the point of view of technical analysis, namely, a “nested” head-and-shoulders pattern.
The global bearish SHS pattern is formed by the peaks of February, April, June.
The local bearish SHS pattern is formed by three peaks formed in the second half of June. This should give confidence to the bears, who have statistics that indicate the effectiveness of the pattern.
Please note that inflation data will be published today:
→ 12:00 GMT+3: Core CPI Flash Estimate.
→ 12:00 GMT+3: US Core CPE is an indicator that the Fed pays special attention to.
Earlier this week, both Lagarde and Powell reaffirmed their resolve to fight inflation. The release of news today can provoke sharp movements in the market — for example, a breakdown of the neck line of the local SHS pattern. Get ready for bursts of volatility.
To benefit from the trends in the EUR/USD rate and other currency markets, consider enlisting the services of a reliable broker like FXOpen.
⚠️
CFDs are complex instruments and come with a high risk of losing your money.
This article represents the opinion of the Companies operating under the FXOpen brand only. It is not to be construed as an offer, solicitation, or recommendation with respect to products and services provided by the Companies operating under the FXOpen brand, nor is it to be considered financial advice.
Market Analysis. EUR/USD: Double Bearish Pattern
The EUR/USD chart indicates an interesting situation from the point of view of technical analysis, namely, a “nested” head-and-shoulders pattern.
The global bearish SHS pattern is formed by the peaks of February, April, June.
The local bearish SHS pattern is formed by three peaks formed in the second half of June. This should give confidence to the bears, who have statistics that indicate the effectiveness of the pattern.
Please note that inflation data will be published today:
→ 12:00 GMT+3: Core CPI Flash Estimate.
→ 12:00 GMT+3: US Core CPE is an indicator that the Fed pays special attention to.
Earlier this week, both Lagarde and Powell reaffirmed their resolve to fight inflation. The release of news today can provoke sharp movements in the market — for example, a breakdown of the neck line of the local SHS pattern. Get ready for bursts of volatility.
To benefit from the trends in the EUR/USD rate and other currency markets, consider enlisting the services of a reliable broker like FXOpen.
⚠️
CFDs are complex instruments and come with a high risk of losing your money.
This article represents the opinion of the Companies operating under the FXOpen brand only. It is not to be construed as an offer, solicitation, or recommendation with respect to products and services provided by the Companies operating under the FXOpen brand, nor is it to be considered financial advice.
#MarketNews #stocks #stockmarket
Market Analysis: Nike Stock Price Fall by 4%. What Does This Mean?
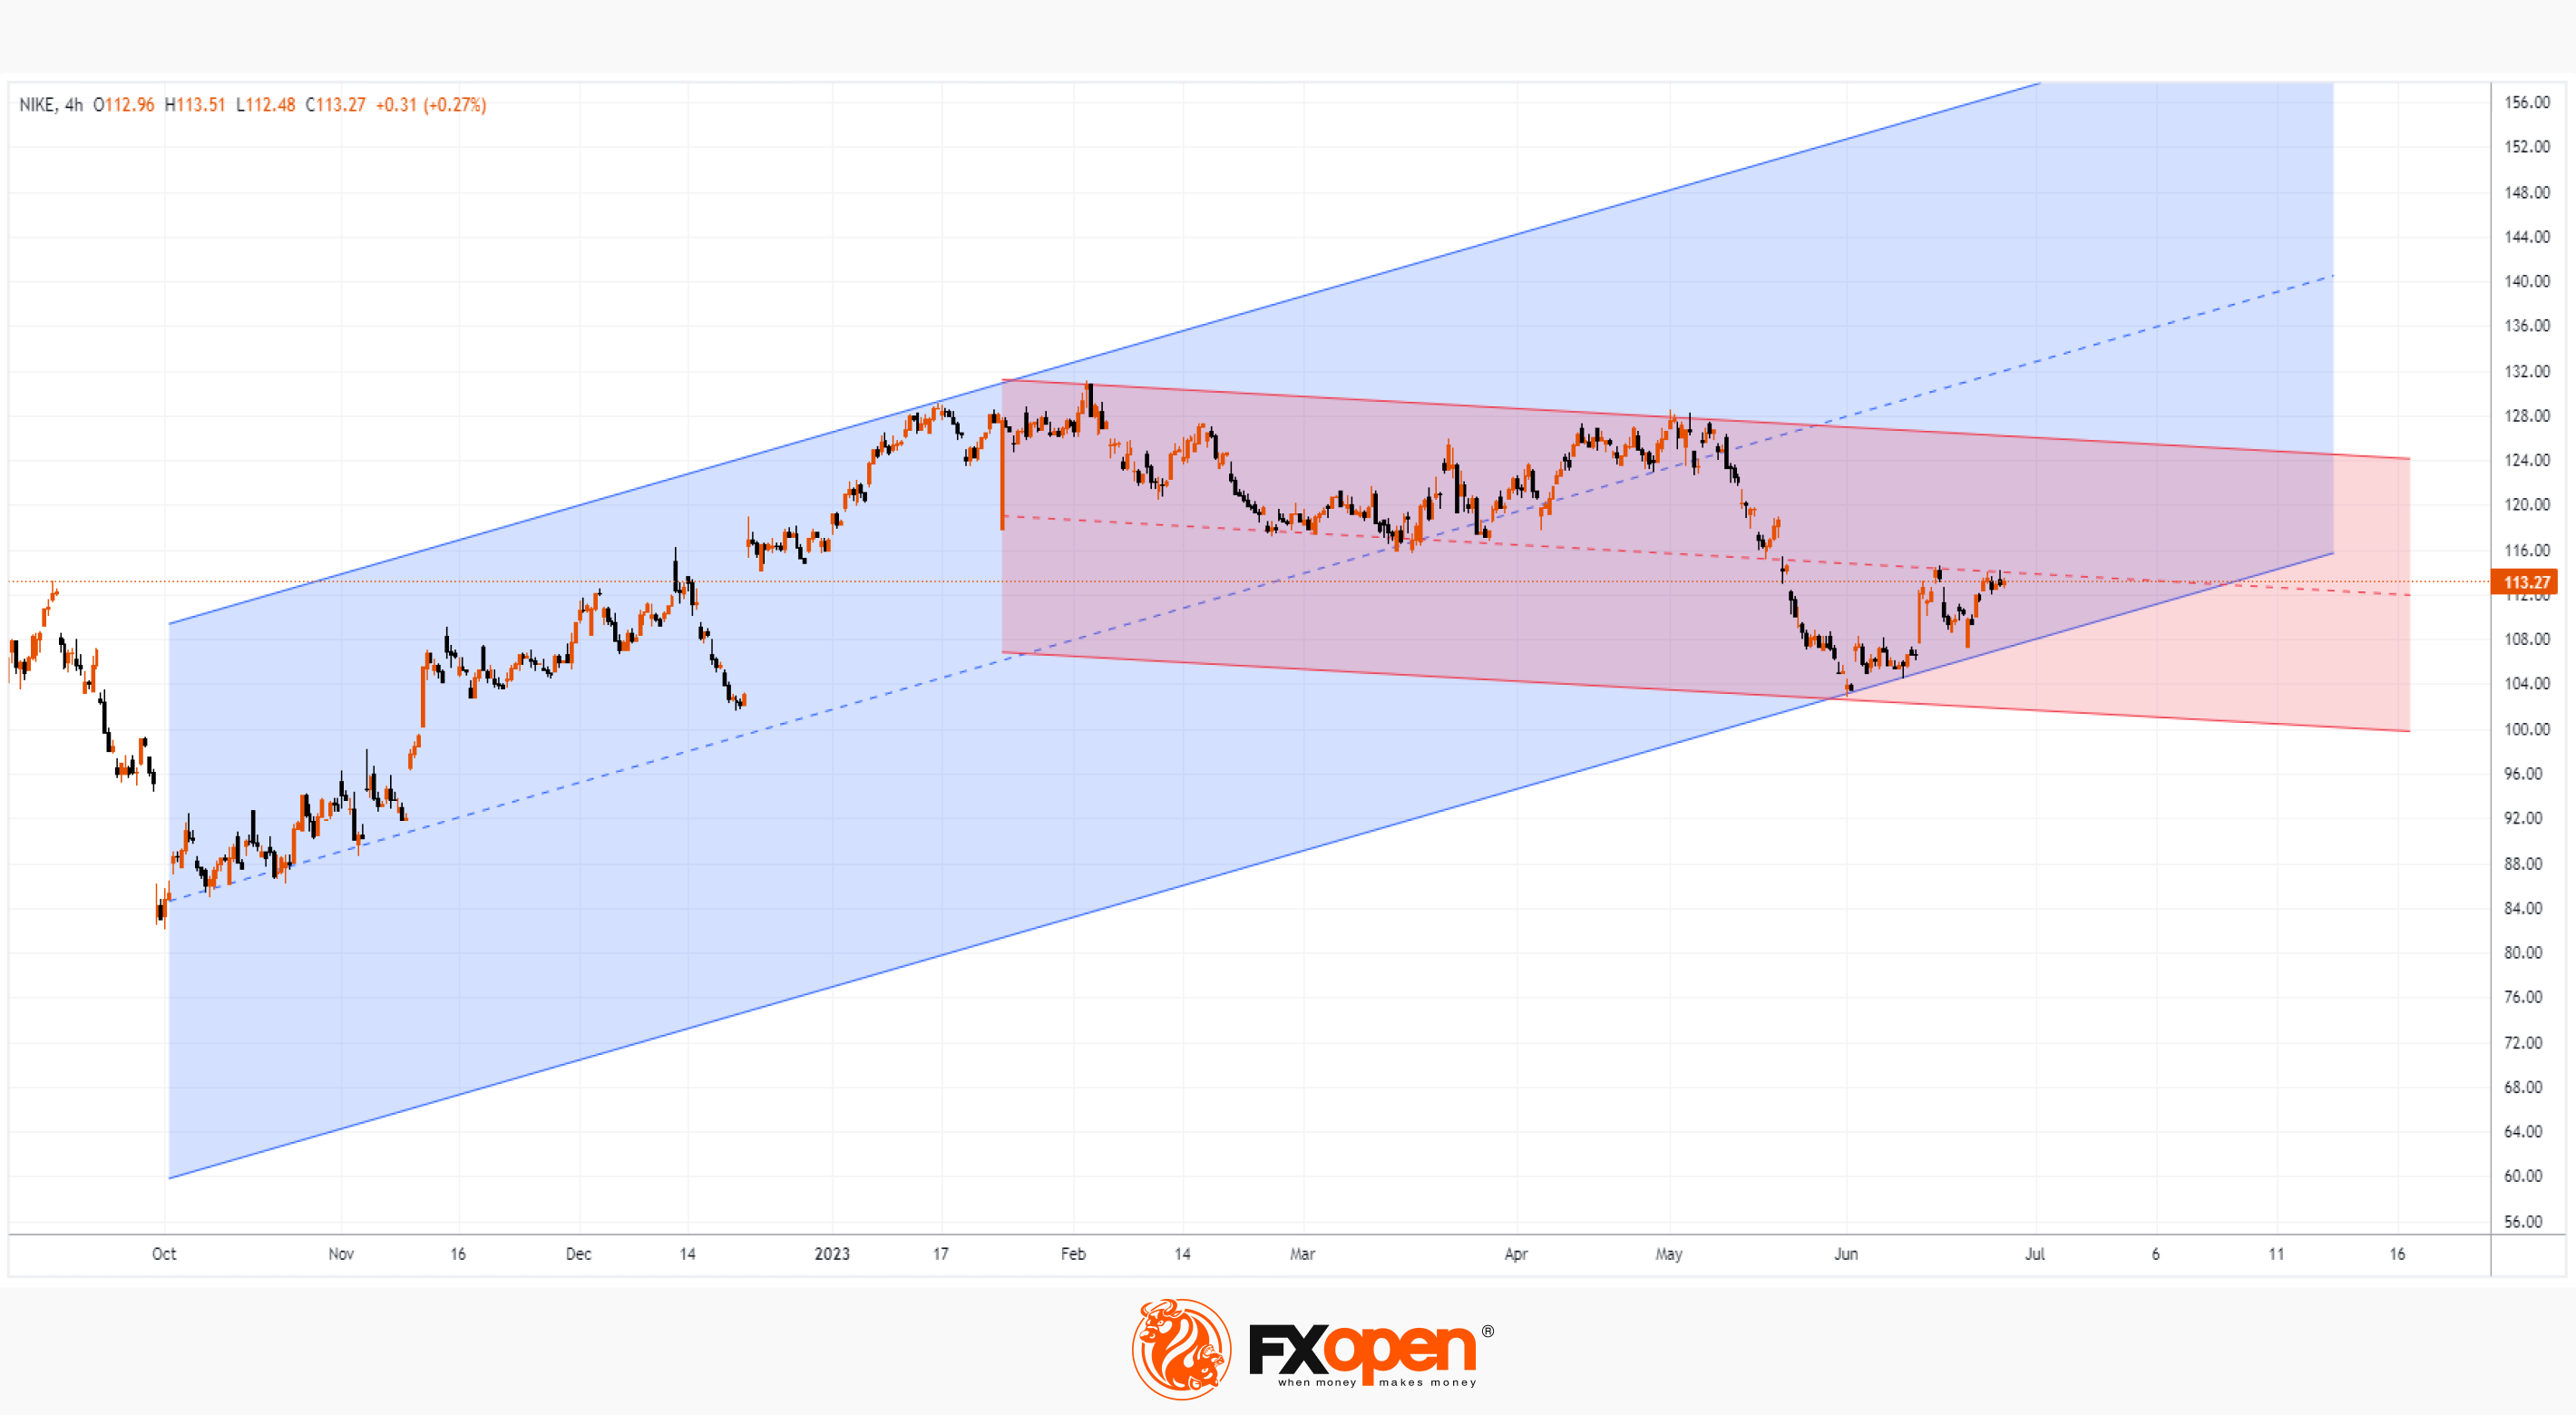
Yesterday, NKE's share price closed above USD 113, but trading today could open below USD 109 per Nike share.
The reason is in the weak report released by the company. Analysts note a drop in demand for products, which may mean a "wake-up call" for consumption in the US economy, squeezed by tight monetary policy.
According to finance professor Jeremy Siegel, "it's hard to see a lot of upside catalysts for the market in the second half of this year." The AI-driven rally is no guarantee that the US economy, which is made up of more than just tech companies, will not slip into recession.
The NKE stock chart shows that the price today will fluctuate around the lower border of the rising channel (shown in blue), which is valid in 2023. However, after a series of bounces seen in June, the bears may push through this support line to dominate the down channel (shown in red).
To benefit from the world's stock markets, consider enlisting the services of a reliable broker like FXOpen.
⚠️
CFDs are complex instruments and come with a high risk of losing your money.
This article represents the opinion of the Companies operating under the FXOpen brand only. It is not to be construed as an offer, solicitation, or recommendation with respect to products and services provided by the Companies operating under the FXOpen brand, nor is it to be considered financial advice.
Market Analysis: Nike Stock Price Fall by 4%. What Does This Mean?
Yesterday, NKE's share price closed above USD 113, but trading today could open below USD 109 per Nike share.
The reason is in the weak report released by the company. Analysts note a drop in demand for products, which may mean a "wake-up call" for consumption in the US economy, squeezed by tight monetary policy.
According to finance professor Jeremy Siegel, "it's hard to see a lot of upside catalysts for the market in the second half of this year." The AI-driven rally is no guarantee that the US economy, which is made up of more than just tech companies, will not slip into recession.
The NKE stock chart shows that the price today will fluctuate around the lower border of the rising channel (shown in blue), which is valid in 2023. However, after a series of bounces seen in June, the bears may push through this support line to dominate the down channel (shown in red).
To benefit from the world's stock markets, consider enlisting the services of a reliable broker like FXOpen.
⚠️
CFDs are complex instruments and come with a high risk of losing your money.
This article represents the opinion of the Companies operating under the FXOpen brand only. It is not to be construed as an offer, solicitation, or recommendation with respect to products and services provided by the Companies operating under the FXOpen brand, nor is it to be considered financial advice.
#trading #tradingtips #tradingstrategy
In this video, we'll discuss the quasimodo formation, also known as the quasimodo pattern, and how to trade it using the quasimodo FXOpen forex broker.
The quasimodo formation is a technical analysis pattern that can be used to identify opportunities in the forex market. By studying this pattern, you can identify conditions when prices are likely to change direction.
This video is aimed at providing you with a basic understanding of the quasimodo formation and how to use the FXOpen forex broker to trade it.
✅Visit: https://rb.gy/fgmmb
To take advantage of price fluctuations in the foreign exchange markets, consider enlisting the services of a reliable broker like FXOpen.
⚠️
This forecast represents FXOpen Companies opinion only, it should not be construed as an offer, invitation or recommendation in respect to FXOpen Companies products and services or as financial advice
In this video, we'll discuss the quasimodo formation, also known as the quasimodo pattern, and how to trade it using the quasimodo FXOpen forex broker.
The quasimodo formation is a technical analysis pattern that can be used to identify opportunities in the forex market. By studying this pattern, you can identify conditions when prices are likely to change direction.
This video is aimed at providing you with a basic understanding of the quasimodo formation and how to use the FXOpen forex broker to trade it.
✅Visit: https://rb.gy/fgmmb
To take advantage of price fluctuations in the foreign exchange markets, consider enlisting the services of a reliable broker like FXOpen.
⚠️
This forecast represents FXOpen Companies opinion only, it should not be construed as an offer, invitation or recommendation in respect to FXOpen Companies products and services or as financial advice
YouTube
WHAT IS THE QUASIMODO PATTERN IN FOREX? QUASIMODO FOREX STRATEGY
In this video, we'll discuss the quasimodo formation, also known as the quasimodo pattern, and how to trade it using the quasimodo FXOpen forex broker.
The quasimodo formation is a technical analysis pattern that can be used to identify opportunities in…
The quasimodo formation is a technical analysis pattern that can be used to identify opportunities in…
#stockmarket #MarketNews
Market Analysis: Brief Summary of the Q1 for the Stock Market
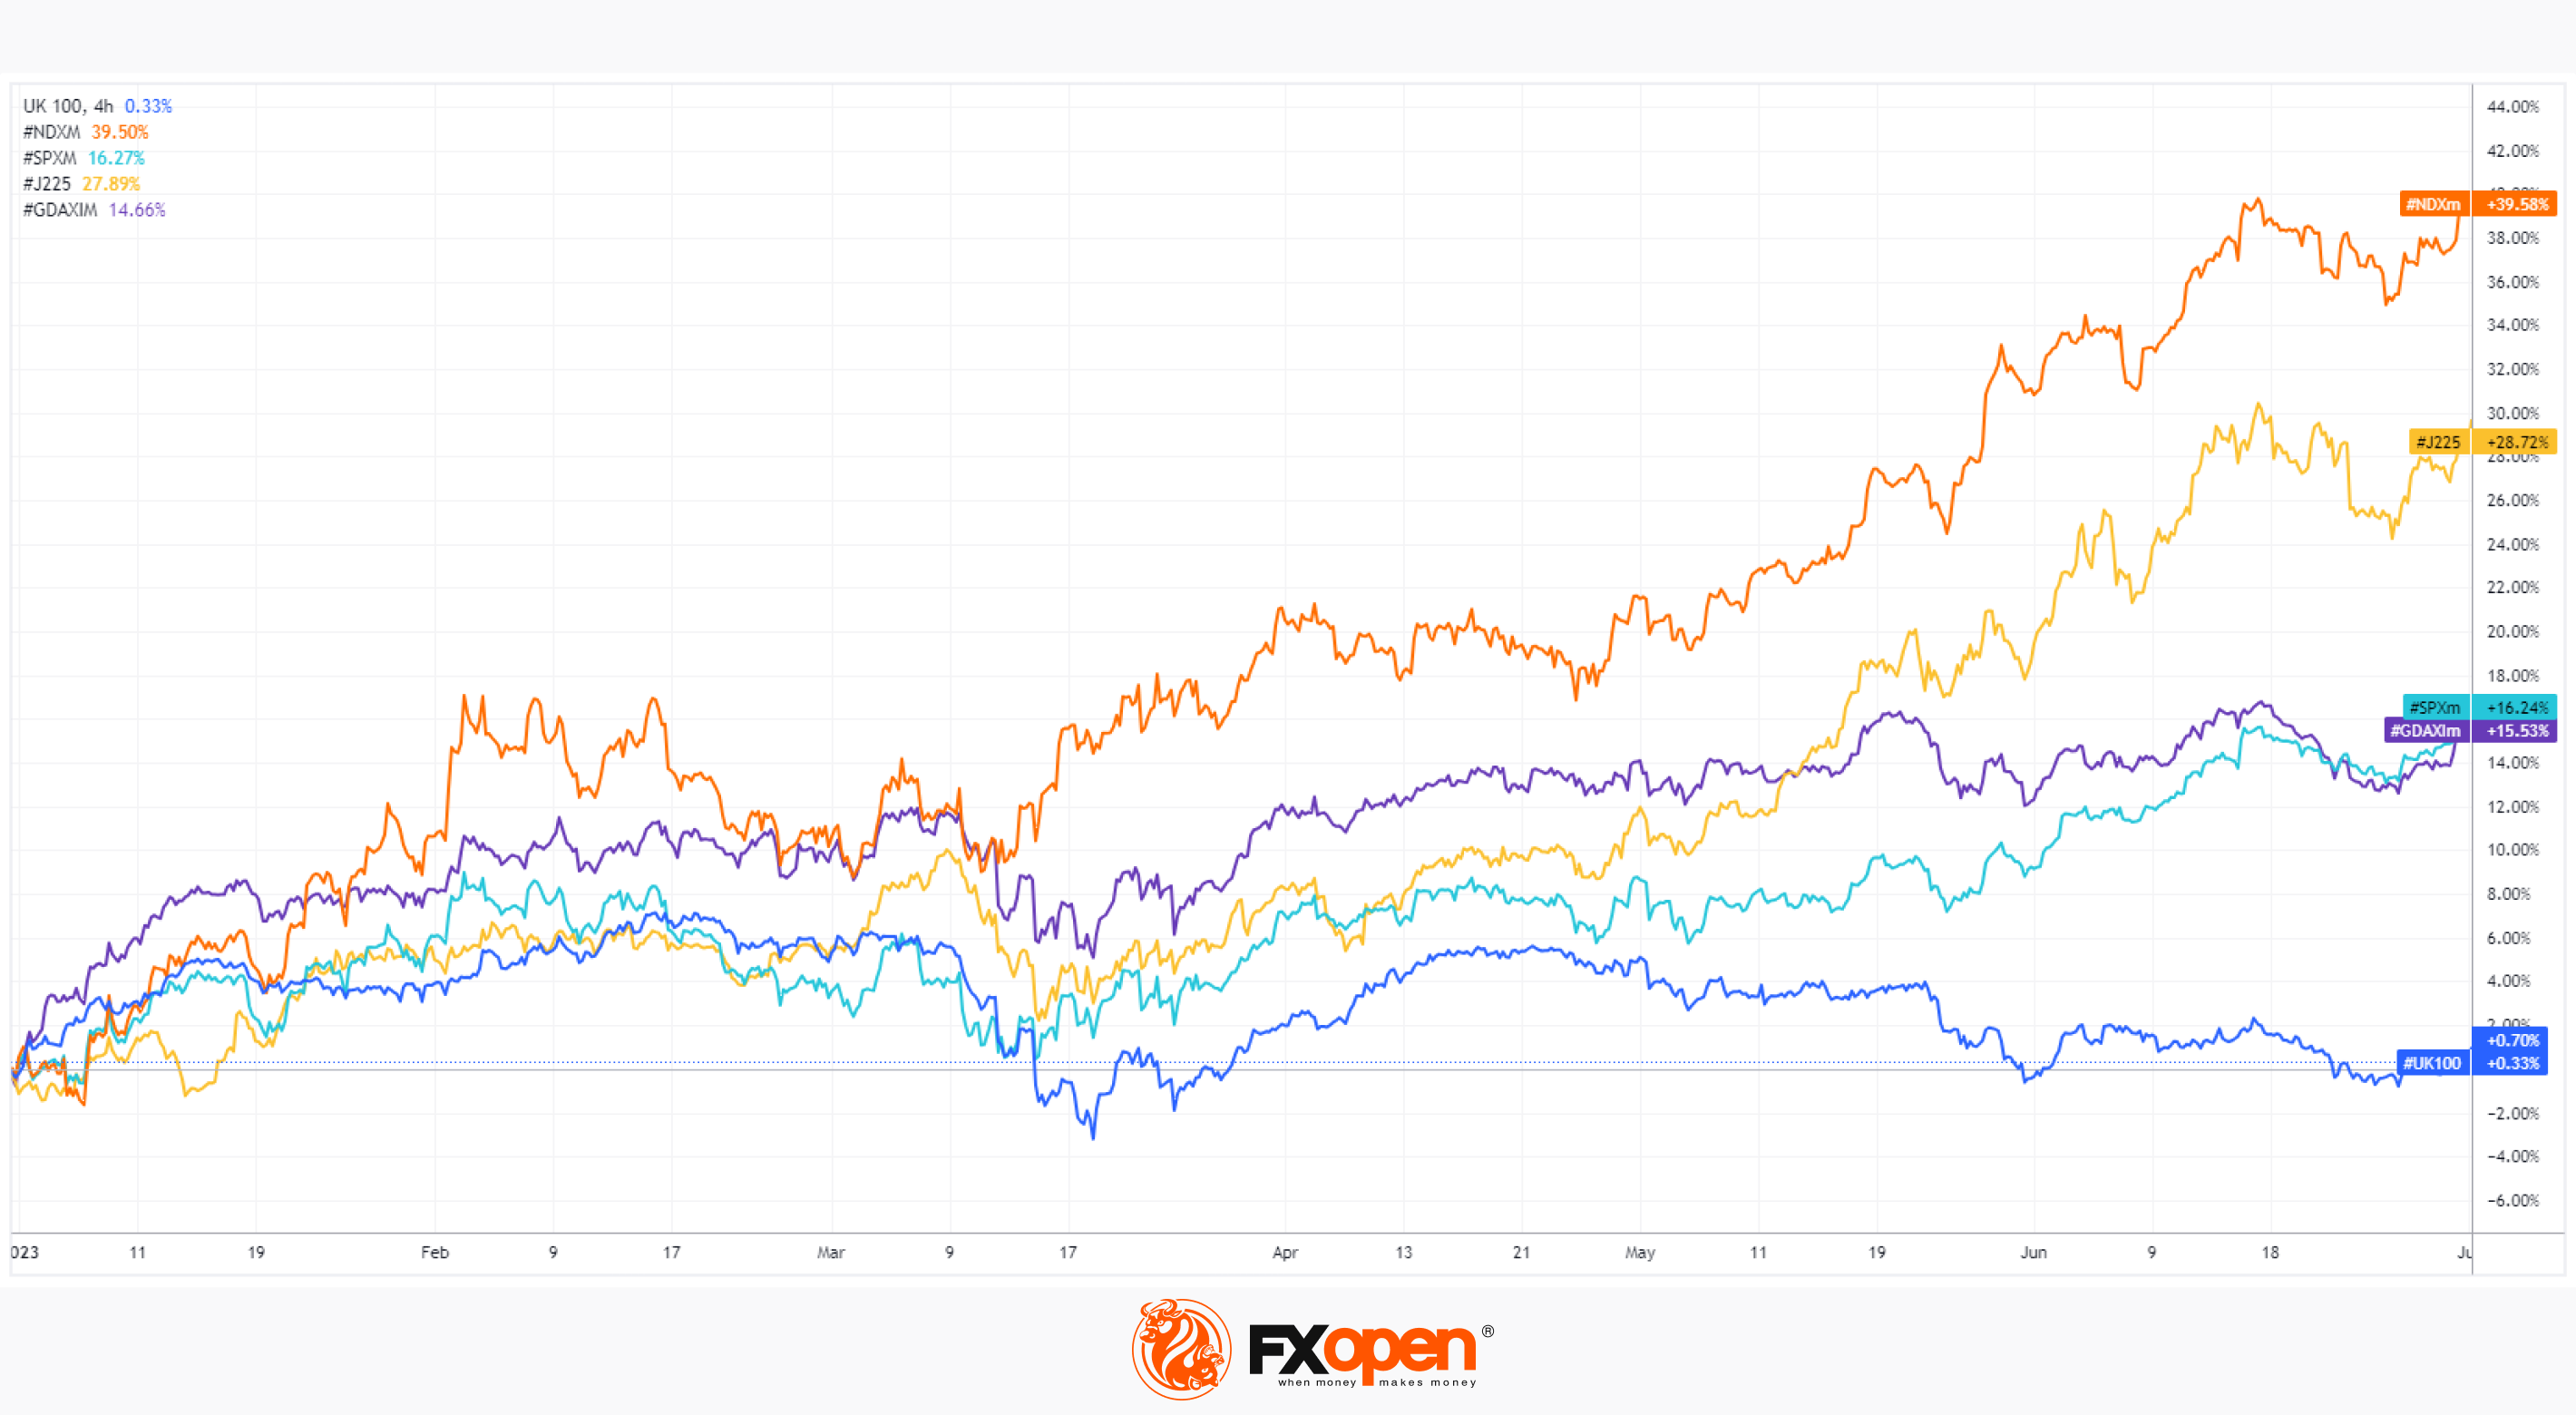
The graph of popular stock indices shows that since the beginning of the year, the Nasdaq index has managed to achieve the best result (almost + 40%), while the FTSE shows itself worse than others (about 0%). What are the reasons behind that?
The Nasdaq (NDX 100) is bullish because the index:
→ comprises tech stocks that are rapidly rising in value amid the AI-related hype. Businesswire writes that the AI industry will grow by +40% every year until 2026;
→ is less affected by concerns about bank failures in spring 2023.
The FTSE (aka UK100) is bearish because technology companies that can benefit from AI development are not heavily weighted in the index, but commodity companies are relatively heavily weighted, and the price of oil has decreased by about 13% since the beginning of the year. High inflation rates in the UK also add to the negative. The FT writes about doubts that the Bank of England will be able to curb it.
It is likely that inflation, high central bank rates (which lead to bank failures) and the boom associated with AI will continue to be relevant topics to some extent in the second half of 2023.
To benefit from changes in the values of popular stock indices, consider enlisting the services of a reliable broker like FXOpen.
⚠️
CFDs are complex instruments and come with a high risk of losing your money.
This article represents the opinion of the Companies operating under the FXOpen brand only. It is not to be construed as an offer, solicitation, or recommendation with respect to products and services provided by the Companies operating under the FXOpen brand, nor is it to be considered financial advice.
Market Analysis: Brief Summary of the Q1 for the Stock Market
The graph of popular stock indices shows that since the beginning of the year, the Nasdaq index has managed to achieve the best result (almost + 40%), while the FTSE shows itself worse than others (about 0%). What are the reasons behind that?
The Nasdaq (NDX 100) is bullish because the index:
→ comprises tech stocks that are rapidly rising in value amid the AI-related hype. Businesswire writes that the AI industry will grow by +40% every year until 2026;
→ is less affected by concerns about bank failures in spring 2023.
The FTSE (aka UK100) is bearish because technology companies that can benefit from AI development are not heavily weighted in the index, but commodity companies are relatively heavily weighted, and the price of oil has decreased by about 13% since the beginning of the year. High inflation rates in the UK also add to the negative. The FT writes about doubts that the Bank of England will be able to curb it.
It is likely that inflation, high central bank rates (which lead to bank failures) and the boom associated with AI will continue to be relevant topics to some extent in the second half of 2023.
To benefit from changes in the values of popular stock indices, consider enlisting the services of a reliable broker like FXOpen.
⚠️
CFDs are complex instruments and come with a high risk of losing your money.
This article represents the opinion of the Companies operating under the FXOpen brand only. It is not to be construed as an offer, solicitation, or recommendation with respect to products and services provided by the Companies operating under the FXOpen brand, nor is it to be considered financial advice.
#MarketNews #TSLA #stockmarket
TSLA Stock: Price Chart Analysis
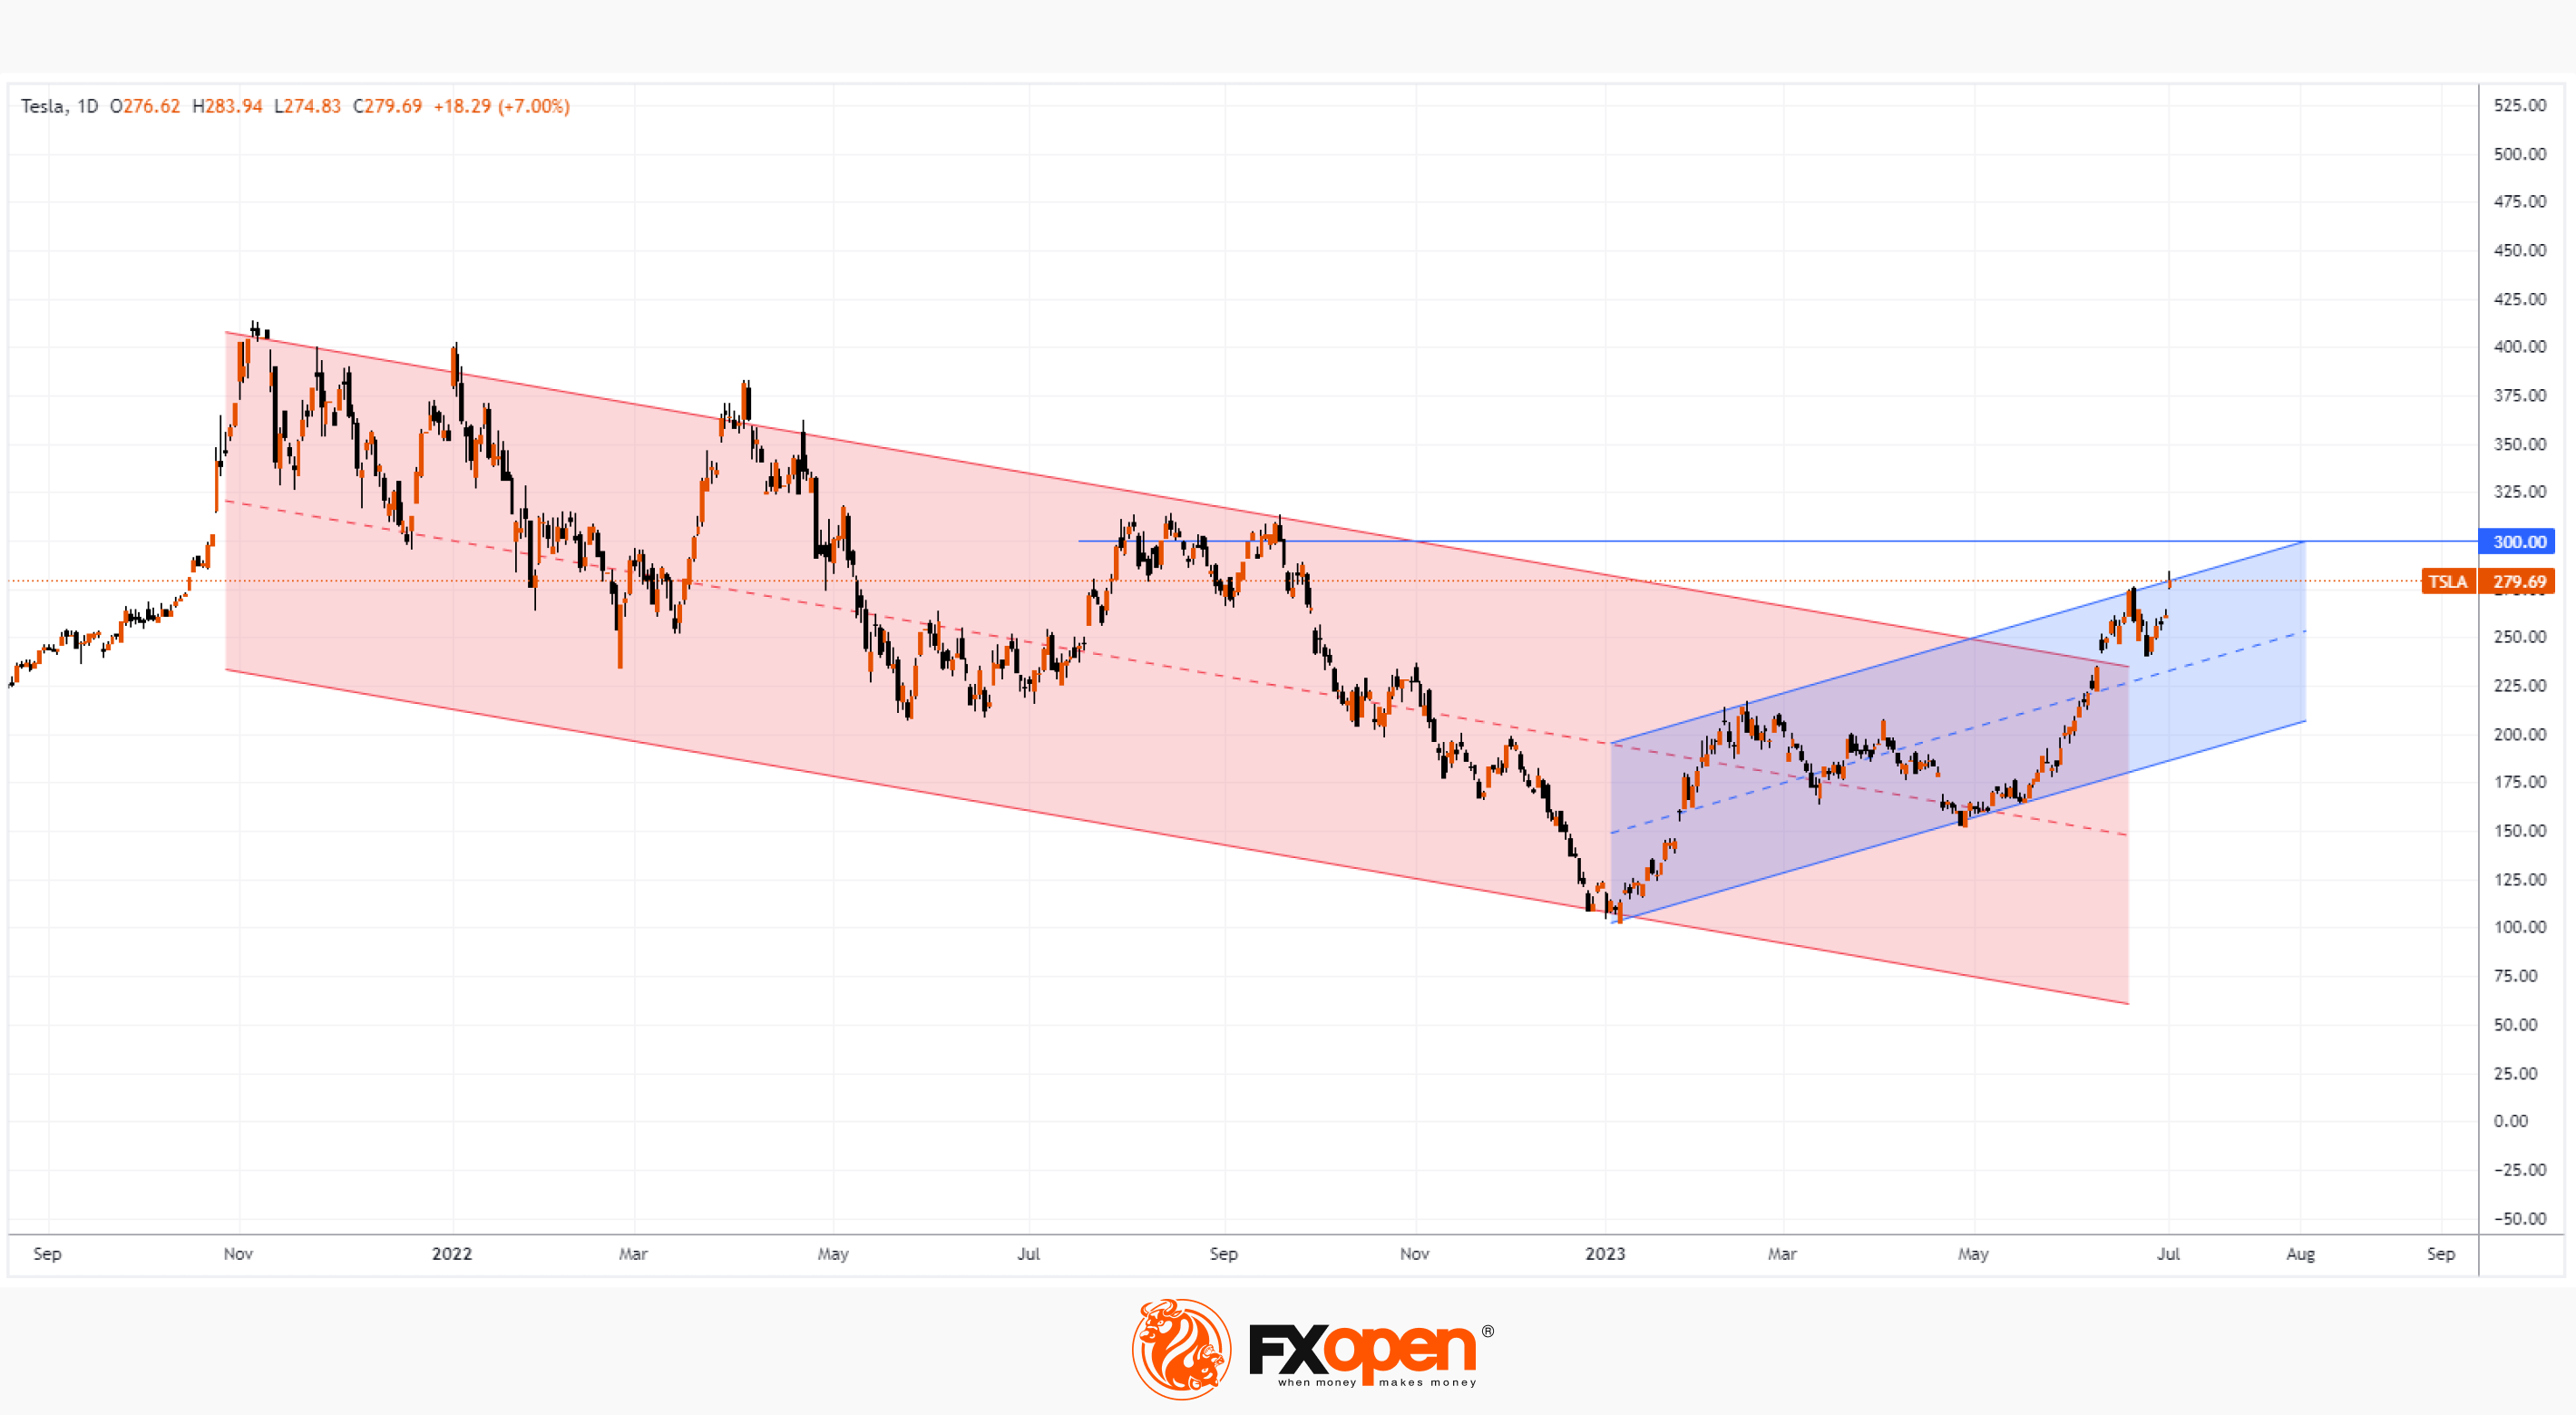
According to Bloomberg, the world's richest people got even richer in the first half of 2023. Musk tops the list with +USD 96.6 billion, followed by Zuckerberg with +USD 58.9 billion. The staggering growth in personal wealth is driven by the bullish stock market of META (up more than +140% since the beginning of the year) and TSLA (up more than +150% since the beginning of the year).
Perhaps to catch up with Musk, Zuckerberg gave the green light to the launch (scheduled for July 6) of Twitter's competitor, the Threads social network. Recall that Musk does not like this so much that he challenged Zuckerberg to a fight, and Zuckerberg agreed. Negotiations are underway with UFC managers about holding a billionaire fight.
Meanwhile, the bull market continues, with TSLA's share price hitting a new high for the year after reporting record EV shipments in Q2. At the same time, the TSLA stock chart shows that:
→ the price of TSLA breaks through the descending channel with a gap (shown in red) and fixes above it within the ascending channel (shown in blue);
→ TSLA price is near the upper border of the rising channel, which is resisting;
→ TSLA price is approaching psychological resistance at USD 300 per share — last year it proved to be a test for bulls, showing their failure.
According to analysts published by CNNMoney, the average target price for TSLA shares is around USD 220.
Given the above, we can assume that the TSLA stock market is vulnerable to a pullback within the blue channel. But that's probably less likely to upset Musk more than his loss in a possible fight against Zuckerberg.
To benefit from the rise and fall of the price of TSLA and other popular stocks, consider enlisting the services of a reliable broker like FXOpen.
⚠️
CFDs are complex instruments and come with a high risk of losing your money.
This article represents the opinion of the Companies operating under the FXOpen brand only. It is not to be construed as an offer, solicitation, or recommendation with respect to products and services provided by the Companies operating under the FXOpen brand, nor is it to be considered financial advice.
TSLA Stock: Price Chart Analysis
According to Bloomberg, the world's richest people got even richer in the first half of 2023. Musk tops the list with +USD 96.6 billion, followed by Zuckerberg with +USD 58.9 billion. The staggering growth in personal wealth is driven by the bullish stock market of META (up more than +140% since the beginning of the year) and TSLA (up more than +150% since the beginning of the year).
Perhaps to catch up with Musk, Zuckerberg gave the green light to the launch (scheduled for July 6) of Twitter's competitor, the Threads social network. Recall that Musk does not like this so much that he challenged Zuckerberg to a fight, and Zuckerberg agreed. Negotiations are underway with UFC managers about holding a billionaire fight.
Meanwhile, the bull market continues, with TSLA's share price hitting a new high for the year after reporting record EV shipments in Q2. At the same time, the TSLA stock chart shows that:
→ the price of TSLA breaks through the descending channel with a gap (shown in red) and fixes above it within the ascending channel (shown in blue);
→ TSLA price is near the upper border of the rising channel, which is resisting;
→ TSLA price is approaching psychological resistance at USD 300 per share — last year it proved to be a test for bulls, showing their failure.
According to analysts published by CNNMoney, the average target price for TSLA shares is around USD 220.
Given the above, we can assume that the TSLA stock market is vulnerable to a pullback within the blue channel. But that's probably less likely to upset Musk more than his loss in a possible fight against Zuckerberg.
To benefit from the rise and fall of the price of TSLA and other popular stocks, consider enlisting the services of a reliable broker like FXOpen.
⚠️
CFDs are complex instruments and come with a high risk of losing your money.
This article represents the opinion of the Companies operating under the FXOpen brand only. It is not to be construed as an offer, solicitation, or recommendation with respect to products and services provided by the Companies operating under the FXOpen brand, nor is it to be considered financial advice.
#MarketNews #USDJPY
Market Analysis. USD/JPY: Calm Before the Storm?
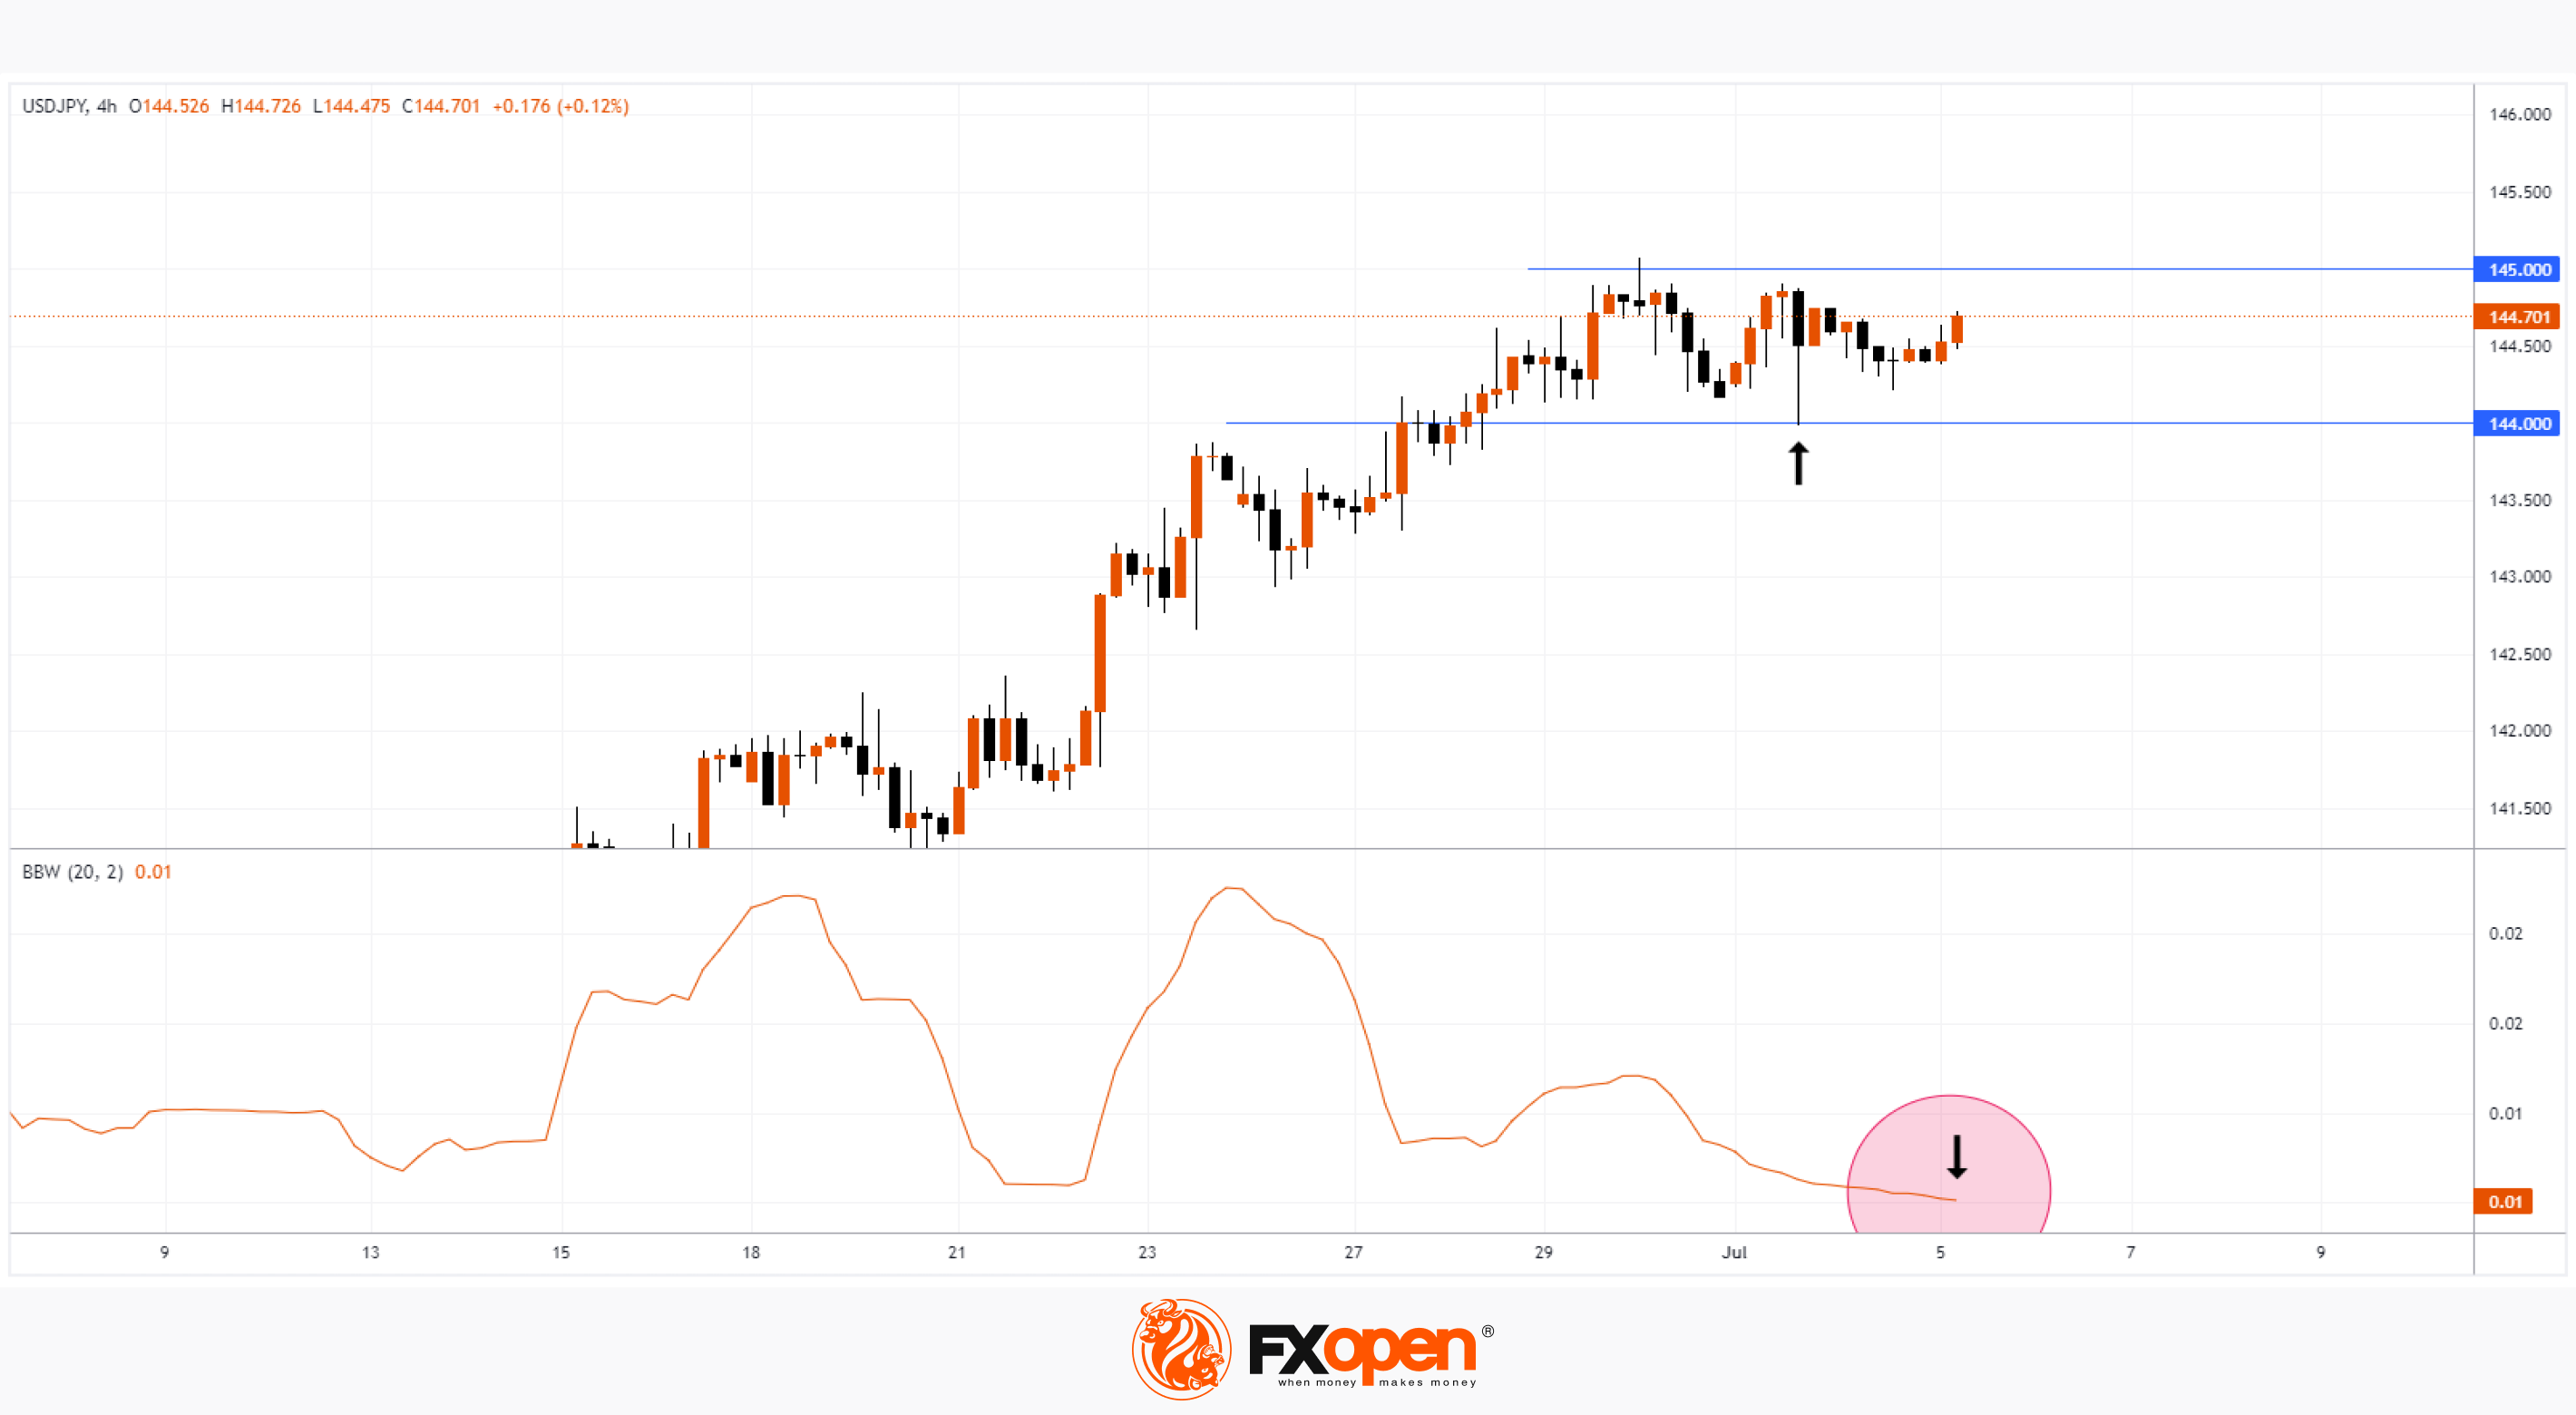
There is some lull (consolidation) in the USD/JPY market, which is evidenced by the width of the Bollinger bands, which dropped to the lows of the end of February on the 4-hour chart. Bank holidays in the US in connection with the celebration of Independence Day contributed to the decrease in volatility.
However, the calm could be replaced by a storm.
The USD/JPY chart shows that the bulls have tested the level of 144 and on the morning of July 5, the rate is gradually rising towards the level of 145 — technically this can be interpreted as a demand force for dollars.
Reuters reports the words of Shusuke Yamada, chief forex strategist at Bank of China, who believes that the market expects further weakening of the yen in the medium term. And this is important, because last fall, the level of 145 yen per US dollar was the trigger for intervention by the Bank of Japan.
Add here the news from the FOMC, which will be released today at 21:00 GMT+3, and you will get a set of drivers that can cause a surge in market volatility in July and an expansion of Bollinger bands.
To benefit from trends in the currency markets, consider enlisting the services of a reliable broker like FXOpen.
⚠️
CFDs are complex instruments and come with a high risk of losing your money.
This article represents the opinion of the Companies operating under the FXOpen brand only. It is not to be construed as an offer, solicitation, or recommendation with respect to products and services provided by the Companies operating under the FXOpen brand, nor is it to be considered financial advice.
Market Analysis. USD/JPY: Calm Before the Storm?
There is some lull (consolidation) in the USD/JPY market, which is evidenced by the width of the Bollinger bands, which dropped to the lows of the end of February on the 4-hour chart. Bank holidays in the US in connection with the celebration of Independence Day contributed to the decrease in volatility.
However, the calm could be replaced by a storm.
The USD/JPY chart shows that the bulls have tested the level of 144 and on the morning of July 5, the rate is gradually rising towards the level of 145 — technically this can be interpreted as a demand force for dollars.
Reuters reports the words of Shusuke Yamada, chief forex strategist at Bank of China, who believes that the market expects further weakening of the yen in the medium term. And this is important, because last fall, the level of 145 yen per US dollar was the trigger for intervention by the Bank of Japan.
Add here the news from the FOMC, which will be released today at 21:00 GMT+3, and you will get a set of drivers that can cause a surge in market volatility in July and an expansion of Bollinger bands.
To benefit from trends in the currency markets, consider enlisting the services of a reliable broker like FXOpen.
⚠️
CFDs are complex instruments and come with a high risk of losing your money.
This article represents the opinion of the Companies operating under the FXOpen brand only. It is not to be construed as an offer, solicitation, or recommendation with respect to products and services provided by the Companies operating under the FXOpen brand, nor is it to be considered financial advice.
#MarketNews
Market Analysis: EUR/USD Drops Again While USD/CHF Gains Strength
🔸 The Euro struggled to clear the 1.0930 resistance against the US Dollar.
🔸 There is a major bearish trend line forming with resistance near 1.0890 on the hourly chart of EUR/USD at FXOpen.
🔸 USD/CHF is gaining pace above the 0.8965 resistance zone.
🔸 There is a key bearish trend line forming with resistance near 0.8980 on the hourly chart at FXOpen.
https://cutt.ly/HwuXHUXk
To take advantage of price fluctuations in the foreign exchange markets, consider enlisting the services of a reliable broker like FXOpen.
⚠️
This forecast represents FXOpen Companies opinion only, it should not be construed as an offer, invitation or recommendation in respect to FXOpen Companies products and services or as financial advice
Market Analysis: EUR/USD Drops Again While USD/CHF Gains Strength
🔸 The Euro struggled to clear the 1.0930 resistance against the US Dollar.
🔸 There is a major bearish trend line forming with resistance near 1.0890 on the hourly chart of EUR/USD at FXOpen.
🔸 USD/CHF is gaining pace above the 0.8965 resistance zone.
🔸 There is a key bearish trend line forming with resistance near 0.8980 on the hourly chart at FXOpen.
https://cutt.ly/HwuXHUXk
To take advantage of price fluctuations in the foreign exchange markets, consider enlisting the services of a reliable broker like FXOpen.
⚠️
This forecast represents FXOpen Companies opinion only, it should not be construed as an offer, invitation or recommendation in respect to FXOpen Companies products and services or as financial advice
Market Pulse
Market Analysis: EUR/USD Drops Again While USD/CHF Gains Strength
EUR/USD started a fresh decline from the 1.0930 resistance. USD/CHF is rising and might aim a move toward the 0.9015 resistance.
#MarketNews #stocks #NFLX
Market Analysis: NFLX Share Price Hits Year High
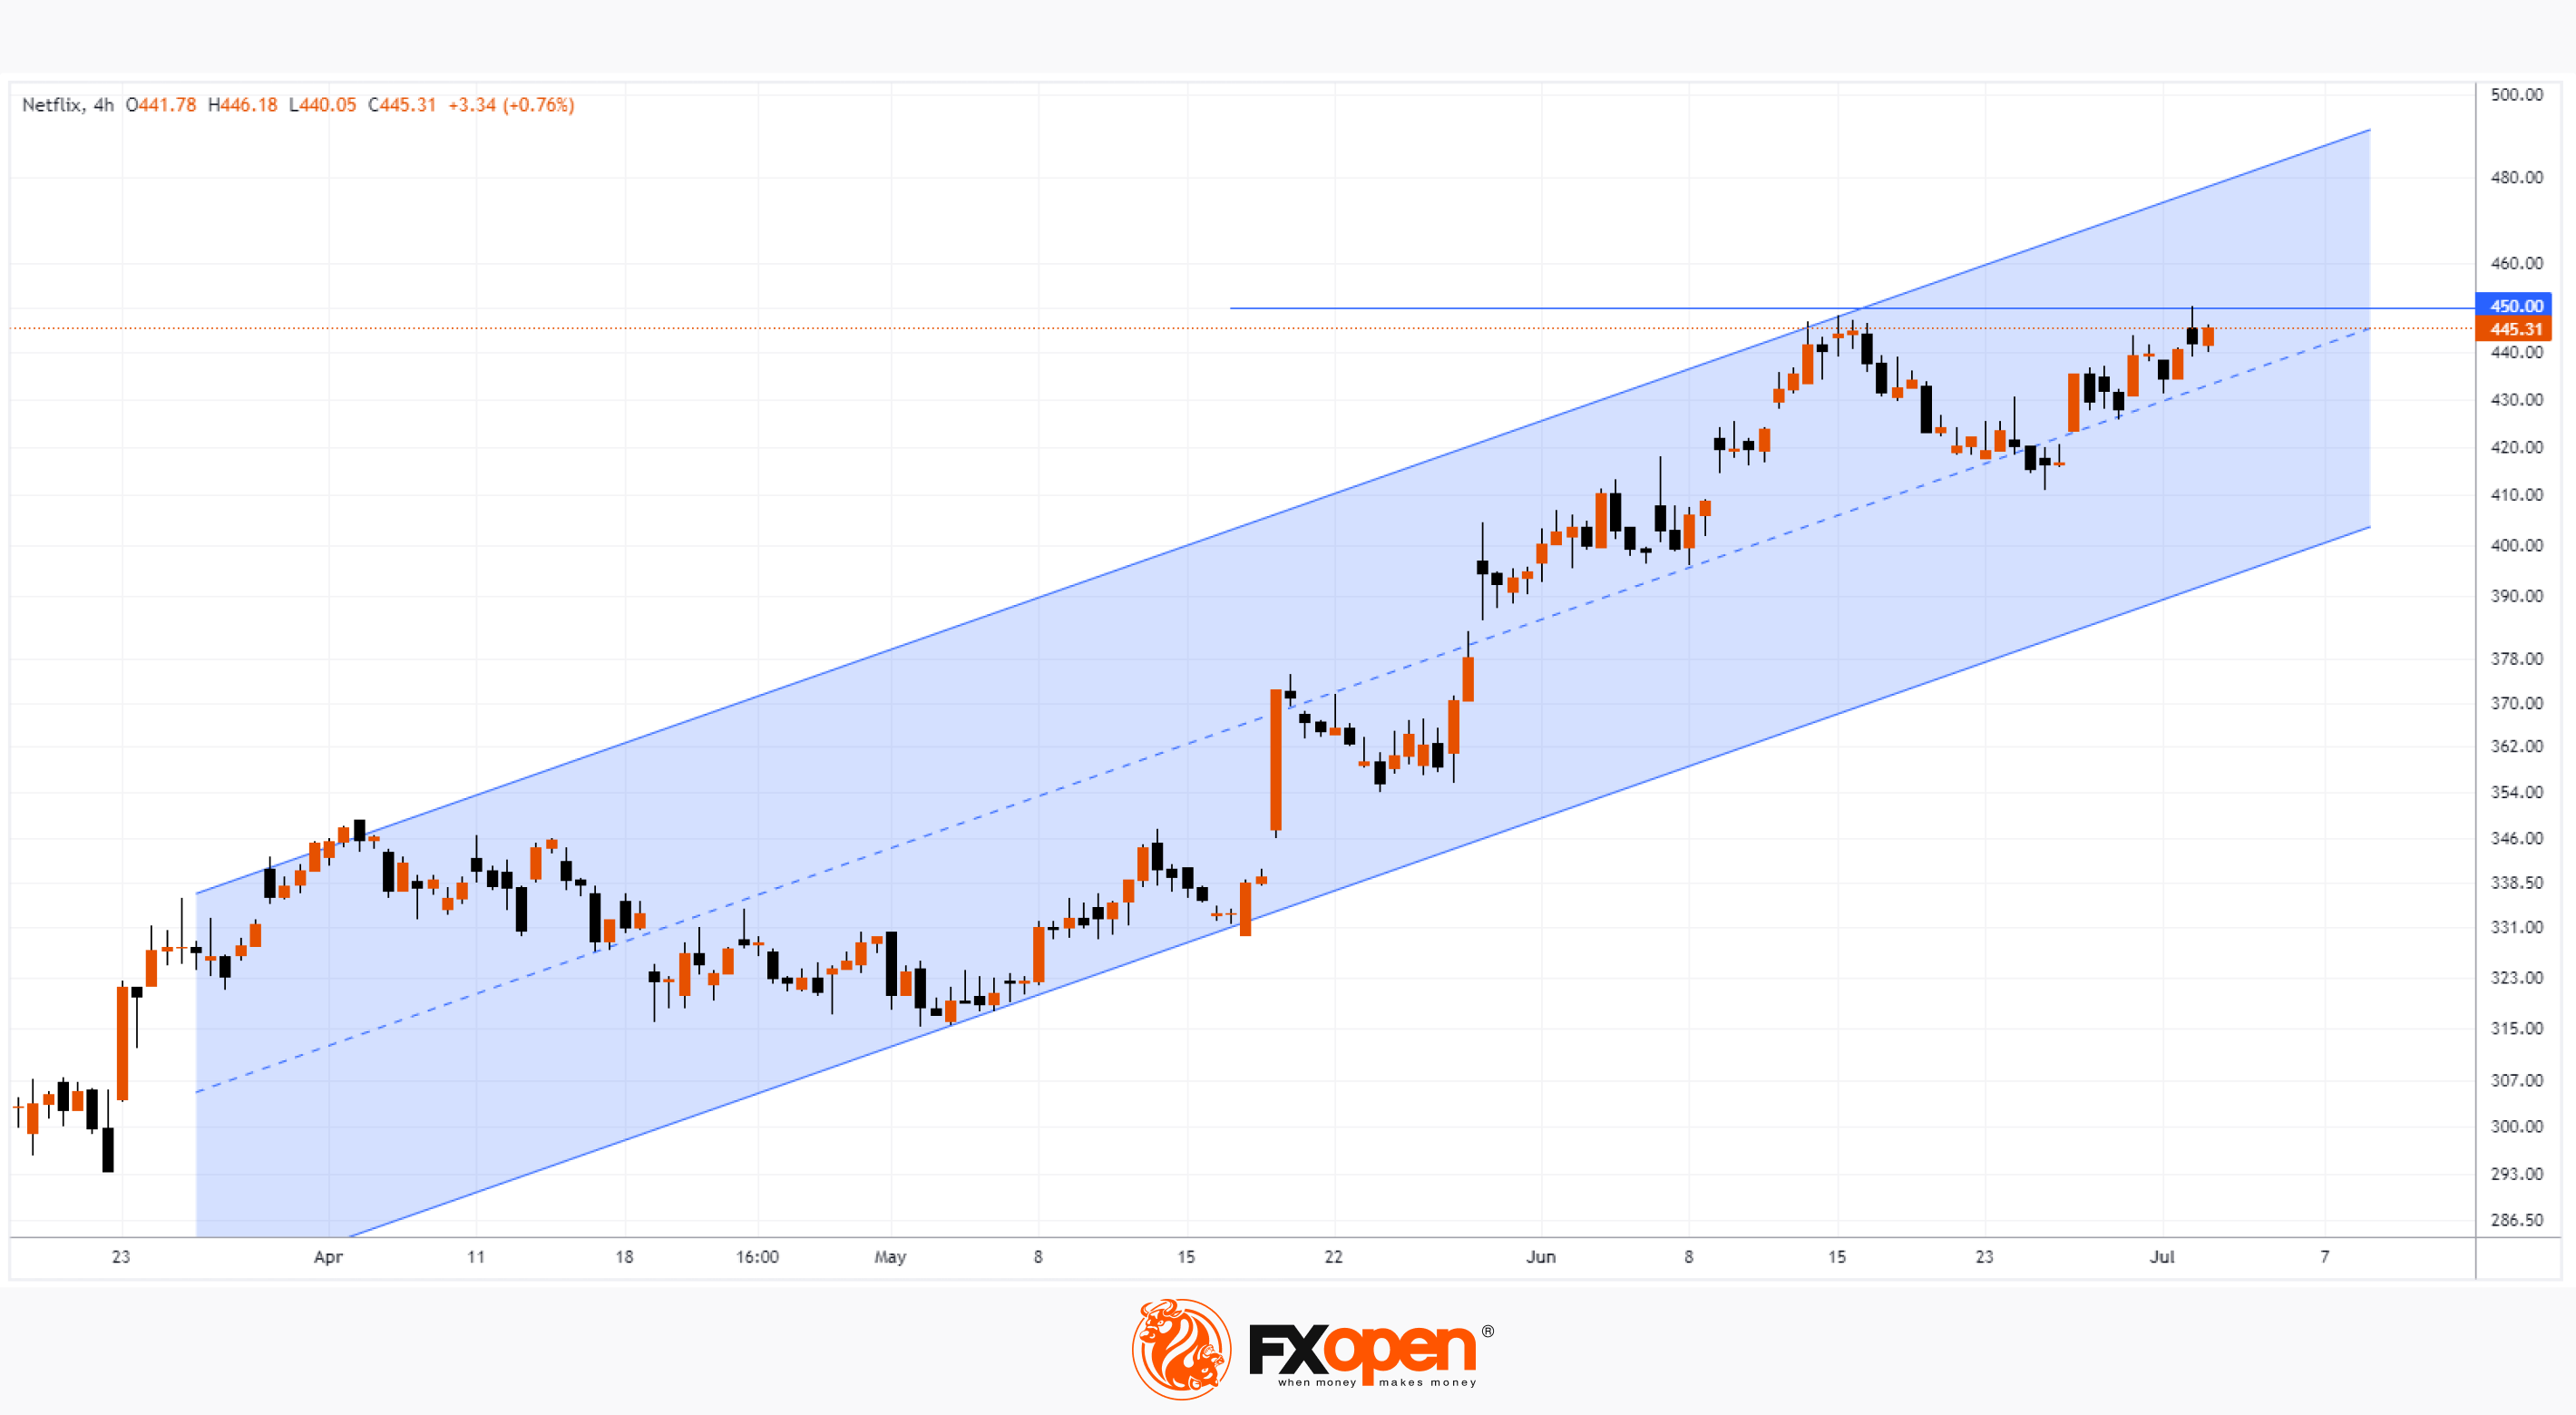
Since the beginning of the year, the NFLX share price has risen by about 55% (for comparison, the S&P 500 index growth was 16% over the same period), and yesterday NFLX reached a price of USD 450 per share — the highest since the beginning of the year.
Bullish sentiment in the market was facilitated by news from analysts at Goldman Sachs, who upgraded the rating of NFLX shares and raised the target price of NFLX shares from USD 230 to USD 400 (9% lower than the current one). Isn't it too late? As a reminder, we pointed to the growth prospects of NFLX stock on October 10, 2022.
Strong demand for NFLX shares in 2023 is supported by the release of quality content, as well as opinions that the company has managed to regain subscribers and successfully resist password cracking.
However, there are certain threats to the NFLX stock, which looks very strong within the channel shown in blue:
→ the psychological level of USD 450 per share, which shows signs of resistance;
→ yesterday's high of the year candle looks uncertain due to the long upper shadow. It may turn into a false breakdown of the June high;
→ Fundamental factor: Netflix's Q2 report is expected on July 19. If the data disappoints investors, it could lead to a pullback in the NFLX stock price to the lower border of the blue channel, or even a bearish breakout.
To benefit from the rise and fall of the NFLX share price, consider enlisting the services of a reliable broker like FXOpen.
⚠️
CFDs are complex instruments and come with a high risk of losing your money.
This article represents the opinion of the Companies operating under the FXOpen brand only. It is not to be construed as an offer, solicitation, or recommendation with respect to products and services provided by the Companies operating under the FXOpen brand, nor is it to be considered financial advice.
Market Analysis: NFLX Share Price Hits Year High
Since the beginning of the year, the NFLX share price has risen by about 55% (for comparison, the S&P 500 index growth was 16% over the same period), and yesterday NFLX reached a price of USD 450 per share — the highest since the beginning of the year.
Bullish sentiment in the market was facilitated by news from analysts at Goldman Sachs, who upgraded the rating of NFLX shares and raised the target price of NFLX shares from USD 230 to USD 400 (9% lower than the current one). Isn't it too late? As a reminder, we pointed to the growth prospects of NFLX stock on October 10, 2022.
Strong demand for NFLX shares in 2023 is supported by the release of quality content, as well as opinions that the company has managed to regain subscribers and successfully resist password cracking.
However, there are certain threats to the NFLX stock, which looks very strong within the channel shown in blue:
→ the psychological level of USD 450 per share, which shows signs of resistance;
→ yesterday's high of the year candle looks uncertain due to the long upper shadow. It may turn into a false breakdown of the June high;
→ Fundamental factor: Netflix's Q2 report is expected on July 19. If the data disappoints investors, it could lead to a pullback in the NFLX stock price to the lower border of the blue channel, or even a bearish breakout.
To benefit from the rise and fall of the NFLX share price, consider enlisting the services of a reliable broker like FXOpen.
⚠️
CFDs are complex instruments and come with a high risk of losing your money.
This article represents the opinion of the Companies operating under the FXOpen brand only. It is not to be construed as an offer, solicitation, or recommendation with respect to products and services provided by the Companies operating under the FXOpen brand, nor is it to be considered financial advice.
#MarketNews #ftse100
Market Analysis: FTSE 100 Drops Below June Low
Earlier we wrote about the reasons for the weak behavior of the UK stock market.
Firstly, it is the highest inflation among the G7 countries.
Yesterday JP Morgan analysts suggested that the base rate in the UK could be raised to 7% under certain scenarios. And the likelihood of a hard landing for the British economy next year is rising due to the impact of rising borrowing costs on business confidence and rising unemployment.
Secondly, this is a decline in commodity prices, which is important for the FTSE 100 index, where the share of oil and mining companies is relatively large. Commodity prices reflect expectations of a global economic growth outlook that has been overshadowed by news from China. There, according to the latest data, activity in the services sector in June grew at the slowest pace in 5 months.
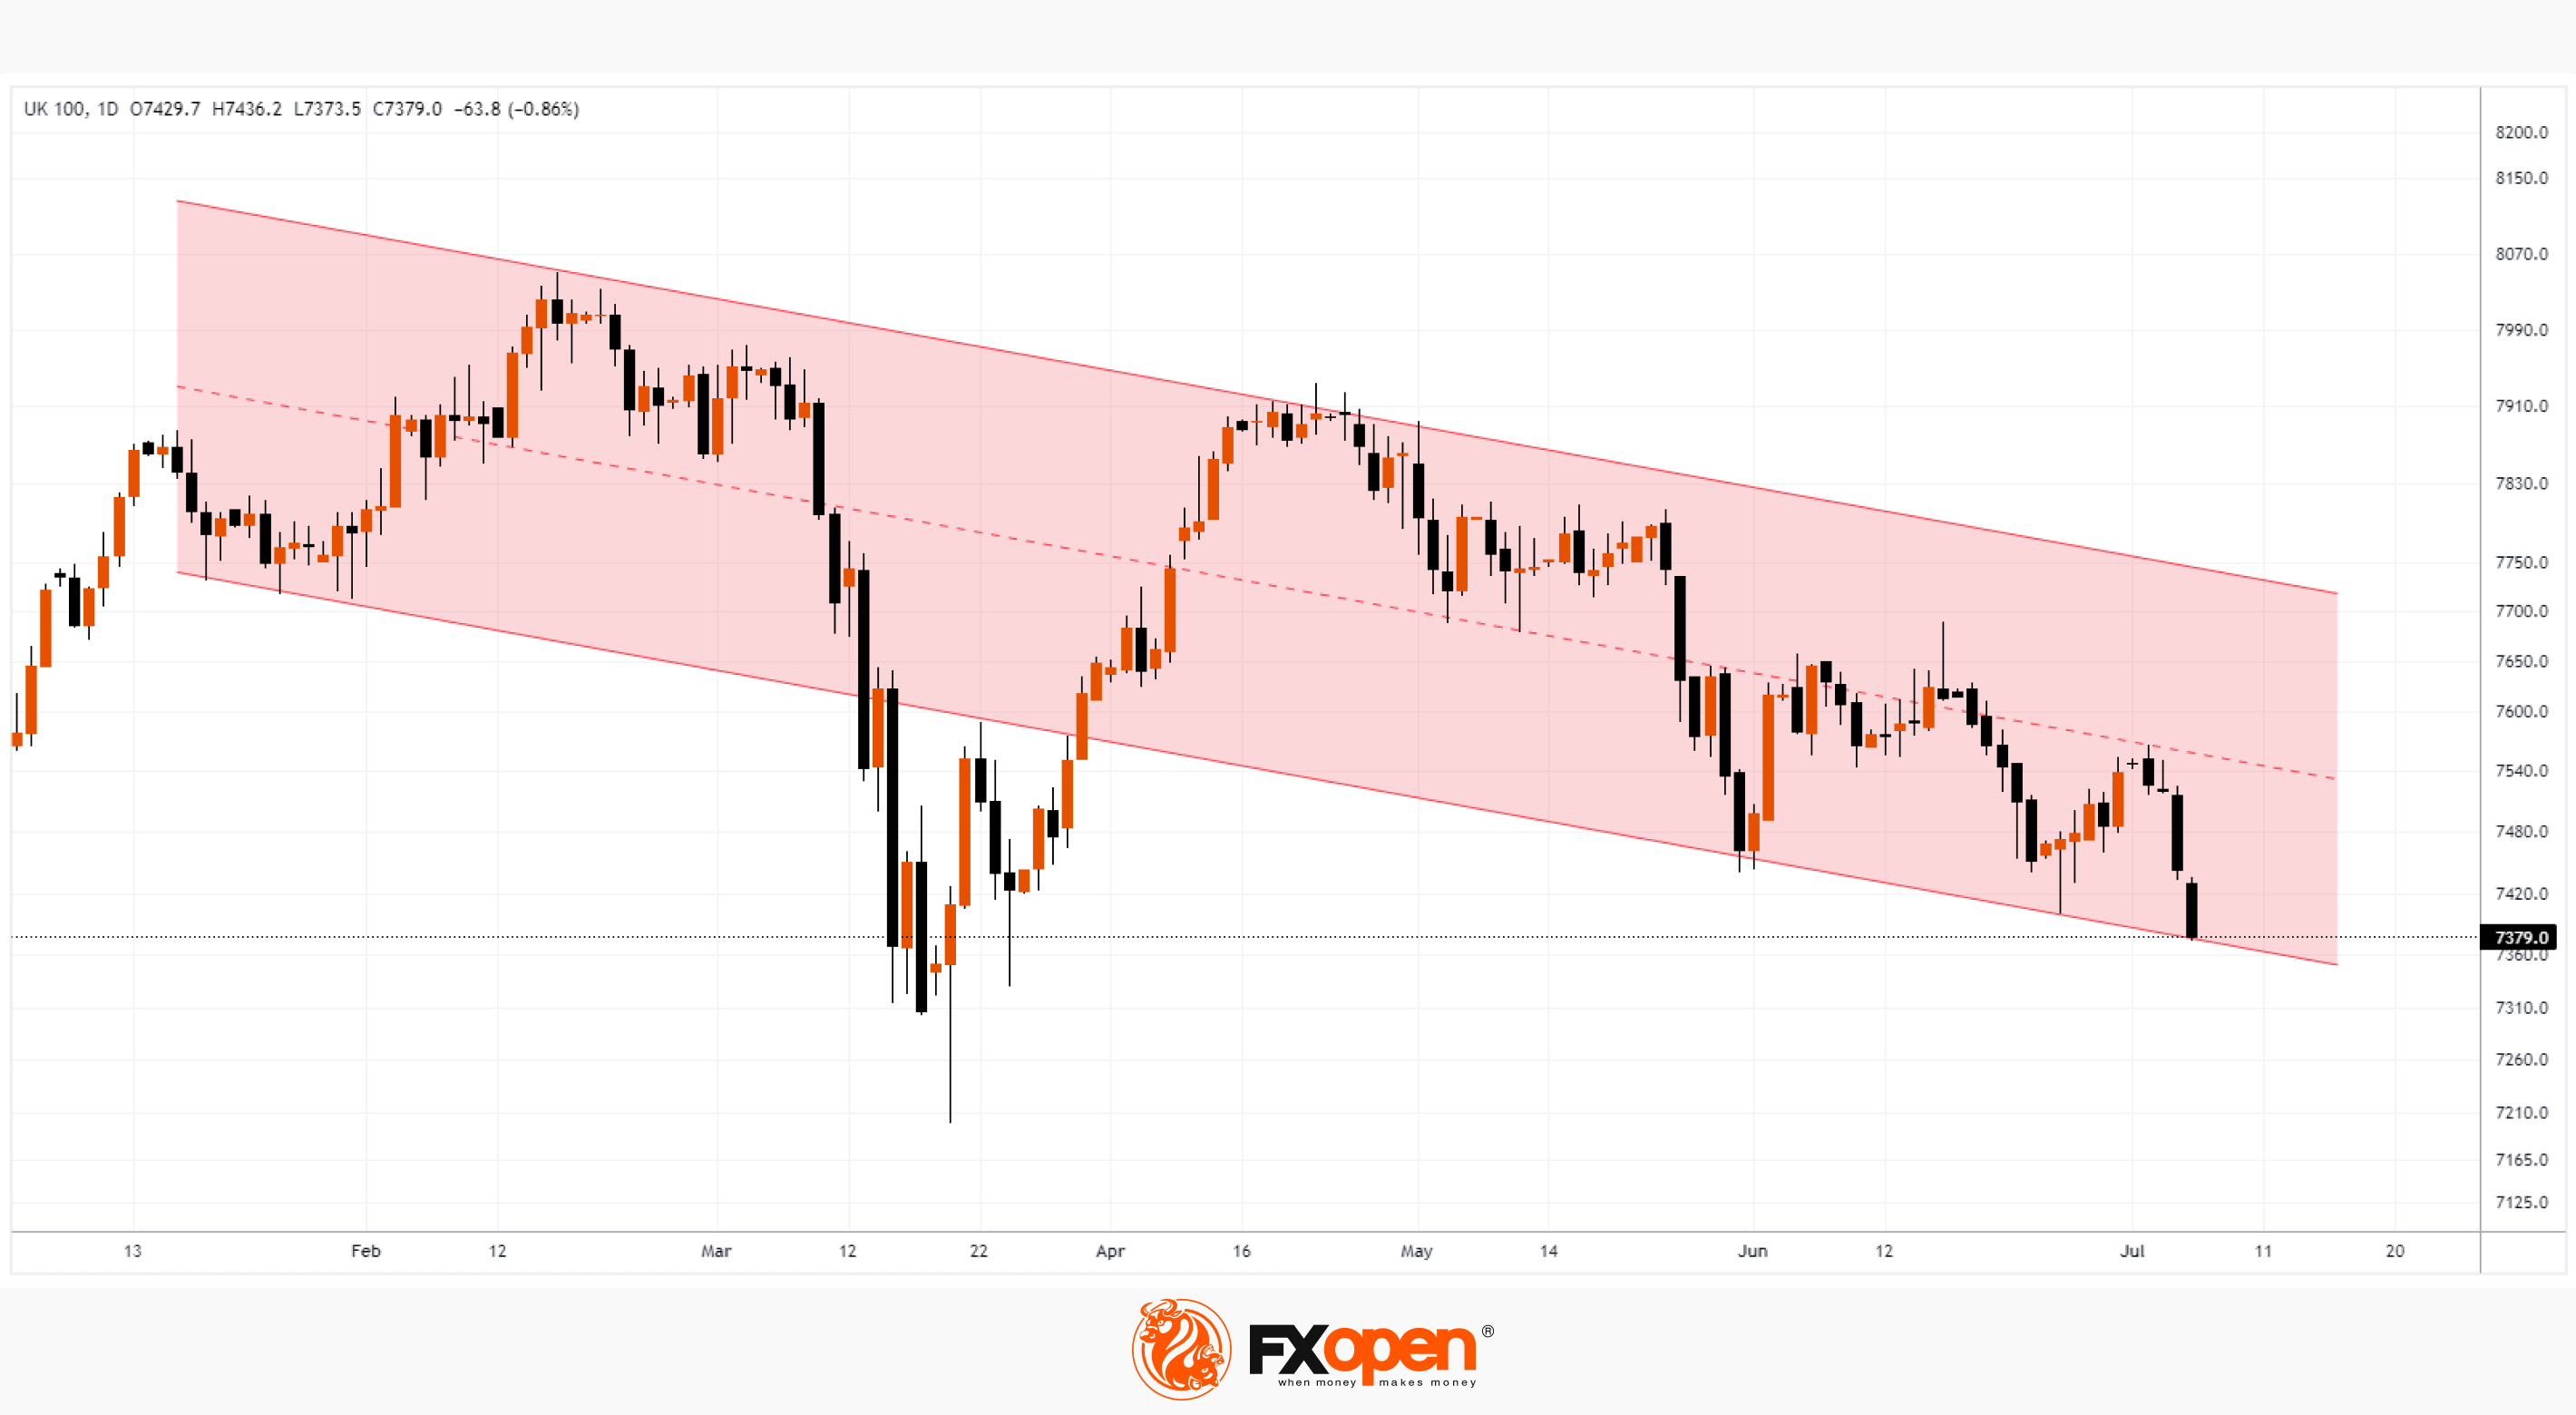
At the same time, the FTSE 100 chart gives hope to the bulls, as the price of the index is at the level of the lower line of the descending channel (shown in red), which, it is possible, will show support properties for the FTSE 100, which may lead to a slowdown in the fall or even a short-term rebound.
To benefit from price trends in the FTSE 100 and other financial markets around the world, consider enlisting the services of a reliable broker like FXOpen.
⚠️
CFDs are complex instruments and come with a high risk of losing your money.
This article represents the opinion of the Companies operating under the FXOpen brand only. It is not to be construed as an offer, solicitation, or recommendation with respect to products and services provided by the Companies operating under the FXOpen brand, nor is it to be considered financial advice.
Market Analysis: FTSE 100 Drops Below June Low
Earlier we wrote about the reasons for the weak behavior of the UK stock market.
Firstly, it is the highest inflation among the G7 countries.
Yesterday JP Morgan analysts suggested that the base rate in the UK could be raised to 7% under certain scenarios. And the likelihood of a hard landing for the British economy next year is rising due to the impact of rising borrowing costs on business confidence and rising unemployment.
Secondly, this is a decline in commodity prices, which is important for the FTSE 100 index, where the share of oil and mining companies is relatively large. Commodity prices reflect expectations of a global economic growth outlook that has been overshadowed by news from China. There, according to the latest data, activity in the services sector in June grew at the slowest pace in 5 months.
At the same time, the FTSE 100 chart gives hope to the bulls, as the price of the index is at the level of the lower line of the descending channel (shown in red), which, it is possible, will show support properties for the FTSE 100, which may lead to a slowdown in the fall or even a short-term rebound.
To benefit from price trends in the FTSE 100 and other financial markets around the world, consider enlisting the services of a reliable broker like FXOpen.
⚠️
CFDs are complex instruments and come with a high risk of losing your money.
This article represents the opinion of the Companies operating under the FXOpen brand only. It is not to be construed as an offer, solicitation, or recommendation with respect to products and services provided by the Companies operating under the FXOpen brand, nor is it to be considered financial advice.