
#marketanalysis #tsla #stockmarket #stocks
The Share Price of TSLA Sharply Declined After the Release of the Report
Following the publication of Tesla's (ticker TSLA) financial results for the fourth quarter of 2023, the company's stock price dropped. The TSLA share price in pre-market trading today is around $195, compared to yesterday's closing price of over $207 (approximately -6%).
Reasons for disappointment:
→ Earnings per share fell short of expectations at $0.71, compared to the Wall Street consensus of $0.73 per share.
→ Quarterly revenue amounted to $25.167 billion, which also fell below the expected $25.640 billion.
→ Additionally, a decrease in profitability was reported, partly attributed to issues with the introduction of the Cybertruck.
→ Tesla also provided a cautious outlook for 2024, warning that the growth rate in car production volumes could be "significantly lower" than in 2023. This is primarily due to the focus on launching the next-generation vehicle at the Gigafactory in Texas.
In October 2023, analysing the TSLA stock chart, it was noted that the price broke below the ascending trend. How does the situation look today?
→ The TSLA price failed to return to the ascending trend (shown in blue) of 2023.
→ The price continues to evolve within the descending trend (shown in red), the contours of which were noticeable as early as October.
After the release of this news, a bearish gap is likely to form at today's opening, and one should be prepared for:
→ Breaking the psychological level of $200 per share – this level may switch its role from support (noticeable in the price action on October 30-31) to resistance.
→ The TSLA share price dropping to the lower half of the descending channel. The median line of this channel will act as resistance.
→ Bears attempting to extend their success to bring the price down to the lower boundary of the channel (around $180).
Investor issues with TSLA stock have been evident for some time, as the price has been noticeably weaker than stock indices reaching peaks in December 2023 - January 2024. If the fundamental backdrop continues to be negative, it is possible that the red descending channel will shape the trajectory of TSLA's price in the first half of 2024.
Buy or sell shares with CFDs in some of the world's biggest publicly listed companies on FXOpen’s trading platform. Open your FXOpen account now or learn more about trading share CFDs with FXOpen.
The Share Price of TSLA Sharply Declined After the Release of the Report
Following the publication of Tesla's (ticker TSLA) financial results for the fourth quarter of 2023, the company's stock price dropped. The TSLA share price in pre-market trading today is around $195, compared to yesterday's closing price of over $207 (approximately -6%).
Reasons for disappointment:
→ Earnings per share fell short of expectations at $0.71, compared to the Wall Street consensus of $0.73 per share.
→ Quarterly revenue amounted to $25.167 billion, which also fell below the expected $25.640 billion.
→ Additionally, a decrease in profitability was reported, partly attributed to issues with the introduction of the Cybertruck.
→ Tesla also provided a cautious outlook for 2024, warning that the growth rate in car production volumes could be "significantly lower" than in 2023. This is primarily due to the focus on launching the next-generation vehicle at the Gigafactory in Texas.
In October 2023, analysing the TSLA stock chart, it was noted that the price broke below the ascending trend. How does the situation look today?
→ The TSLA price failed to return to the ascending trend (shown in blue) of 2023.
→ The price continues to evolve within the descending trend (shown in red), the contours of which were noticeable as early as October.
After the release of this news, a bearish gap is likely to form at today's opening, and one should be prepared for:
→ Breaking the psychological level of $200 per share – this level may switch its role from support (noticeable in the price action on October 30-31) to resistance.
→ The TSLA share price dropping to the lower half of the descending channel. The median line of this channel will act as resistance.
→ Bears attempting to extend their success to bring the price down to the lower boundary of the channel (around $180).
Investor issues with TSLA stock have been evident for some time, as the price has been noticeably weaker than stock indices reaching peaks in December 2023 - January 2024. If the fundamental backdrop continues to be negative, it is possible that the red descending channel will shape the trajectory of TSLA's price in the first half of 2024.
Buy or sell shares with CFDs in some of the world's biggest publicly listed companies on FXOpen’s trading platform. Open your FXOpen account now or learn more about trading share CFDs with FXOpen.

#marketanalysis #XAUUSD #goldprice
The Price of Gold (XAU/USD) Has Descended to a Significant Support Level
The beginning of 2024 has not been the most positive for gold investors, despite a promising December 2023 when XAU/USD prices reached a historical high of $2135.39 per ounce, primarily due to a weak US dollar and expectations that the Federal Reserve (Fed) would begin lowering interest rates.
However, from the first trading day of January, the price of gold (XAU/USD) has fallen from around $2061 to current levels of around $2015 per ounce (a decrease of 2.3%). This is somewhat surprising considering that gold has a reputation as a defensive asset, and geopolitical tensions persist. Perhaps the price is undergoing a correction after reaching a historical high, pulling back from overbought conditions (evident from the RSI indicator).
The XAU/USD gold chart indicates that:
→ the price has descended to the psychological level of $2000 per ounce, which already showed support on January 17th;
→ the price is also near an important trendline (indicated by the thickened blue line), from which support can be expected;
→ the price is forming a consolidation pattern between the thickened red and blue lines.
What's next?
JPMorgan analysts believe that in 2024, the price of gold (XAU/USD) will reach $2300 as the US GDP growth slows down and the Fed reduces interest rates. However, they suggest that this is likely to happen in the second half of the year, and in the first half, a decline is more probable, increasing the likelihood of a bearish breakout from the current consolidation pattern.
Start trading commodities with tight spreads. Open your trading account now or learn more about trading commodity CFDs with FXOpen.
CFDs are complex instruments and come with a high risk of losing your money.
This article represents the opinion of the Companies operating under the FXOpen brand only. It is not to be construed as an offer, solicitation, or recommendation with respect to products and services provided by the Companies operating under the FXOpen brand, nor is it to be considered financial advice.
The Price of Gold (XAU/USD) Has Descended to a Significant Support Level
The beginning of 2024 has not been the most positive for gold investors, despite a promising December 2023 when XAU/USD prices reached a historical high of $2135.39 per ounce, primarily due to a weak US dollar and expectations that the Federal Reserve (Fed) would begin lowering interest rates.
However, from the first trading day of January, the price of gold (XAU/USD) has fallen from around $2061 to current levels of around $2015 per ounce (a decrease of 2.3%). This is somewhat surprising considering that gold has a reputation as a defensive asset, and geopolitical tensions persist. Perhaps the price is undergoing a correction after reaching a historical high, pulling back from overbought conditions (evident from the RSI indicator).
The XAU/USD gold chart indicates that:
→ the price has descended to the psychological level of $2000 per ounce, which already showed support on January 17th;
→ the price is also near an important trendline (indicated by the thickened blue line), from which support can be expected;
→ the price is forming a consolidation pattern between the thickened red and blue lines.
What's next?
JPMorgan analysts believe that in 2024, the price of gold (XAU/USD) will reach $2300 as the US GDP growth slows down and the Fed reduces interest rates. However, they suggest that this is likely to happen in the second half of the year, and in the first half, a decline is more probable, increasing the likelihood of a bearish breakout from the current consolidation pattern.
Start trading commodities with tight spreads. Open your trading account now or learn more about trading commodity CFDs with FXOpen.
CFDs are complex instruments and come with a high risk of losing your money.
This article represents the opinion of the Companies operating under the FXOpen brand only. It is not to be construed as an offer, solicitation, or recommendation with respect to products and services provided by the Companies operating under the FXOpen brand, nor is it to be considered financial advice.

#stockmarket #stocks #MarketNews #IBM
IBM Share Price Soars Nearly 10%
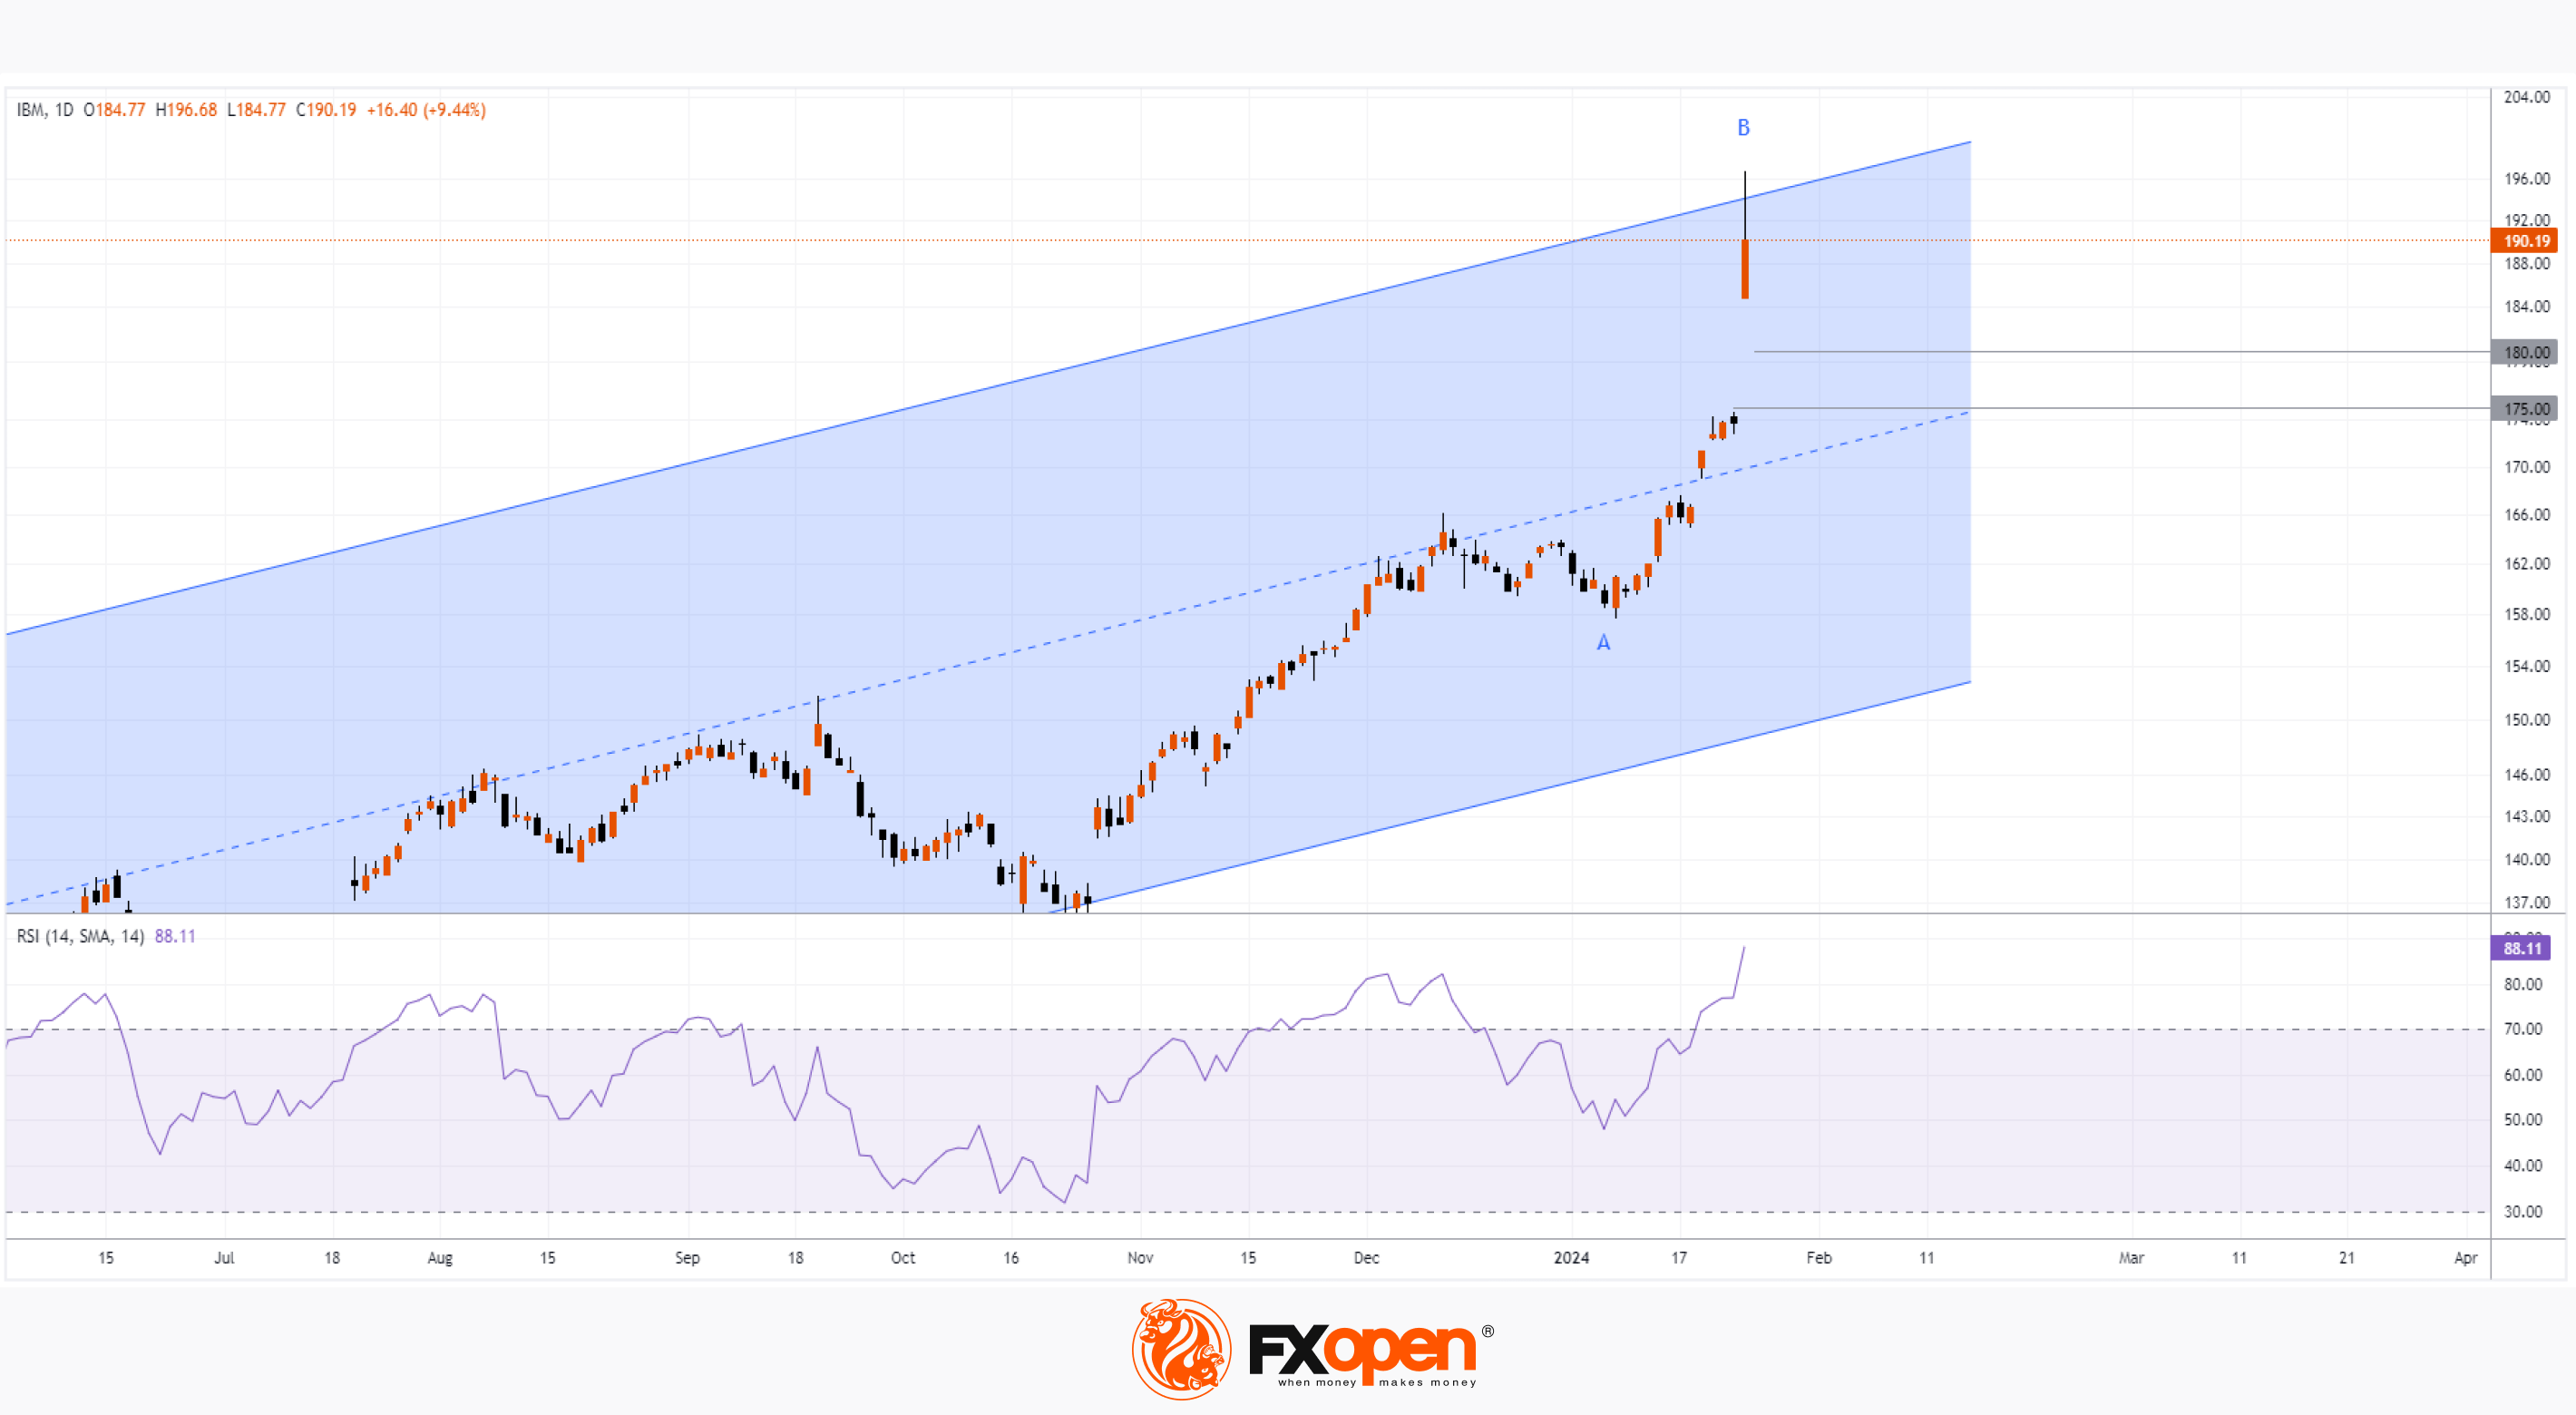
As the chart shows, the closing price on January 24 = USD 173.79, closing price on January 25 = USD 190.19. At yesterday's peak, IBM's share price was above USD 196, helped by a strong fourth-quarter earnings report that was positive about the company's prospects due to advances in AI.
→ Total revenue was USD 17.381 billion, compared to USD 16.690 billion in the prior-year quarter.
→ The acquisition of Red Hat made IBM the fifth-largest cloud service provider by market share. This is very important given the industry's projected growth rate of 16% per year until 2028.
→ Advances in quantum computing, exemplified by the release of the 127-qubit Eagle quantum chip.
In addition, the company has increased dividends for 28 years in a row, making IBM shares attractive to a wide range of investors.
Technical analysis of the IBM stock price chart shows that:
→ the price has reached the upper border of the parallel channel (shown in blue);
→ the RSI indicator indicates strong overbought;
→ a long upper shadow formed on yesterday’s candle – a sign of sales activity. It is acceptable to assume that some investors rushed to take profits in order to later find an opportunity to re-enter a long position at lower prices.
Indeed, given the chart situation, IBM's share price is vulnerable to a pullback following the extremely positive report. If a pullback occurs, the price may find support in the area between the psychological levels of USD 175 and USD 180 per share of IBM, where the 50% Fibonacci level of the upward impulse A→B passes. The channel median line can also help the bulls.
Buy or sell shares with CFDs in some of the world's biggest publicly listed companies on FXOpen’s trading platform. Open your FXOpen account now or learn more about trading share CFDs with FXOpen.
CFDs are complex instruments and come with a high risk of losing your money.
This article represents the opinion of the Companies operating under the FXOpen brand only. It is not to be construed as an offer, solicitation, or recommendation with respect to products and services provided by the Companies operating under the FXOpen brand, nor is it to be considered financial advice.
IBM Share Price Soars Nearly 10%
As the chart shows, the closing price on January 24 = USD 173.79, closing price on January 25 = USD 190.19. At yesterday's peak, IBM's share price was above USD 196, helped by a strong fourth-quarter earnings report that was positive about the company's prospects due to advances in AI.
→ Total revenue was USD 17.381 billion, compared to USD 16.690 billion in the prior-year quarter.
→ The acquisition of Red Hat made IBM the fifth-largest cloud service provider by market share. This is very important given the industry's projected growth rate of 16% per year until 2028.
→ Advances in quantum computing, exemplified by the release of the 127-qubit Eagle quantum chip.
In addition, the company has increased dividends for 28 years in a row, making IBM shares attractive to a wide range of investors.
Technical analysis of the IBM stock price chart shows that:
→ the price has reached the upper border of the parallel channel (shown in blue);
→ the RSI indicator indicates strong overbought;
→ a long upper shadow formed on yesterday’s candle – a sign of sales activity. It is acceptable to assume that some investors rushed to take profits in order to later find an opportunity to re-enter a long position at lower prices.
Indeed, given the chart situation, IBM's share price is vulnerable to a pullback following the extremely positive report. If a pullback occurs, the price may find support in the area between the psychological levels of USD 175 and USD 180 per share of IBM, where the 50% Fibonacci level of the upward impulse A→B passes. The channel median line can also help the bulls.
Buy or sell shares with CFDs in some of the world's biggest publicly listed companies on FXOpen’s trading platform. Open your FXOpen account now or learn more about trading share CFDs with FXOpen.
CFDs are complex instruments and come with a high risk of losing your money.
This article represents the opinion of the Companies operating under the FXOpen brand only. It is not to be construed as an offer, solicitation, or recommendation with respect to products and services provided by the Companies operating under the FXOpen brand, nor is it to be considered financial advice.
👍1
#marketanalysis #MarketNews #oilprices
Against the Background of Geopolitical Tension, the price of Brent Oil Has Reached an Important Resistance Zone
The reasons for the rise in Brent oil prices are a drone attack on an American military base in Jordan, as well as an attack on an oil tanker in the Red Sea. These events cause concerns about the safety of oil transportation through the Red Sea and the potential escalation of the conflict in the Middle East. Bloomberg writes that President Biden is under pressure, and the response can be decisive.
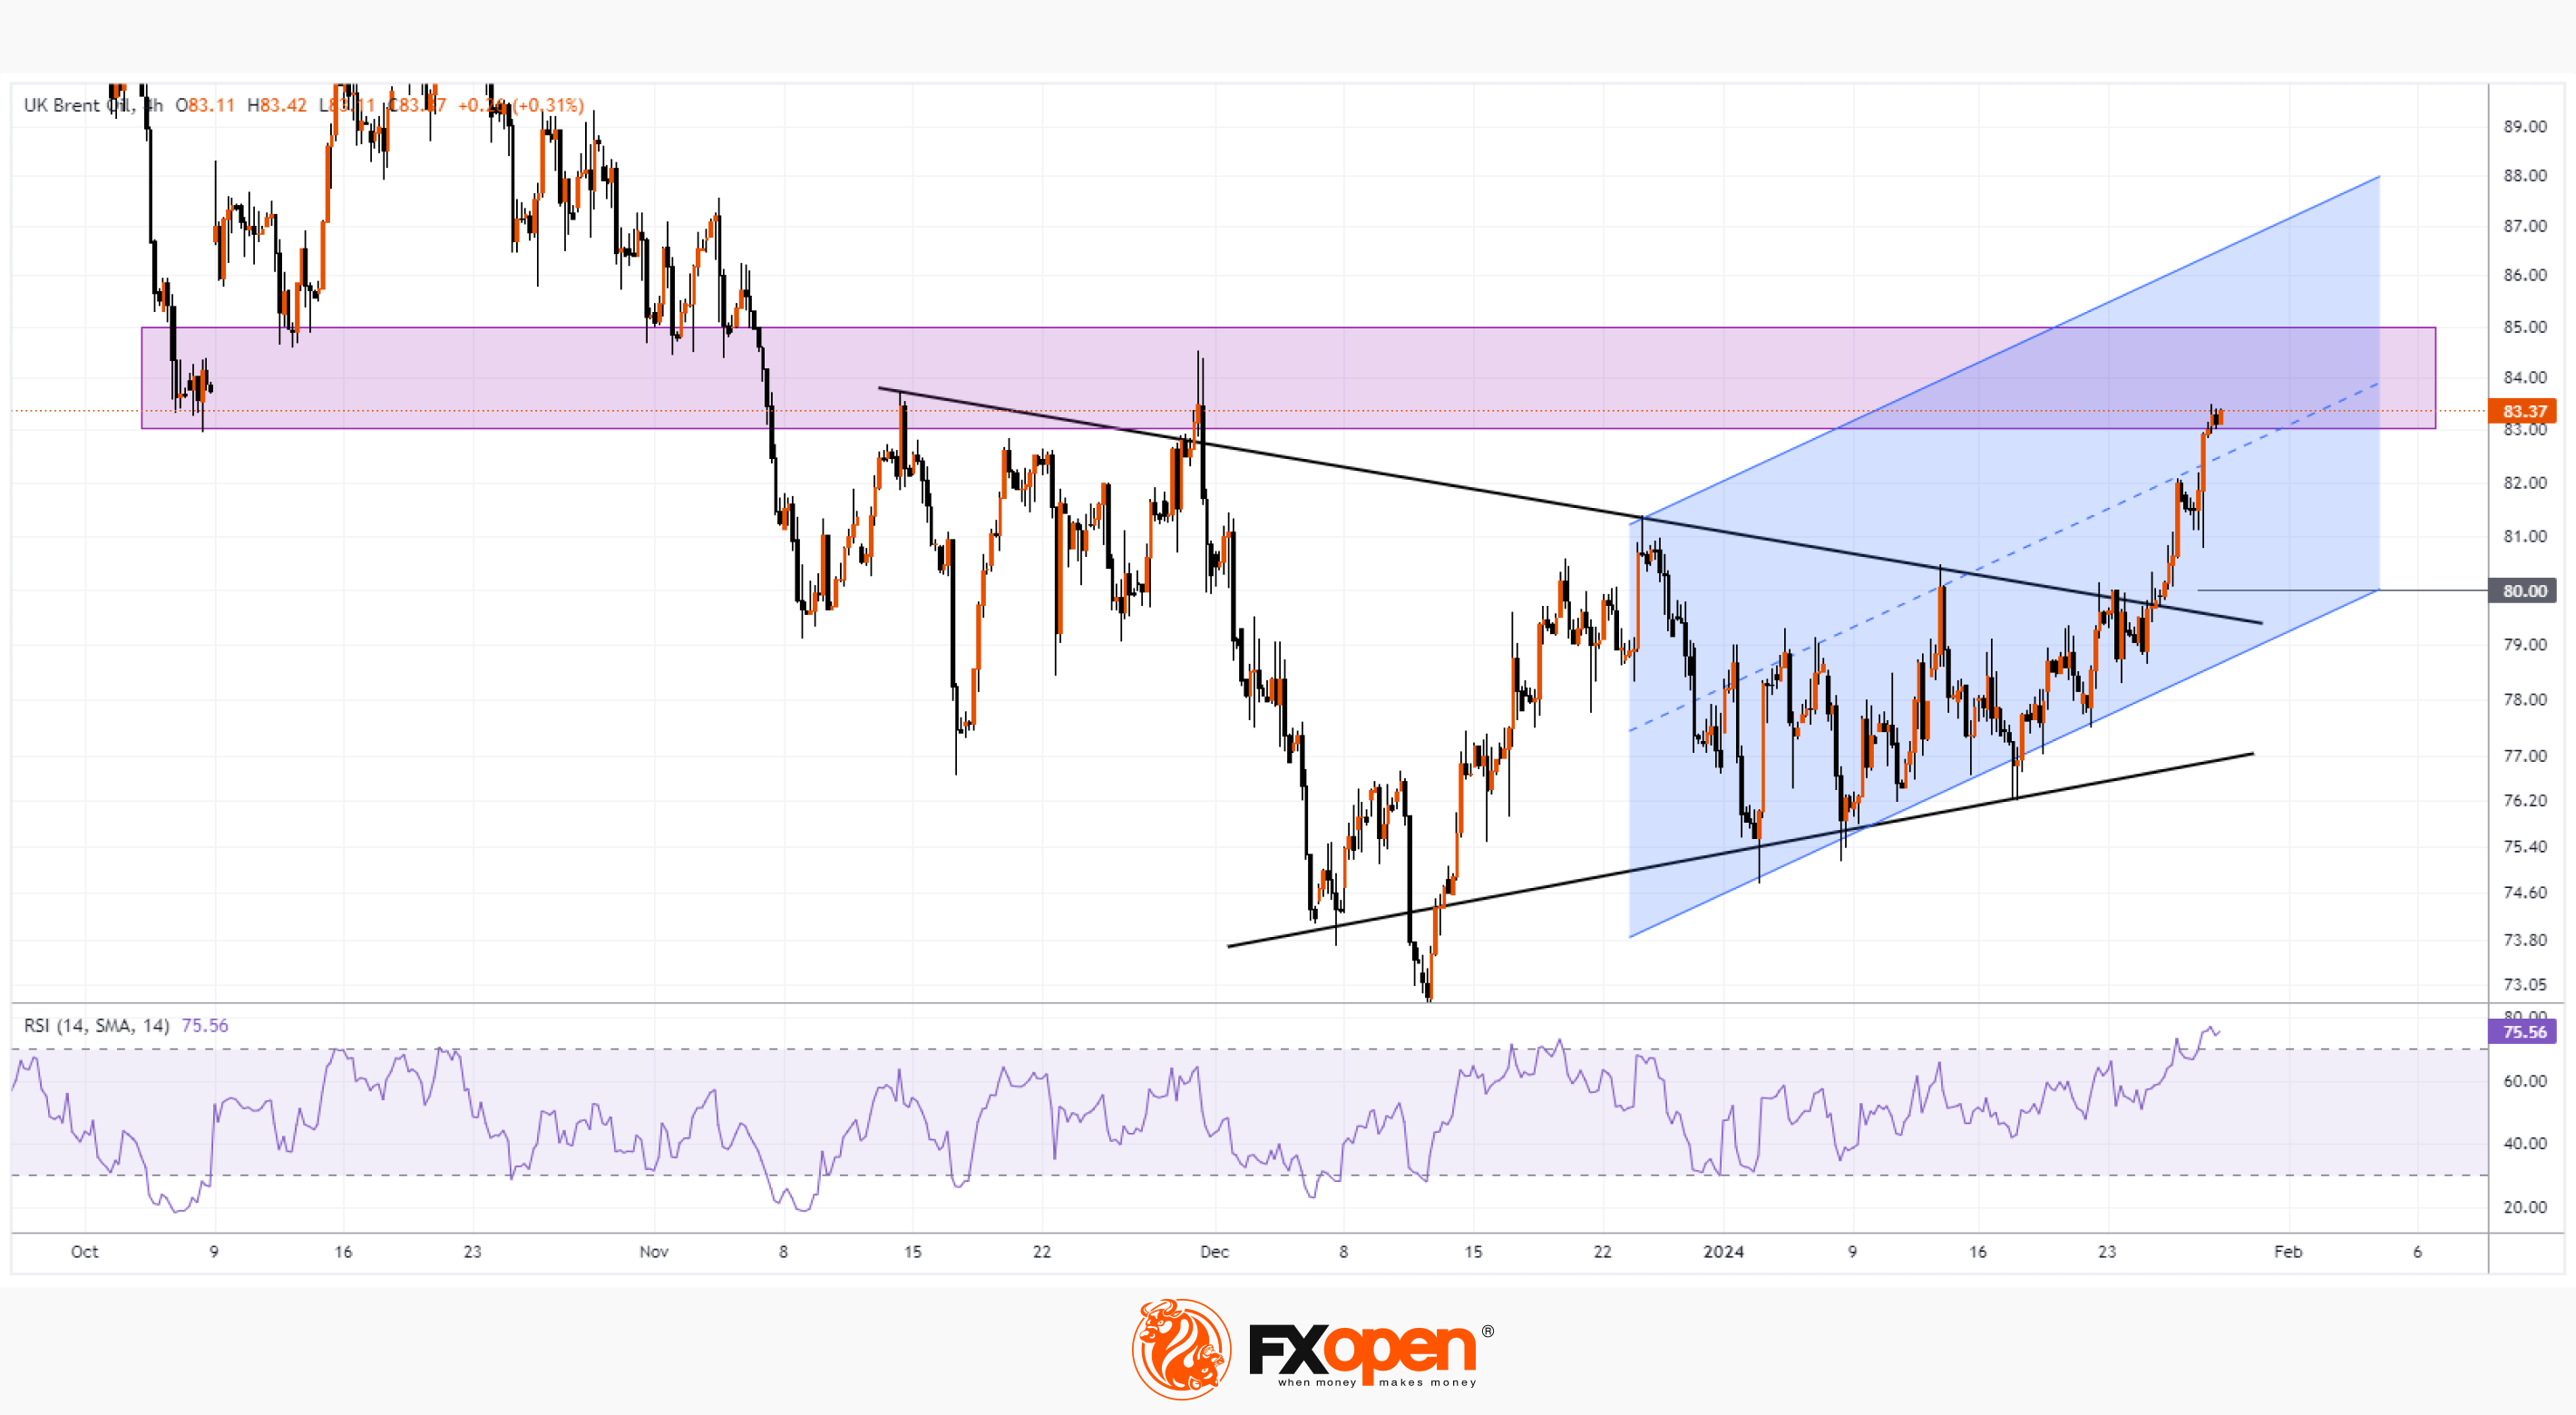
The Brent crude oil chart today shows that:
→ The price strengthened higher than the zone of consolidation (shown by narrowing black lines), having completed its bullish break at the psychological level of 80 US dollars per barrel.
→ The price forms an ascending channel (shown in blue).
→ The price rose to the USD 83.00-85.00 zone, which previously served as a support area, but changed its role in November.
→ The market is overbought, judging by the readings of the RSI indicator.
If the geopolitical tension increases, then the bulls can try to raise the price of Brent oil through the specified zone - it is possible that it will reach the upper border of the channel.
On the other hand, if the fundamental background indicates a decrease in the degree of threats in the Middle East, the price can form a pullback from the resistance zone so that the RSI drops closer to values around 50.
Start trading commodity CFDs with tight spreads. Open your trading account now or learn more about trading commodity CFDs with FXOpen.
CFDs are complex instruments and come with a high risk of losing your money.
This article represents the opinion of the Companies operating under the FXOpen brand only. It is not to be construed as an offer, solicitation, or recommendation with respect to products and services provided by the Companies operating under the FXOpen brand, nor is it to be considered financial advice.
Against the Background of Geopolitical Tension, the price of Brent Oil Has Reached an Important Resistance Zone
The reasons for the rise in Brent oil prices are a drone attack on an American military base in Jordan, as well as an attack on an oil tanker in the Red Sea. These events cause concerns about the safety of oil transportation through the Red Sea and the potential escalation of the conflict in the Middle East. Bloomberg writes that President Biden is under pressure, and the response can be decisive.
The Brent crude oil chart today shows that:
→ The price strengthened higher than the zone of consolidation (shown by narrowing black lines), having completed its bullish break at the psychological level of 80 US dollars per barrel.
→ The price forms an ascending channel (shown in blue).
→ The price rose to the USD 83.00-85.00 zone, which previously served as a support area, but changed its role in November.
→ The market is overbought, judging by the readings of the RSI indicator.
If the geopolitical tension increases, then the bulls can try to raise the price of Brent oil through the specified zone - it is possible that it will reach the upper border of the channel.
On the other hand, if the fundamental background indicates a decrease in the degree of threats in the Middle East, the price can form a pullback from the resistance zone so that the RSI drops closer to values around 50.
Start trading commodity CFDs with tight spreads. Open your trading account now or learn more about trading commodity CFDs with FXOpen.
CFDs are complex instruments and come with a high risk of losing your money.
This article represents the opinion of the Companies operating under the FXOpen brand only. It is not to be construed as an offer, solicitation, or recommendation with respect to products and services provided by the Companies operating under the FXOpen brand, nor is it to be considered financial advice.
#stockmarket #marketanalysis #stocks
The Hang Seng Index is Near Important Support
The economy of China is hit by the decision to liquidate the developer Evergrande due to a debt of USD 300 billion. Bloomberg writes that this will have huge consequences for all of China.
While the S&P 500 index rose by more than 3% since the beginning of January, the Hang Seng index fell by more than 8%. JPMorgan and HSBC point to local government debt, non-performing bank loans and negative sentiment in the private sector.
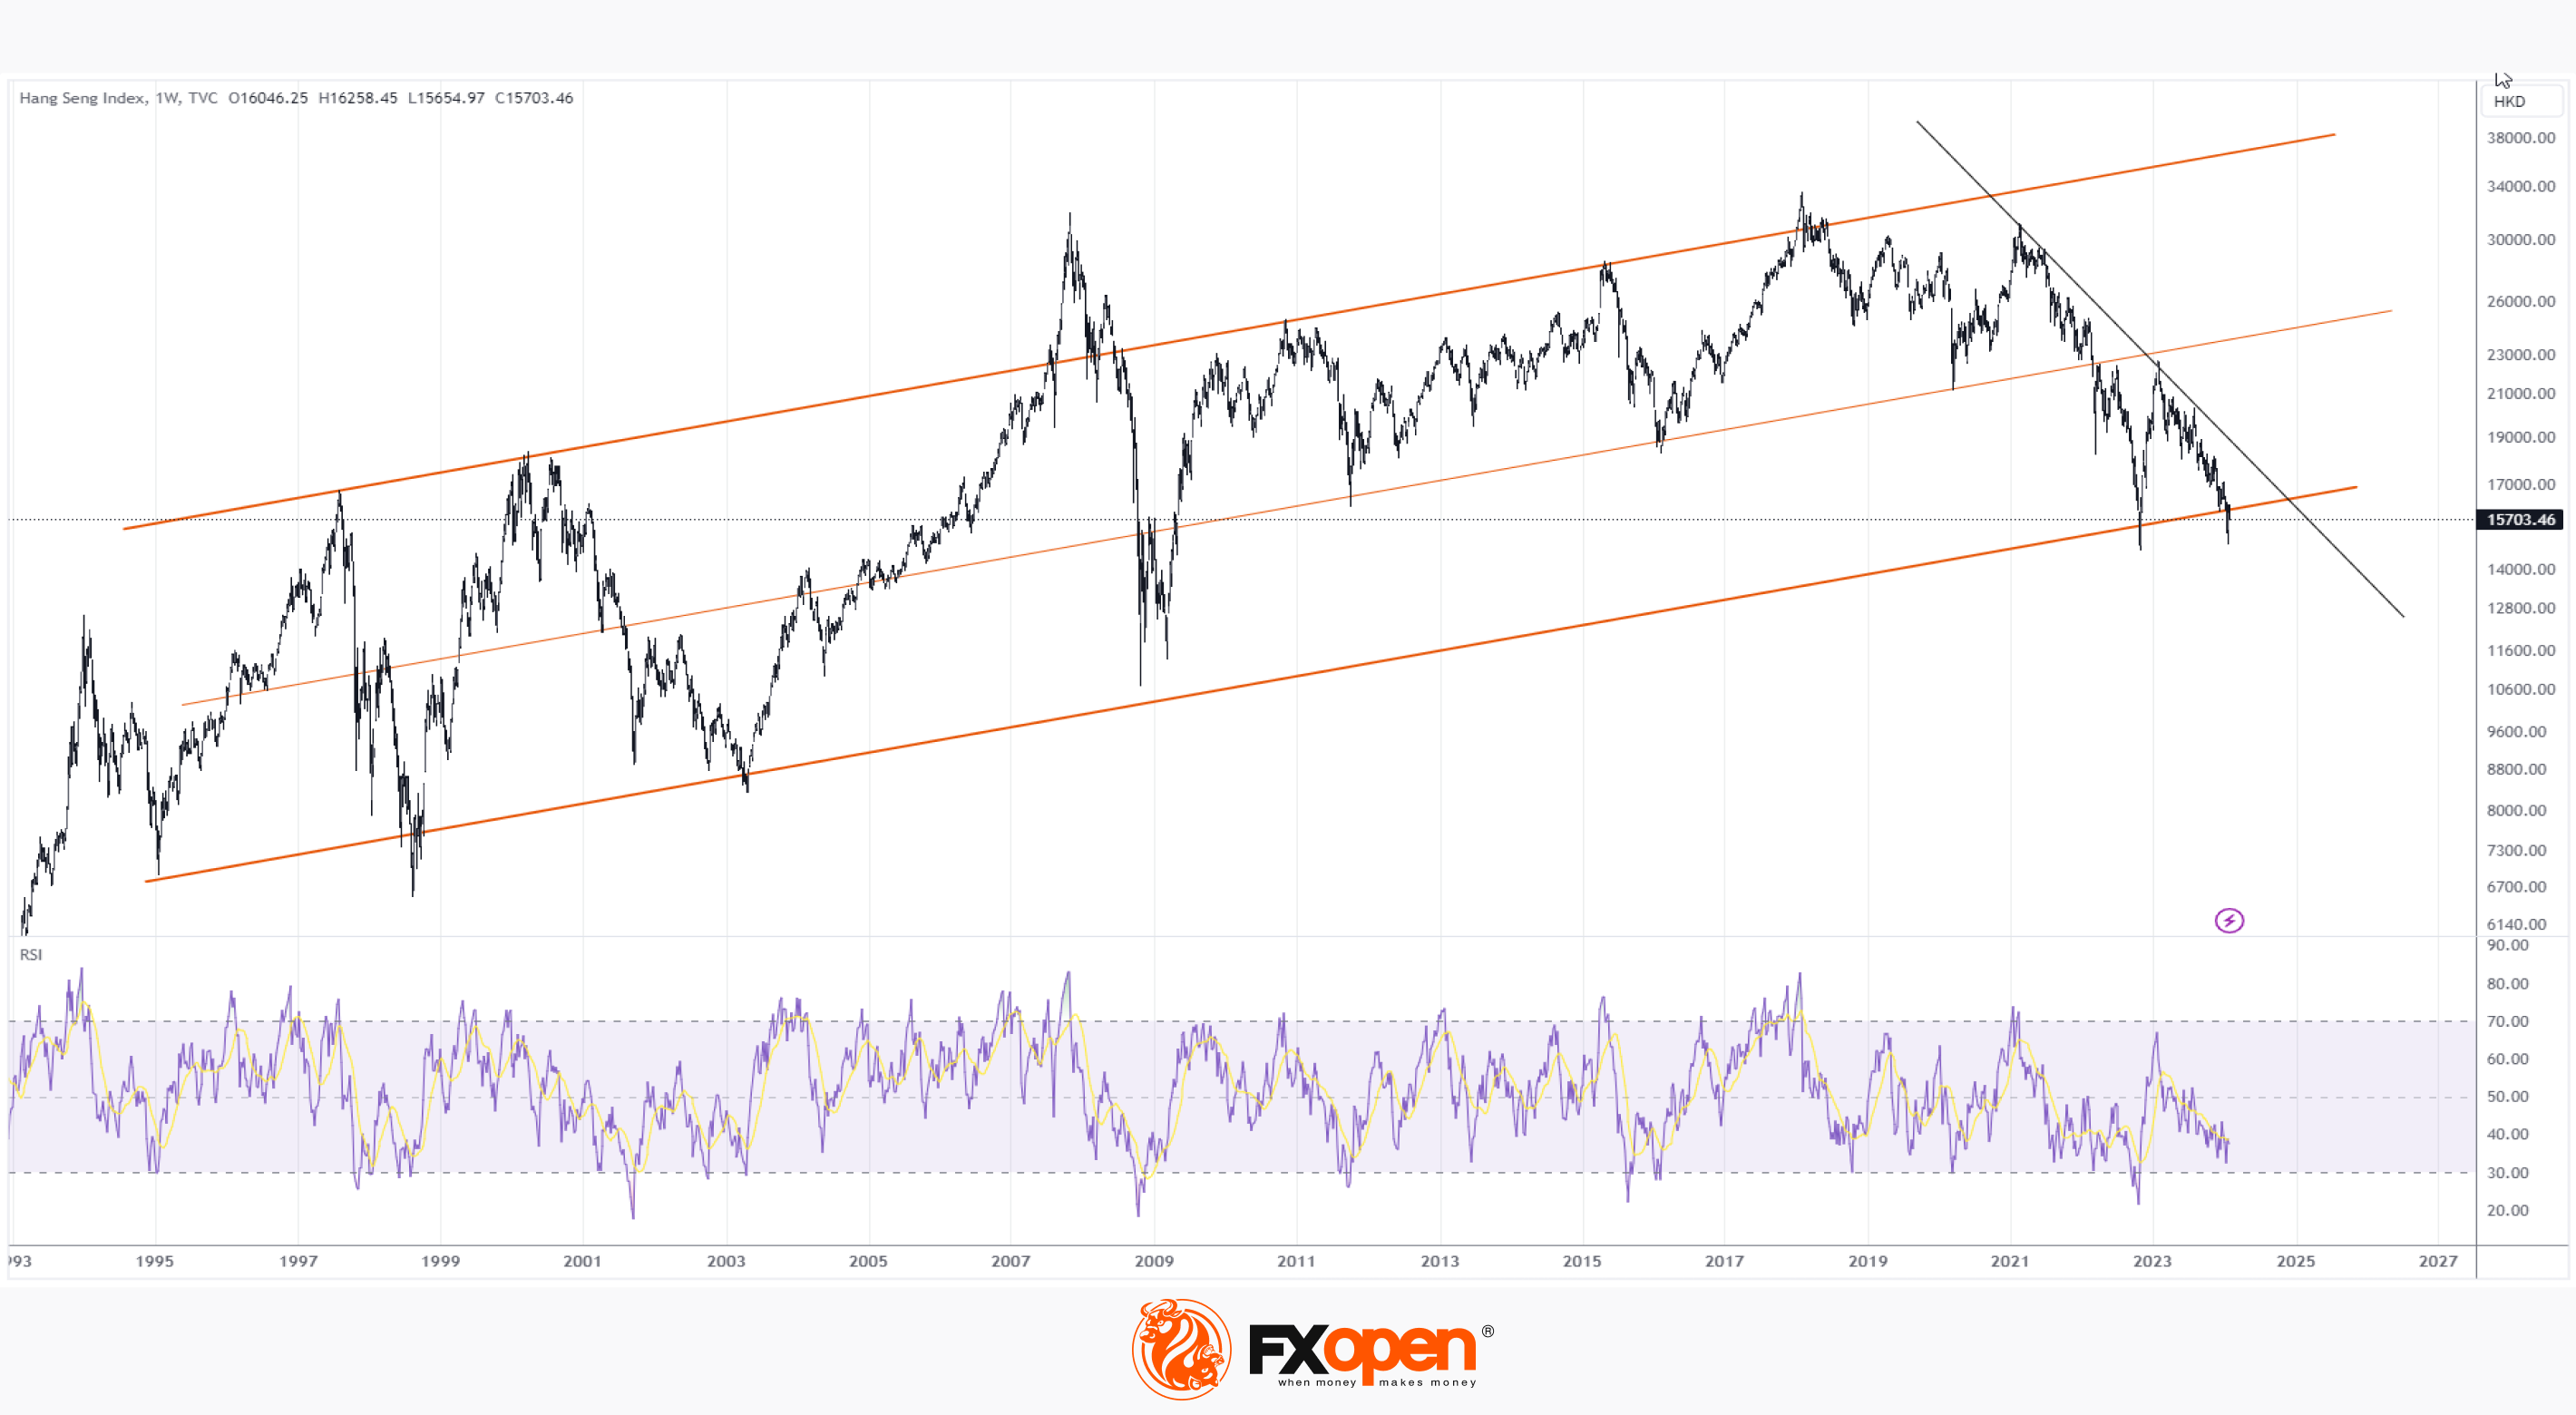
The weekly chart of the stock index Hang Seng (HSI) shows that:
→ The price is in a downward trend, which is shown by the black line.
→ The price dropped close to the 2022 minimum.
→ The RSI indicator is located near the oversold zone.
What is important: the price is near the lower border of the long-term channel (shown by orange lines), from which support can be expected.
Expectations of investors to lower the interest rate from the Fed may increase the appetite for risky assets, which features Chinese stocks.
As Reuters writes, Goldman Sachs noted in its note to clients that hedge funds are actively buying Chinese shares - for the period from January 23 to 25, there was the largest capital inflow in the last 5 years. Perhaps the managers of hedge funds believe that the plans of the Chinese authorities to stimulate the economy for more than $280 billion will become a reality, and the price of the Hang Seng index will make a jump from the lower border of the long-term channel, breaking the black line of the downward trend.
Trade global index CFDs with zero commission and tight spreads. Open your FXOpen account now or learn more about trading index CFDs with FXOpen.
CFDs are complex instruments and come with a high risk of losing your money.
This article represents the opinion of the Companies operating under the FXOpen brand only. It is not to be construed as an offer, solicitation, or recommendation with respect to products and services provided by the Companies operating under the FXOpen brand, nor is it to be considered financial advice.
The Hang Seng Index is Near Important Support
The economy of China is hit by the decision to liquidate the developer Evergrande due to a debt of USD 300 billion. Bloomberg writes that this will have huge consequences for all of China.
While the S&P 500 index rose by more than 3% since the beginning of January, the Hang Seng index fell by more than 8%. JPMorgan and HSBC point to local government debt, non-performing bank loans and negative sentiment in the private sector.
The weekly chart of the stock index Hang Seng (HSI) shows that:
→ The price is in a downward trend, which is shown by the black line.
→ The price dropped close to the 2022 minimum.
→ The RSI indicator is located near the oversold zone.
What is important: the price is near the lower border of the long-term channel (shown by orange lines), from which support can be expected.
Expectations of investors to lower the interest rate from the Fed may increase the appetite for risky assets, which features Chinese stocks.
As Reuters writes, Goldman Sachs noted in its note to clients that hedge funds are actively buying Chinese shares - for the period from January 23 to 25, there was the largest capital inflow in the last 5 years. Perhaps the managers of hedge funds believe that the plans of the Chinese authorities to stimulate the economy for more than $280 billion will become a reality, and the price of the Hang Seng index will make a jump from the lower border of the long-term channel, breaking the black line of the downward trend.
Trade global index CFDs with zero commission and tight spreads. Open your FXOpen account now or learn more about trading index CFDs with FXOpen.
CFDs are complex instruments and come with a high risk of losing your money.
This article represents the opinion of the Companies operating under the FXOpen brand only. It is not to be construed as an offer, solicitation, or recommendation with respect to products and services provided by the Companies operating under the FXOpen brand, nor is it to be considered financial advice.
#stockmarket #NASDAQ #MarketNews
NASDAQ Falls by 1.5% after Tech Giants Reports
NASDAQ E-Mini futures fell 1.5% in early trading after the publication of quarterly earnings reports from technology giants Google (GOOG), Microsoft (MSFT) and Advanced Micro Devices (AMD):
→ The parent company of Google, Alphabet Inc., reported revenue of 86.3 billion dollars (forecast = 85.2), however, the slowdown in advertising revenue – the most important article in the company's revenue – caused the price of GOOG shares to drop by 2.7% after publication report
→ Microsoft's revenue amounted to 62.0 billion US dollars, increasing by 10% (forecast = 61.2%). Despite the high performance of the cloud segment Azure, the price of Microsoft shares decreased by 3.2% after the publication. Perhaps the MSFT stock market is overbought due to the extreme optimism associated with AI implementation.
→ AMD, the leading semiconductor manufacturing company, also exceeded expectations. Its income was 6.16 billion US dollars (forecast = 6.12). However, the company made a cautious forecast for the next quarter. The price of AMD shares fell by 4.5%.
The cumulative effect of these messages strongly influenced the price of the NASDAQ E-Mini index. Perhaps the market is “letting off steam” after the impressive growth that began in 2023. MarketWatch conveys the opinions of JPMorgan analysts — they believe that today's stock market, which is dominated by large technology companies, has signs of a dotcom bubble.
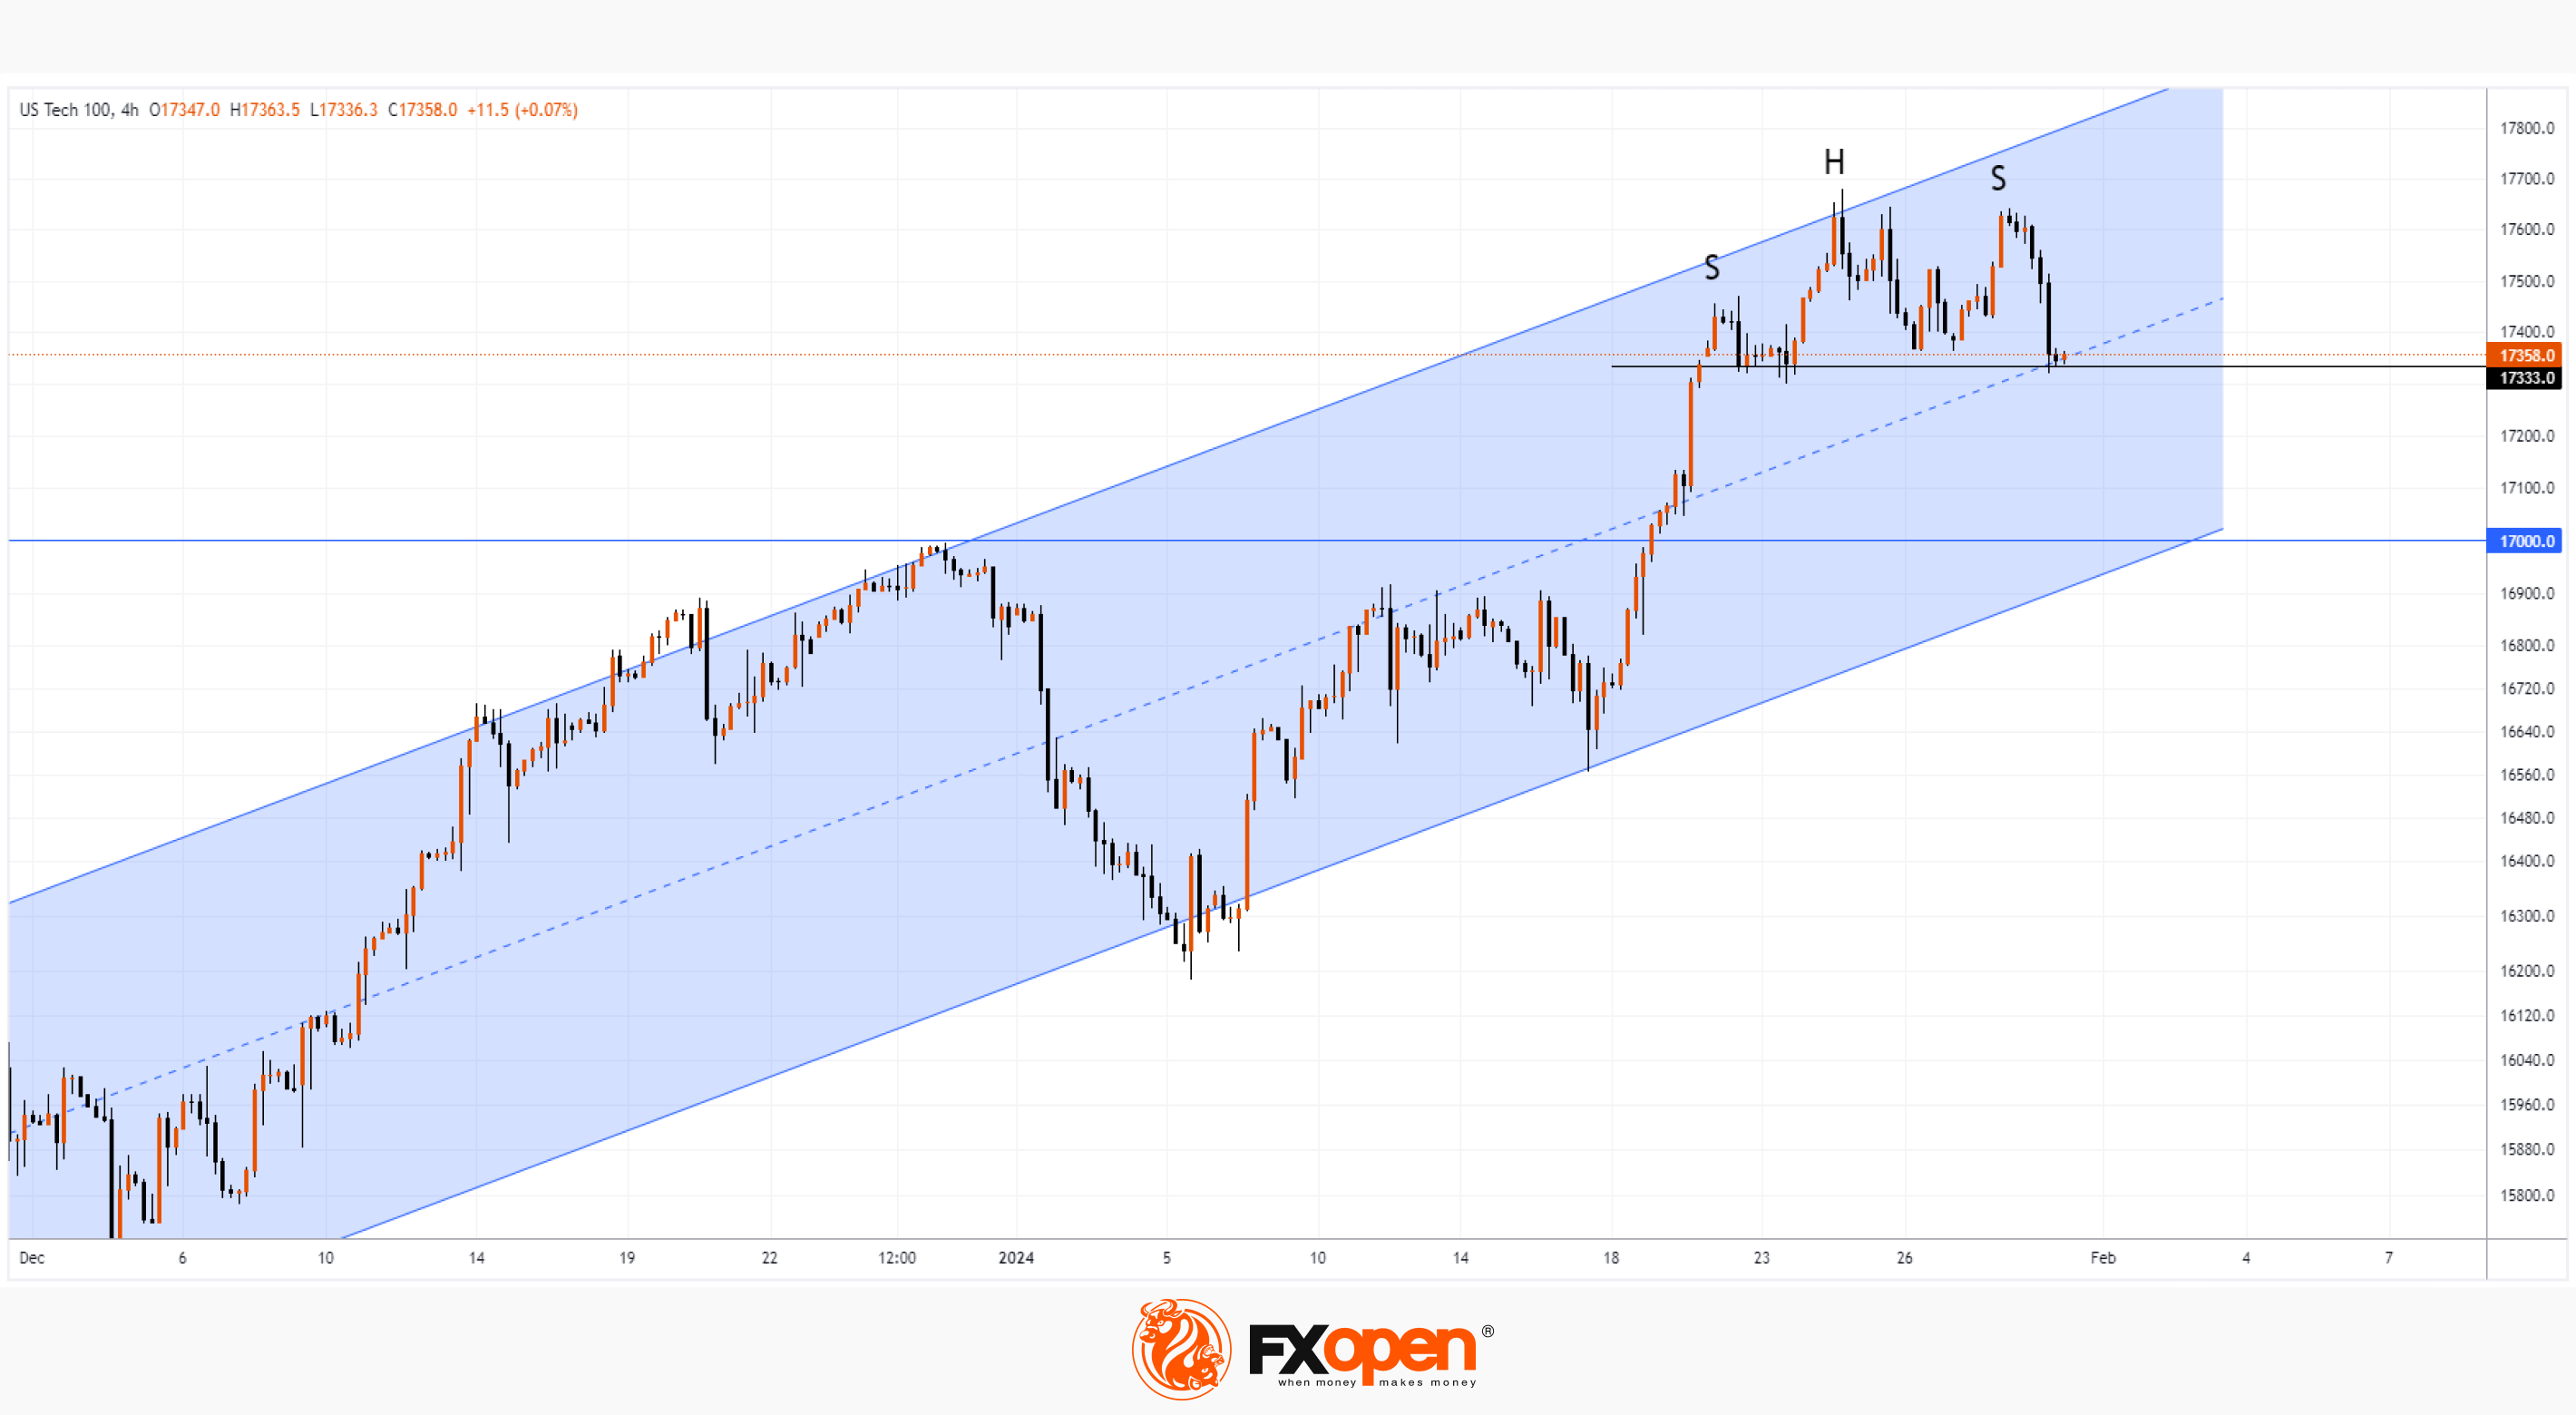
The NASDAQ 100 chart shows that:
→ price forms a bear pattern head-and-shoulders;
→ the price is located near the support block, which forms the median line of the ascending channel (shown in blue) and the support level is 17333.
If bearish sentiments intensify at the opening of the main trading session, the bears can break through the specified support block and direct the price to the block that forms the psychological level of 17,000 and the lower border of the channel.
Buy and sell stocks of the world's biggest publicly-listed companies with CFDs on FXOpen’s trading platform. Open your FXOpen account now or learn more about trading share CFDs with FXOpen.
CFDs are complex instruments and come with a high risk of losing your money.
This article represents the opinion of the Companies operating under the FXOpen brand only. It is not to be construed as an offer, solicitation, or recommendation with respect to products and services provided by the Companies operating under the FXOpen brand, nor is it to be considered financial advice.
NASDAQ Falls by 1.5% after Tech Giants Reports
NASDAQ E-Mini futures fell 1.5% in early trading after the publication of quarterly earnings reports from technology giants Google (GOOG), Microsoft (MSFT) and Advanced Micro Devices (AMD):
→ The parent company of Google, Alphabet Inc., reported revenue of 86.3 billion dollars (forecast = 85.2), however, the slowdown in advertising revenue – the most important article in the company's revenue – caused the price of GOOG shares to drop by 2.7% after publication report
→ Microsoft's revenue amounted to 62.0 billion US dollars, increasing by 10% (forecast = 61.2%). Despite the high performance of the cloud segment Azure, the price of Microsoft shares decreased by 3.2% after the publication. Perhaps the MSFT stock market is overbought due to the extreme optimism associated with AI implementation.
→ AMD, the leading semiconductor manufacturing company, also exceeded expectations. Its income was 6.16 billion US dollars (forecast = 6.12). However, the company made a cautious forecast for the next quarter. The price of AMD shares fell by 4.5%.
The cumulative effect of these messages strongly influenced the price of the NASDAQ E-Mini index. Perhaps the market is “letting off steam” after the impressive growth that began in 2023. MarketWatch conveys the opinions of JPMorgan analysts — they believe that today's stock market, which is dominated by large technology companies, has signs of a dotcom bubble.
The NASDAQ 100 chart shows that:
→ price forms a bear pattern head-and-shoulders;
→ the price is located near the support block, which forms the median line of the ascending channel (shown in blue) and the support level is 17333.
If bearish sentiments intensify at the opening of the main trading session, the bears can break through the specified support block and direct the price to the block that forms the psychological level of 17,000 and the lower border of the channel.
Buy and sell stocks of the world's biggest publicly-listed companies with CFDs on FXOpen’s trading platform. Open your FXOpen account now or learn more about trading share CFDs with FXOpen.
CFDs are complex instruments and come with a high risk of losing your money.
This article represents the opinion of the Companies operating under the FXOpen brand only. It is not to be construed as an offer, solicitation, or recommendation with respect to products and services provided by the Companies operating under the FXOpen brand, nor is it to be considered financial advice.
#marketanalysis #MarketNews #forextrading
News from the Fed Push Down EUR/USD Price to a Year Low
Financial markets were buoyant last night due to news from the Fed. Interest rates remained unchanged — as expected. However, somewhat unexpected was the harsh rhetoric of Jerome Powell, who said that:
→ interest rate reduction in March is unlikely;
→ the Fed needs to see more data to be confident in the rate change.
This cooled financial market expectations for a rate cut in March, which in turn led to a strengthening of the US dollar relative to other currencies and a decline in stock indices, with risk assets falling especially sharply.
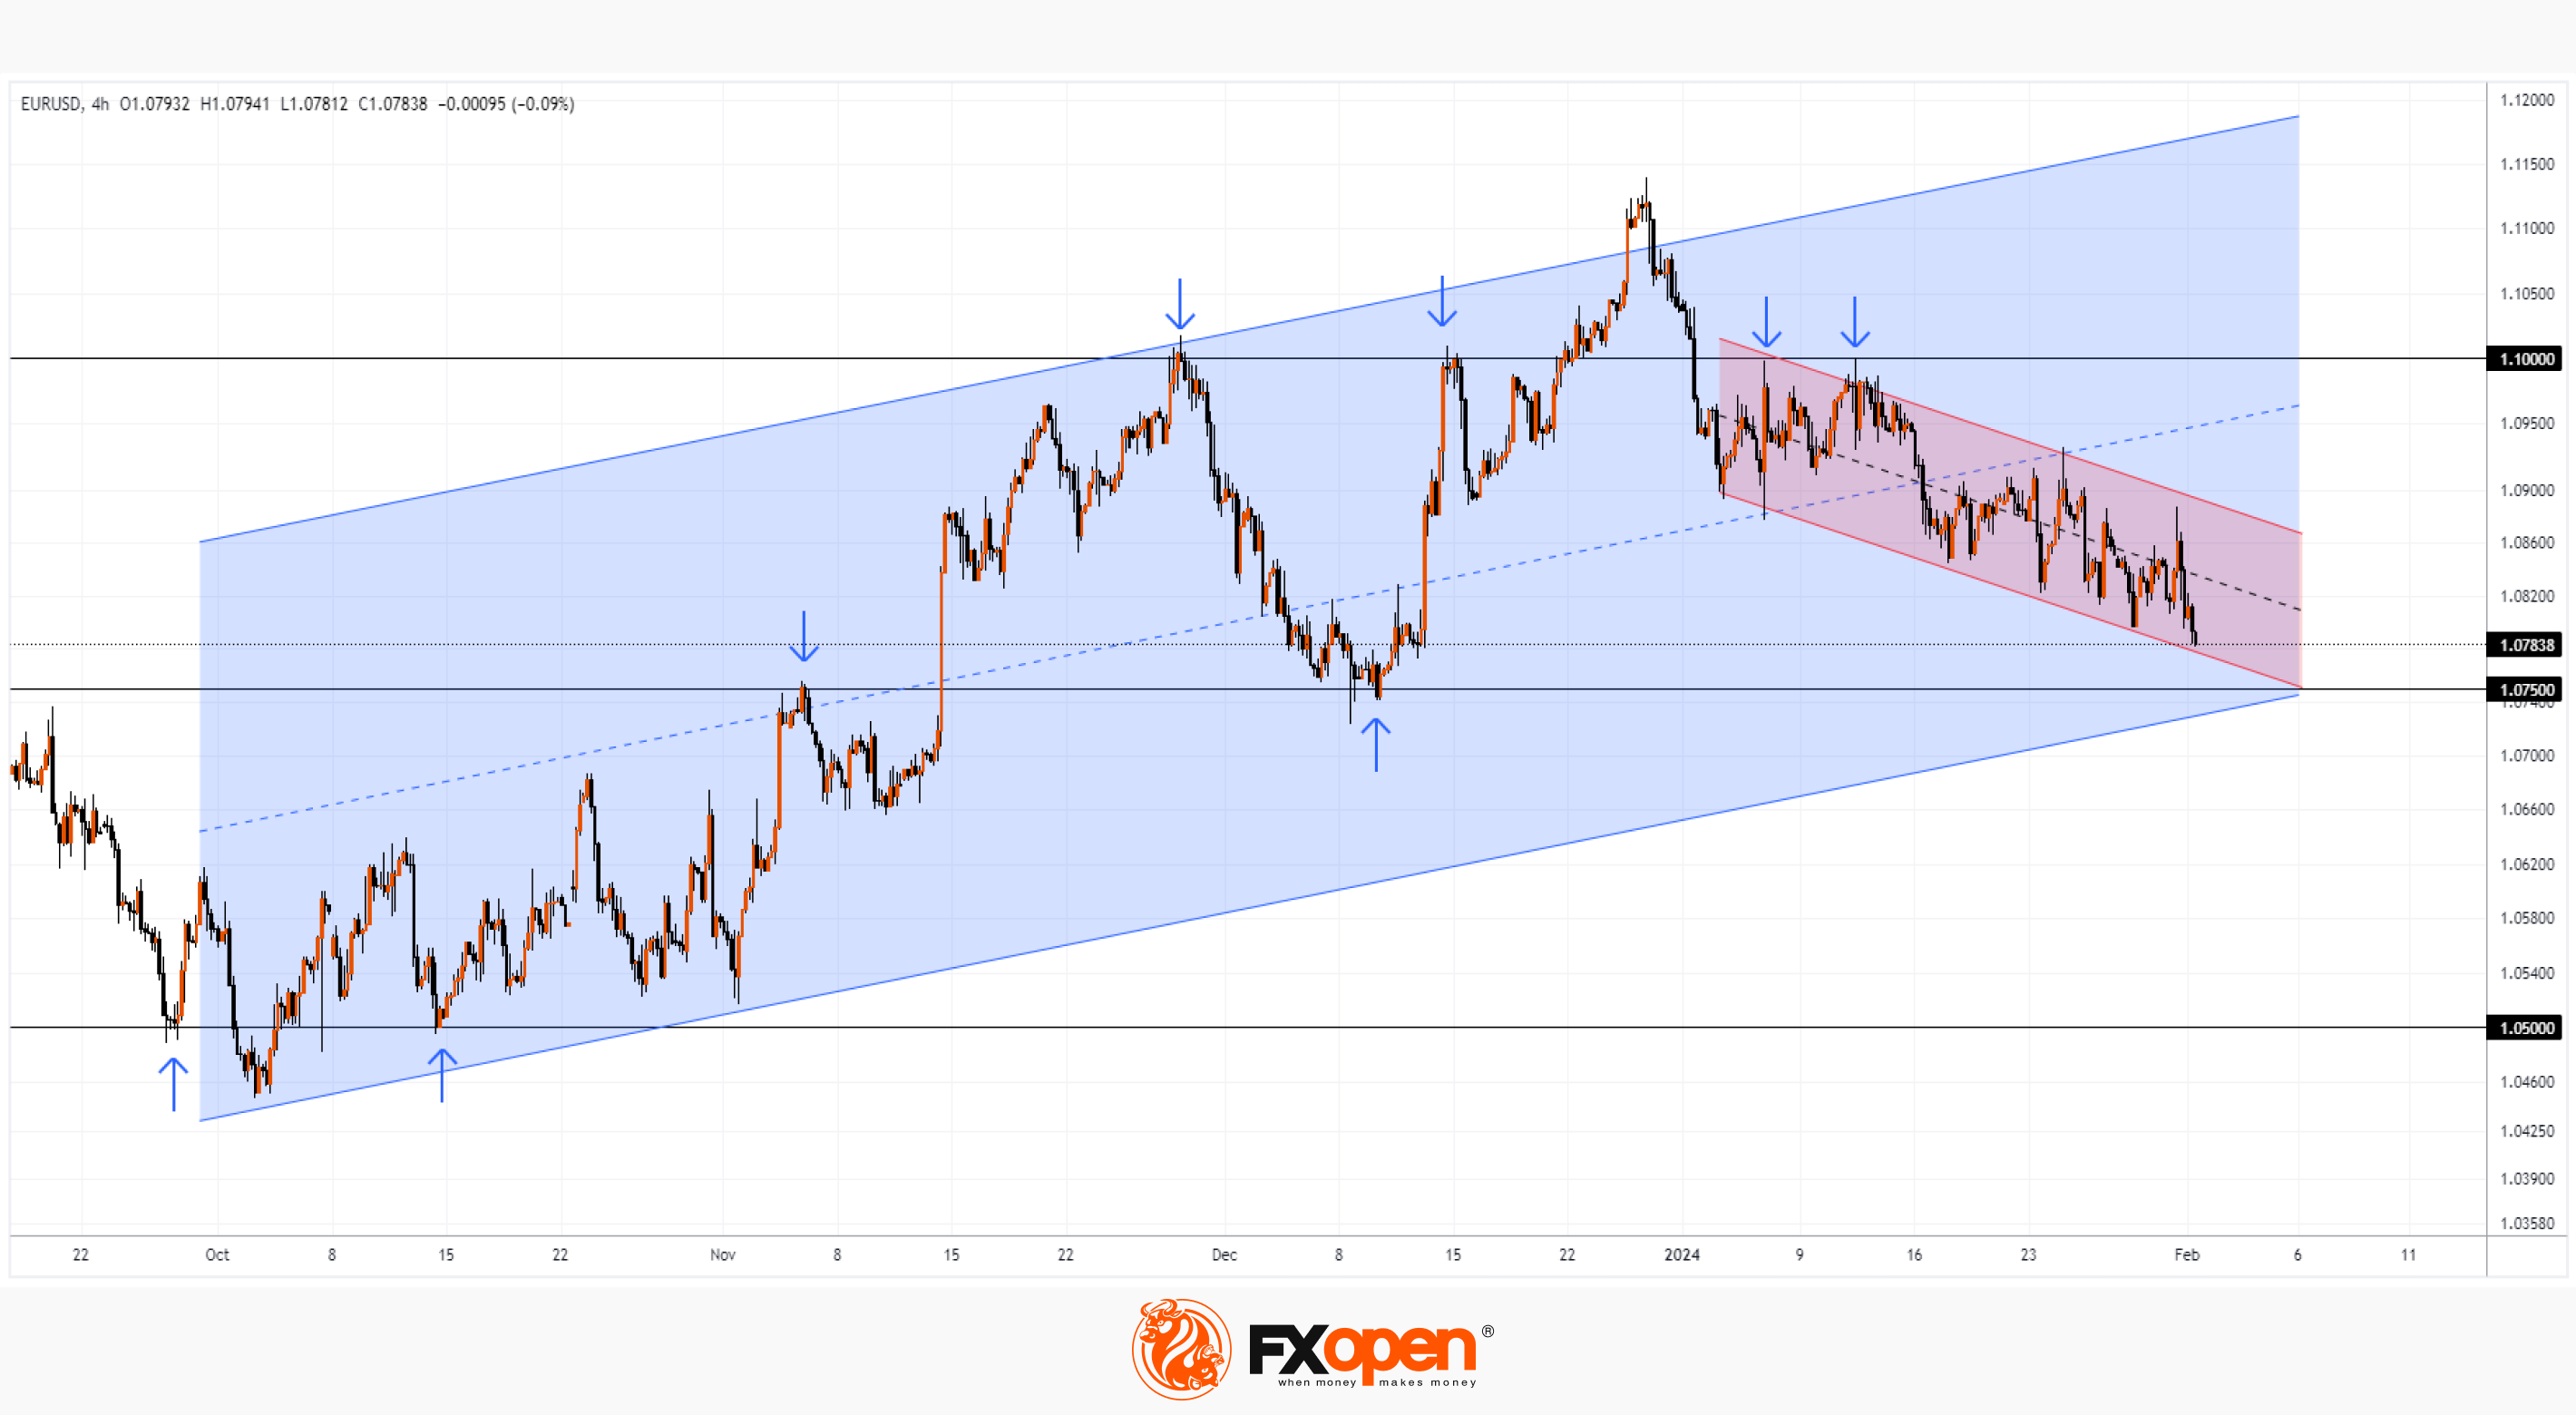
The strengthening of the US dollar caused the EUR/USD rate to drop below 1.079 today for the first time since mid-December last year.
The EUR/USD chart today shows that the price is falling towards the lower border of the ascending channel (shown in blue), and the market is very sensitive to psychological levels:
→ the level of 1.100 (which we paid attention to in the analysis on November 29 and December 15) in January acted as an important resistance twice, preventing the price from rising.
→ Level 1.075, from which reversals were formed, may provide support. Bulls can also pin their hopes on it, since the lower boundary of the ascending channel passes near the level of 1.075.
→ The 1.050 level seems unattainable - but who knows, if the Fed continues to keep rates high “for as long as necessary,” this could lead to a breakdown of the ascending channel, opening the way to support 1.05.
Trade over 50 forex markets 24 hours a day with FXOpen. Take advantage of low commissions, deep liquidity, and spreads from 0.0 pips. Open your FXOpen account now or learn more about trading forex with FXOpen.
CFDs are complex instruments and come with a high risk of losing your money.
This article represents the opinion of the Companies operating under the FXOpen brand only. It is not to be construed as an offer, solicitation, or recommendation with respect to products and services provided by the Companies operating under the FXOpen brand, nor is it to be considered financial advice.
News from the Fed Push Down EUR/USD Price to a Year Low
Financial markets were buoyant last night due to news from the Fed. Interest rates remained unchanged — as expected. However, somewhat unexpected was the harsh rhetoric of Jerome Powell, who said that:
→ interest rate reduction in March is unlikely;
→ the Fed needs to see more data to be confident in the rate change.
This cooled financial market expectations for a rate cut in March, which in turn led to a strengthening of the US dollar relative to other currencies and a decline in stock indices, with risk assets falling especially sharply.
The strengthening of the US dollar caused the EUR/USD rate to drop below 1.079 today for the first time since mid-December last year.
The EUR/USD chart today shows that the price is falling towards the lower border of the ascending channel (shown in blue), and the market is very sensitive to psychological levels:
→ the level of 1.100 (which we paid attention to in the analysis on November 29 and December 15) in January acted as an important resistance twice, preventing the price from rising.
→ Level 1.075, from which reversals were formed, may provide support. Bulls can also pin their hopes on it, since the lower boundary of the ascending channel passes near the level of 1.075.
→ The 1.050 level seems unattainable - but who knows, if the Fed continues to keep rates high “for as long as necessary,” this could lead to a breakdown of the ascending channel, opening the way to support 1.05.
Trade over 50 forex markets 24 hours a day with FXOpen. Take advantage of low commissions, deep liquidity, and spreads from 0.0 pips. Open your FXOpen account now or learn more about trading forex with FXOpen.
CFDs are complex instruments and come with a high risk of losing your money.
This article represents the opinion of the Companies operating under the FXOpen brand only. It is not to be construed as an offer, solicitation, or recommendation with respect to products and services provided by the Companies operating under the FXOpen brand, nor is it to be considered financial advice.
#marketanalysis #MarketNews #gasprices
Natural Gas Prices Recover from 3.5-year Lows
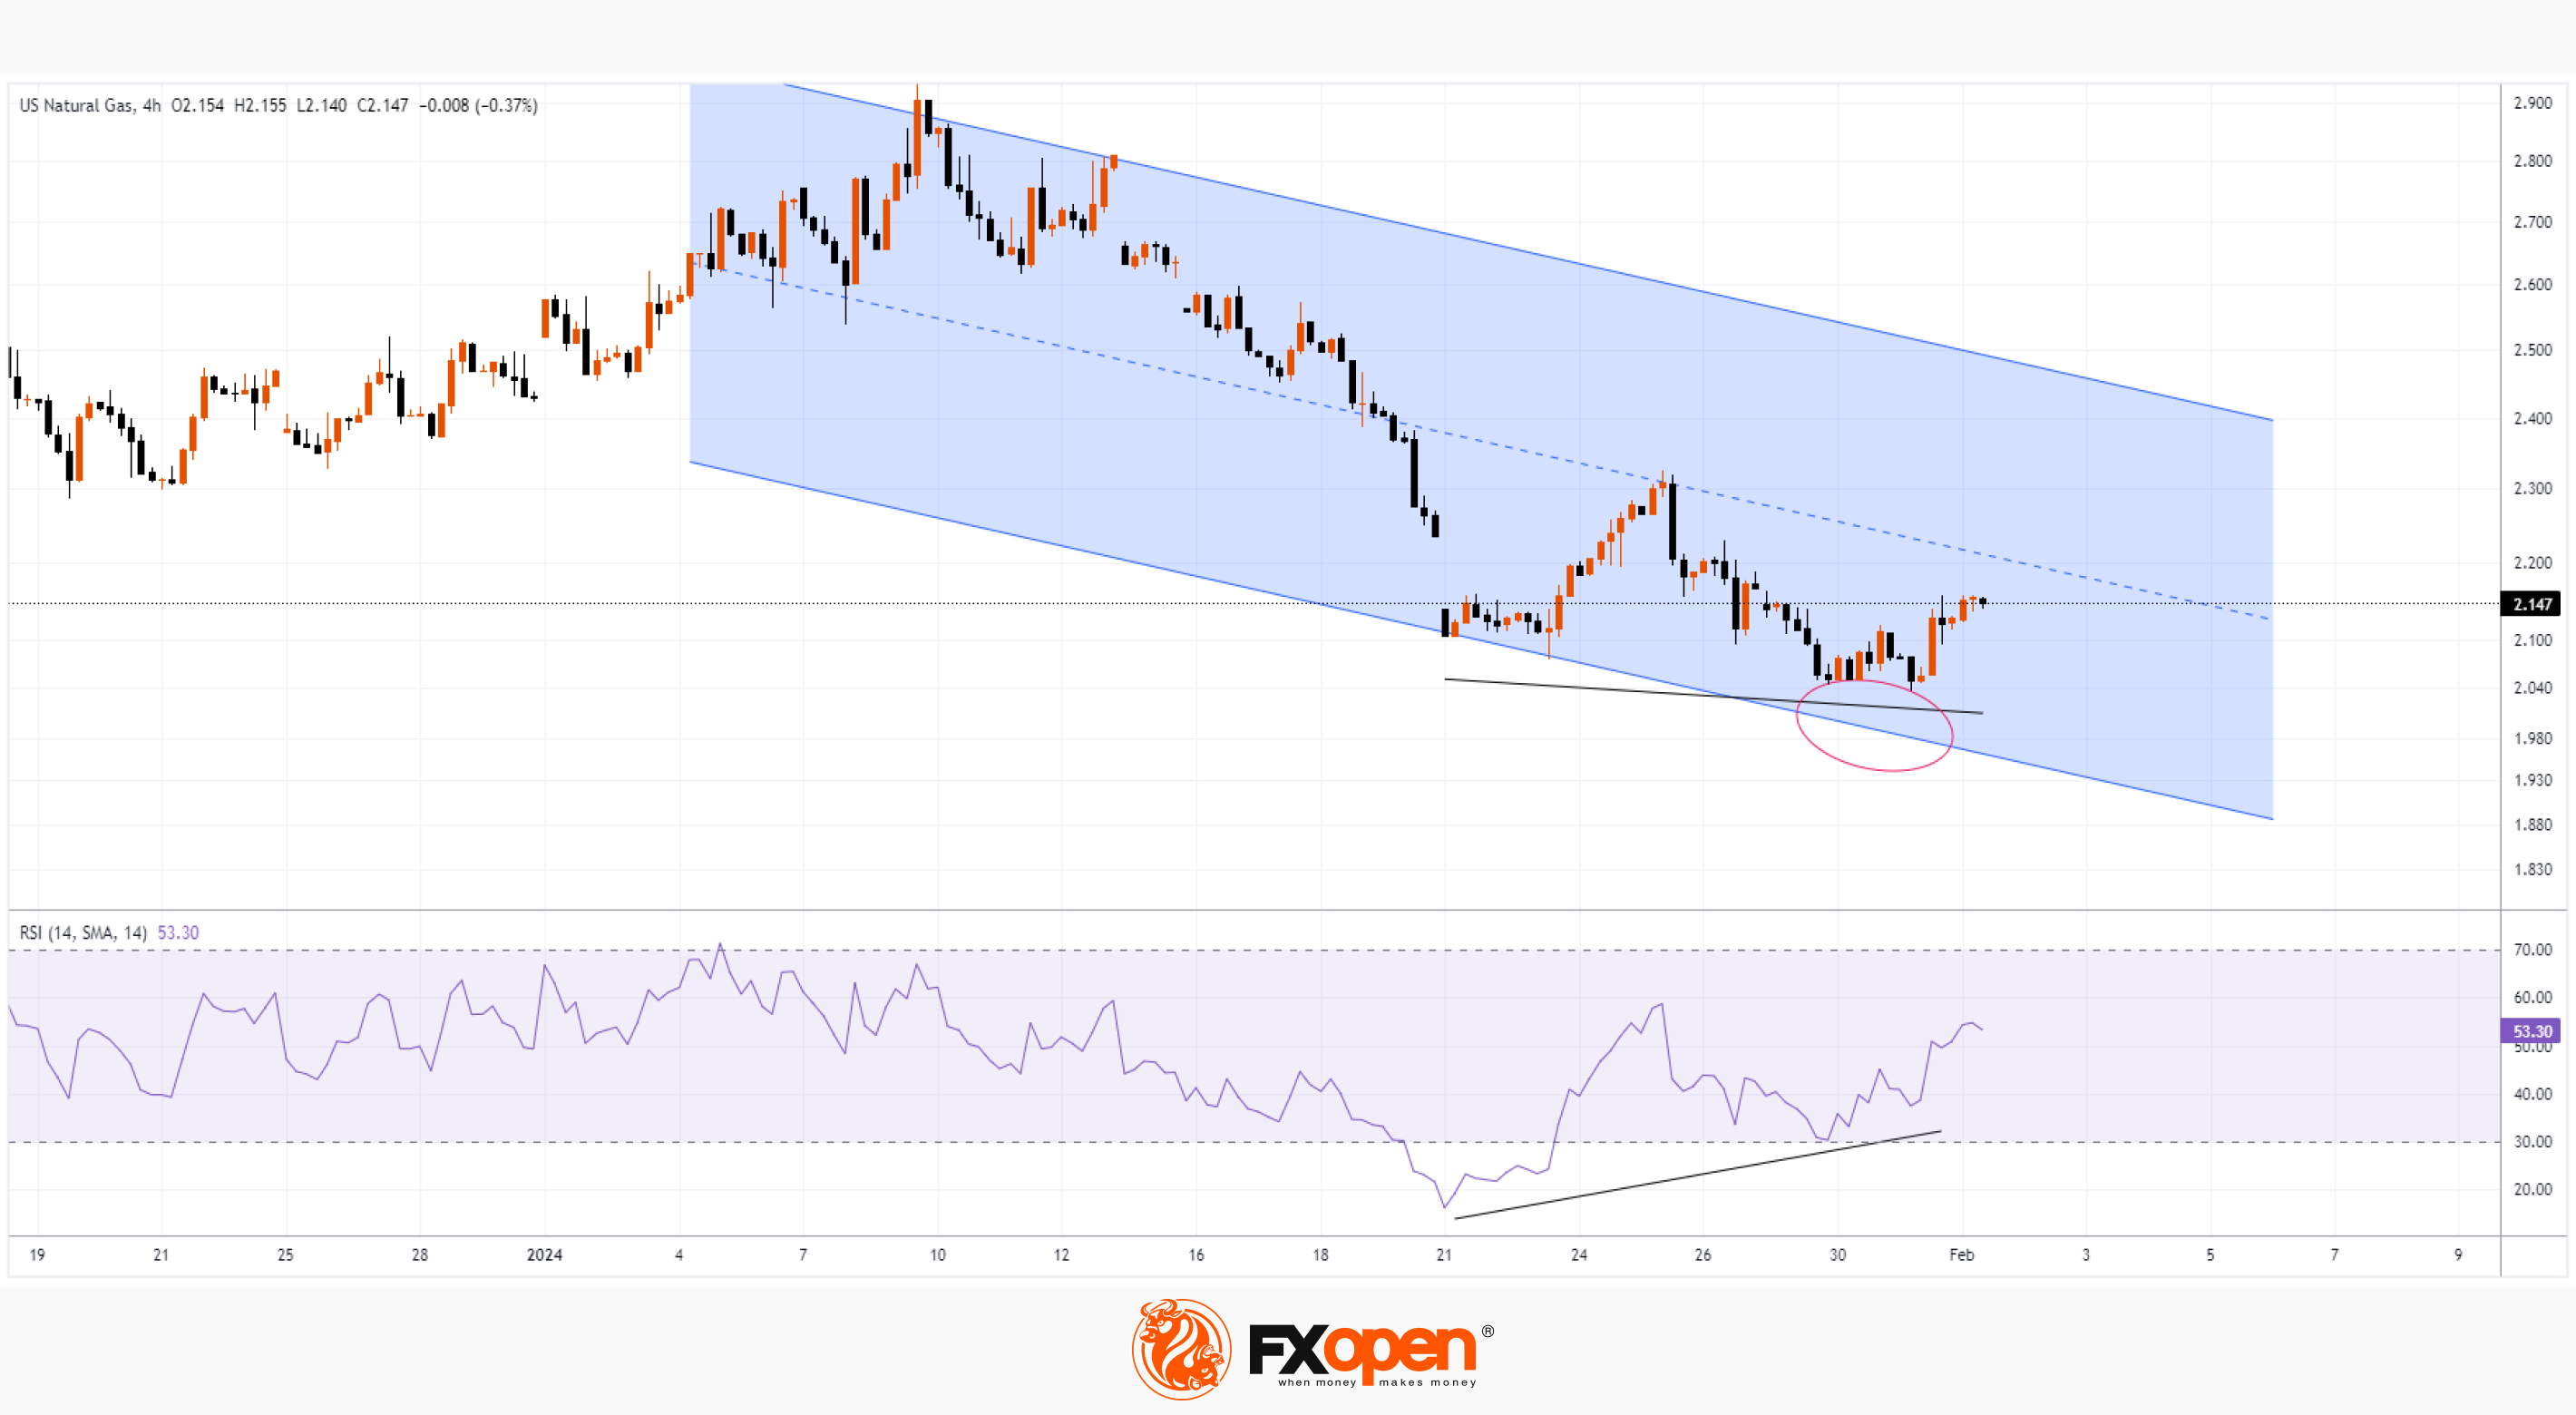
As the chart shows, the price of XNG fell below 2.040 on January 31 for the first time since August 2020. This was facilitated by:
→ seasonal trend, because towards the end of winter the price of natural gas tends to fall;
→ weather data. Temperatures could remain above average and snowfall amounts will decrease across North America, according to the U.S. Climate Prediction Center and AccuWeather.
However, the chart shows signs of increased demand:
→ the RSI indicator forms divergence;
→ the bears were unable to reach the lower boundary (shown on the chart) of the downward channel.
Signs of increased demand could come from short covering after the XNG price fell by more than 25% this year, as well as sentiment ahead of the release of news on gas reserves (today at 18:30 GMT+3).
It is possible that the news release will provoke even greater demand activity, and the XNG price will reach the median line of the shown channel.
Start trading commodity CFDs with tight spreads. Open your trading account now or learn more about trading commodity CFDs with FXOpen.
CFDs are complex instruments and come with a high risk of losing your money.
This article represents the opinion of the Companies operating under the FXOpen brand only. It is not to be construed as an offer, solicitation, or recommendation with respect to products and services provided by the Companies operating under the FXOpen brand, nor is it to be considered financial advice.
Natural Gas Prices Recover from 3.5-year Lows
As the chart shows, the price of XNG fell below 2.040 on January 31 for the first time since August 2020. This was facilitated by:
→ seasonal trend, because towards the end of winter the price of natural gas tends to fall;
→ weather data. Temperatures could remain above average and snowfall amounts will decrease across North America, according to the U.S. Climate Prediction Center and AccuWeather.
However, the chart shows signs of increased demand:
→ the RSI indicator forms divergence;
→ the bears were unable to reach the lower boundary (shown on the chart) of the downward channel.
Signs of increased demand could come from short covering after the XNG price fell by more than 25% this year, as well as sentiment ahead of the release of news on gas reserves (today at 18:30 GMT+3).
It is possible that the news release will provoke even greater demand activity, and the XNG price will reach the median line of the shown channel.
Start trading commodity CFDs with tight spreads. Open your trading account now or learn more about trading commodity CFDs with FXOpen.
CFDs are complex instruments and come with a high risk of losing your money.
This article represents the opinion of the Companies operating under the FXOpen brand only. It is not to be construed as an offer, solicitation, or recommendation with respect to products and services provided by the Companies operating under the FXOpen brand, nor is it to be considered financial advice.
#AAPL #stockmarket #marketanalysis
AAPL Share Price Falls 3% After Report
After the close of yesterday's trading session, the once first-largest company by capitalization, Apple, reported on its activities for the 4th quarter of 2023. The actual numbers exceeded expectations:
→ revenue: actual = USD 119.5 billion (expected = USD 117.9 billion);
→ earnings per share: actual = USD 2.3 (expected = USD 1.99).
It would seem that things were going well, but this was due to the holiday period and the traditional seasonal increase in purchases of Apple products. In the future, analysts can expect a decrease in revenue, as was the case in 2023.
Confirming this possibility, Apple gave weak guidance for the next quarter given the decline in demand in China.
As a result, in post-market trading, AAPL's share price fell approximately 3% to the support level (shown by the black line) drawn near this year's lows.
The AAPL stock chart today shows that:
→ level A looks like an important resistance: the price cannot overcome it in order to move up along with the index;
→ a new threat of a bearish breakdown of the lower blue trend line has emerged - if it happens, the bears may try to test the important low of autumn 2023 (level B).
While the picture looks flat, given that AAPL's share price has been in an A-B range since the middle of last year, the situation could be potentially bearish given that the price cannot rise in a bull market.
Investors' hopes may be associated with the presentation of the Vision Pro headset, as well as with achievements related to the introduction of AI. As Tim Cook said, the company has “a lot of internal work going on,” but Apple is not revealing details yet so as not to “come to the forefront.”
Buy and sell stocks of the world's biggest publicly-listed companies with CFDs on FXOpen’s trading platform. Open your FXOpen account now or learn more about trading share CFDs with FXOpen.
CFDs are complex instruments and come with a high risk of losing your money.
This article represents the opinion of the Companies operating under the FXOpen brand only. It is not to be construed as an offer, solicitation, or recommendation with respect to products and services provided by the Companies operating under the FXOpen brand, nor is it to be considered financial advice.
AAPL Share Price Falls 3% After Report
After the close of yesterday's trading session, the once first-largest company by capitalization, Apple, reported on its activities for the 4th quarter of 2023. The actual numbers exceeded expectations:
→ revenue: actual = USD 119.5 billion (expected = USD 117.9 billion);
→ earnings per share: actual = USD 2.3 (expected = USD 1.99).
It would seem that things were going well, but this was due to the holiday period and the traditional seasonal increase in purchases of Apple products. In the future, analysts can expect a decrease in revenue, as was the case in 2023.
Confirming this possibility, Apple gave weak guidance for the next quarter given the decline in demand in China.
As a result, in post-market trading, AAPL's share price fell approximately 3% to the support level (shown by the black line) drawn near this year's lows.
The AAPL stock chart today shows that:
→ level A looks like an important resistance: the price cannot overcome it in order to move up along with the index;
→ a new threat of a bearish breakdown of the lower blue trend line has emerged - if it happens, the bears may try to test the important low of autumn 2023 (level B).
While the picture looks flat, given that AAPL's share price has been in an A-B range since the middle of last year, the situation could be potentially bearish given that the price cannot rise in a bull market.
Investors' hopes may be associated with the presentation of the Vision Pro headset, as well as with achievements related to the introduction of AI. As Tim Cook said, the company has “a lot of internal work going on,” but Apple is not revealing details yet so as not to “come to the forefront.”
Buy and sell stocks of the world's biggest publicly-listed companies with CFDs on FXOpen’s trading platform. Open your FXOpen account now or learn more about trading share CFDs with FXOpen.
CFDs are complex instruments and come with a high risk of losing your money.
This article represents the opinion of the Companies operating under the FXOpen brand only. It is not to be construed as an offer, solicitation, or recommendation with respect to products and services provided by the Companies operating under the FXOpen brand, nor is it to be considered financial advice.
👍2
#AAPL #stockmarket #NASDAQ #XAUUSD #goldprice
Weekly Market Wrap With Gary Thomson: NASDAQ, EUR/USD, GOLD, OIL, APPLE
Get the latest scoop on the week's hottest headlines, all in one convenient video. Join Gary Thomson, the COO of FXOpen UK, as he breaks down the most significant news reports and shares his expert insights.
🔸 NASDAQ Falls by 1.5% after Tech Giants Reports
🔸 News from the Fed Push Down EUR/USD Price to a Year Low
🔸 Gold Price and Crude Oil Price Eye Additional Gains
🔸 Apple Stock Rises Strongly As December Earnings Looms
Stay in the know and empower yourself with our short, yet power-packed video. Watch it now and stay updated with FXOpen. Don't miss out on this invaluable opportunity to sharpen your trading skills and make informed decisions.
https://cutt.ly/OwXakHkp
To take advantage of price fluctuations in the foreign exchange markets, consider enlisting the services of a reliable broker like FXOpen.
⚠️
This forecast represents FXOpen Companies opinion only, it should not be construed as an offer, invitation or recommendation in respect to FXOpen Companies products and services or as financial advice
Weekly Market Wrap With Gary Thomson: NASDAQ, EUR/USD, GOLD, OIL, APPLE
Get the latest scoop on the week's hottest headlines, all in one convenient video. Join Gary Thomson, the COO of FXOpen UK, as he breaks down the most significant news reports and shares his expert insights.
🔸 NASDAQ Falls by 1.5% after Tech Giants Reports
🔸 News from the Fed Push Down EUR/USD Price to a Year Low
🔸 Gold Price and Crude Oil Price Eye Additional Gains
🔸 Apple Stock Rises Strongly As December Earnings Looms
Stay in the know and empower yourself with our short, yet power-packed video. Watch it now and stay updated with FXOpen. Don't miss out on this invaluable opportunity to sharpen your trading skills and make informed decisions.
https://cutt.ly/OwXakHkp
To take advantage of price fluctuations in the foreign exchange markets, consider enlisting the services of a reliable broker like FXOpen.
⚠️
This forecast represents FXOpen Companies opinion only, it should not be construed as an offer, invitation or recommendation in respect to FXOpen Companies products and services or as financial advice
YouTube
Weekly Market Wrap With Gary Thomson: NASDAQ, EUR/USD, GOLD, OIL, APPLE
Get the latest scoop on the week's hottest headlines, all in one convenient video. Join Gary Thomson, the COO of FXOpen UK, as he breaks down the most significant news reports and shares his expert insights.
00:34 - NASDAQ Falls by 1.5% after Tech Giants…
00:34 - NASDAQ Falls by 1.5% after Tech Giants…
👍2
#stockmarket #AMZN #MarketNews
AMZN Share Price Rises Nearly 8% after Report
After Thursday's close, another corporate giant reported fourth-quarter 2023 activity.
Amazon's actual numbers exceeded analysts' expectations. And while actual revenue (= USD 169.96 billion) was close to forecasts (expected = USD 169.92 billion), the reported earnings per share were a surprise (actual = USD 1.00, expected = USD 0.795).
Bloomberg names the reasons for success during the reporting period:
→ cost-cutting policy, which is persistently pursued by CEO Andy Jassy;
→ focus on services that bring in money. For example, advertising revenues have grown for the 4th consecutive period;
→ sales of cloud services grew by 13%, easing concerns about slowing demand;
→ strong sales growth during the holiday season.
The company also issued optimistic guidance for the coming quarter, with the expectation that corporate customers will increase spending in its cloud computing division.
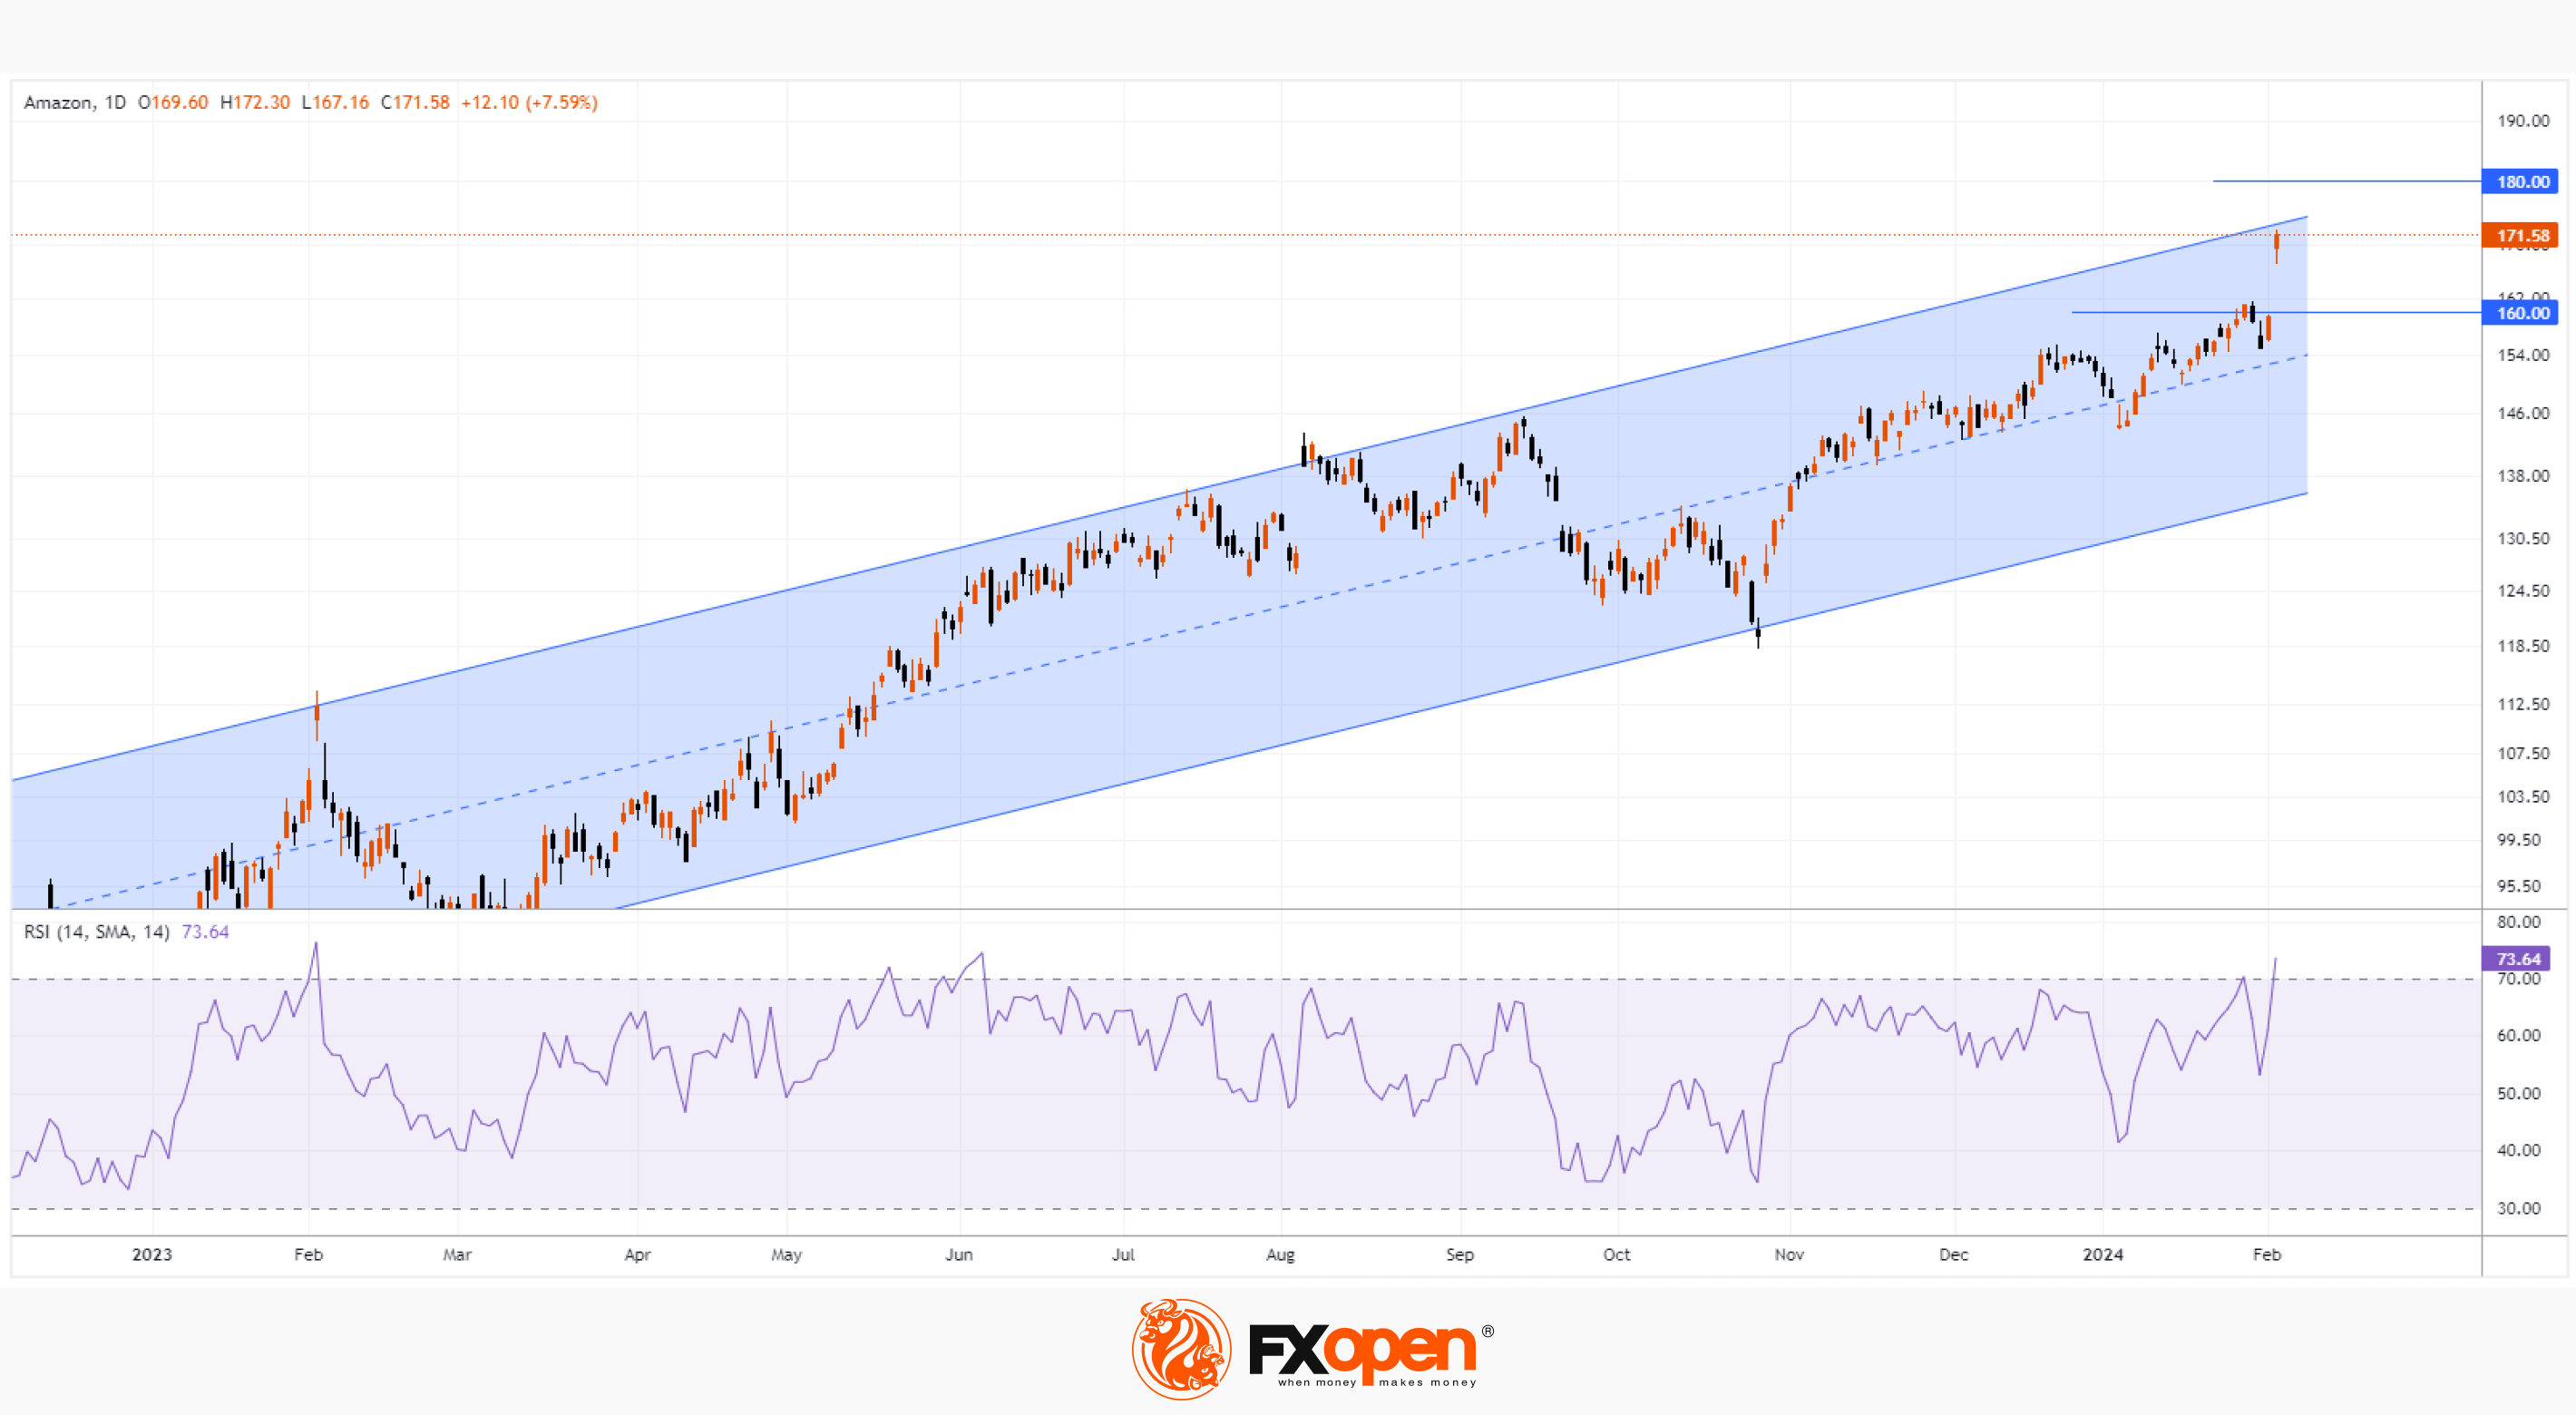
As a result, AMZN's share price closed at USD 171.58 on Friday, up nearly 8% from Thursday's close.
The daily chart for AMZN stock today shows that:
→ the price moves within the ascending channel (shown in blue);
→ the price came close to its upper limit;
→ the RSI indicator indicates that the market is significantly overbought;
→ the price formed a bullish gap above the level of USD 160 per share.
Taking into account the above, it is possible to assume that the AMZN share price is in a vulnerable position for a rollback from the upper boundary of the ascending channel, when the optimistic impressions from the publication of the report subside — in this case, the formation of divergence on the RSI indicator and a decline into the bullish gap area is possible.
Also note that AMZN is approaching USD 180 per share. This is the level at which Jeff Bezos sold his shares aggressively in 2021, followed by a market downturn. At the same time, according to annual corporate reporting, Bezos intends to sell about 50 million shares this year. So the $180 level could be an important resistance for 2024.
To take advantage of price fluctuations in the foreign exchange markets, consider enlisting the services of a reliable broker like FXOpen.
Buy and sell stocks of the world's biggest publicly-listed companies with CFDs on FXOpen’s trading platform. Open your FXOpen account now or learn more about trading share CFDs with FXOpen.
CFDs are complex instruments and come with a high risk of losing your money.
This article represents the opinion of the Companies operating under the FXOpen brand only. It is not to be construed as an offer, solicitation, or recommendation with respect to products and services provided by the Companies operating under the FXOpen brand, nor is it to be considered financial advice.
AMZN Share Price Rises Nearly 8% after Report
After Thursday's close, another corporate giant reported fourth-quarter 2023 activity.
Amazon's actual numbers exceeded analysts' expectations. And while actual revenue (= USD 169.96 billion) was close to forecasts (expected = USD 169.92 billion), the reported earnings per share were a surprise (actual = USD 1.00, expected = USD 0.795).
Bloomberg names the reasons for success during the reporting period:
→ cost-cutting policy, which is persistently pursued by CEO Andy Jassy;
→ focus on services that bring in money. For example, advertising revenues have grown for the 4th consecutive period;
→ sales of cloud services grew by 13%, easing concerns about slowing demand;
→ strong sales growth during the holiday season.
The company also issued optimistic guidance for the coming quarter, with the expectation that corporate customers will increase spending in its cloud computing division.
As a result, AMZN's share price closed at USD 171.58 on Friday, up nearly 8% from Thursday's close.
The daily chart for AMZN stock today shows that:
→ the price moves within the ascending channel (shown in blue);
→ the price came close to its upper limit;
→ the RSI indicator indicates that the market is significantly overbought;
→ the price formed a bullish gap above the level of USD 160 per share.
Taking into account the above, it is possible to assume that the AMZN share price is in a vulnerable position for a rollback from the upper boundary of the ascending channel, when the optimistic impressions from the publication of the report subside — in this case, the formation of divergence on the RSI indicator and a decline into the bullish gap area is possible.
Also note that AMZN is approaching USD 180 per share. This is the level at which Jeff Bezos sold his shares aggressively in 2021, followed by a market downturn. At the same time, according to annual corporate reporting, Bezos intends to sell about 50 million shares this year. So the $180 level could be an important resistance for 2024.
To take advantage of price fluctuations in the foreign exchange markets, consider enlisting the services of a reliable broker like FXOpen.
Buy and sell stocks of the world's biggest publicly-listed companies with CFDs on FXOpen’s trading platform. Open your FXOpen account now or learn more about trading share CFDs with FXOpen.
CFDs are complex instruments and come with a high risk of losing your money.
This article represents the opinion of the Companies operating under the FXOpen brand only. It is not to be construed as an offer, solicitation, or recommendation with respect to products and services provided by the Companies operating under the FXOpen brand, nor is it to be considered financial advice.
👍2
#marketanalysis #MarketNews #tradingforex
AUD/USD Rate Rises after RBA Decision
This morning the Central Bank of Australia decided to keep the interest rate at the same level = 4.35%, as expected.
However, RBA management said that further rate hikes cannot be ruled out as inflation is still too high. This is a clear signal that policy easing is unlikely in the near future.
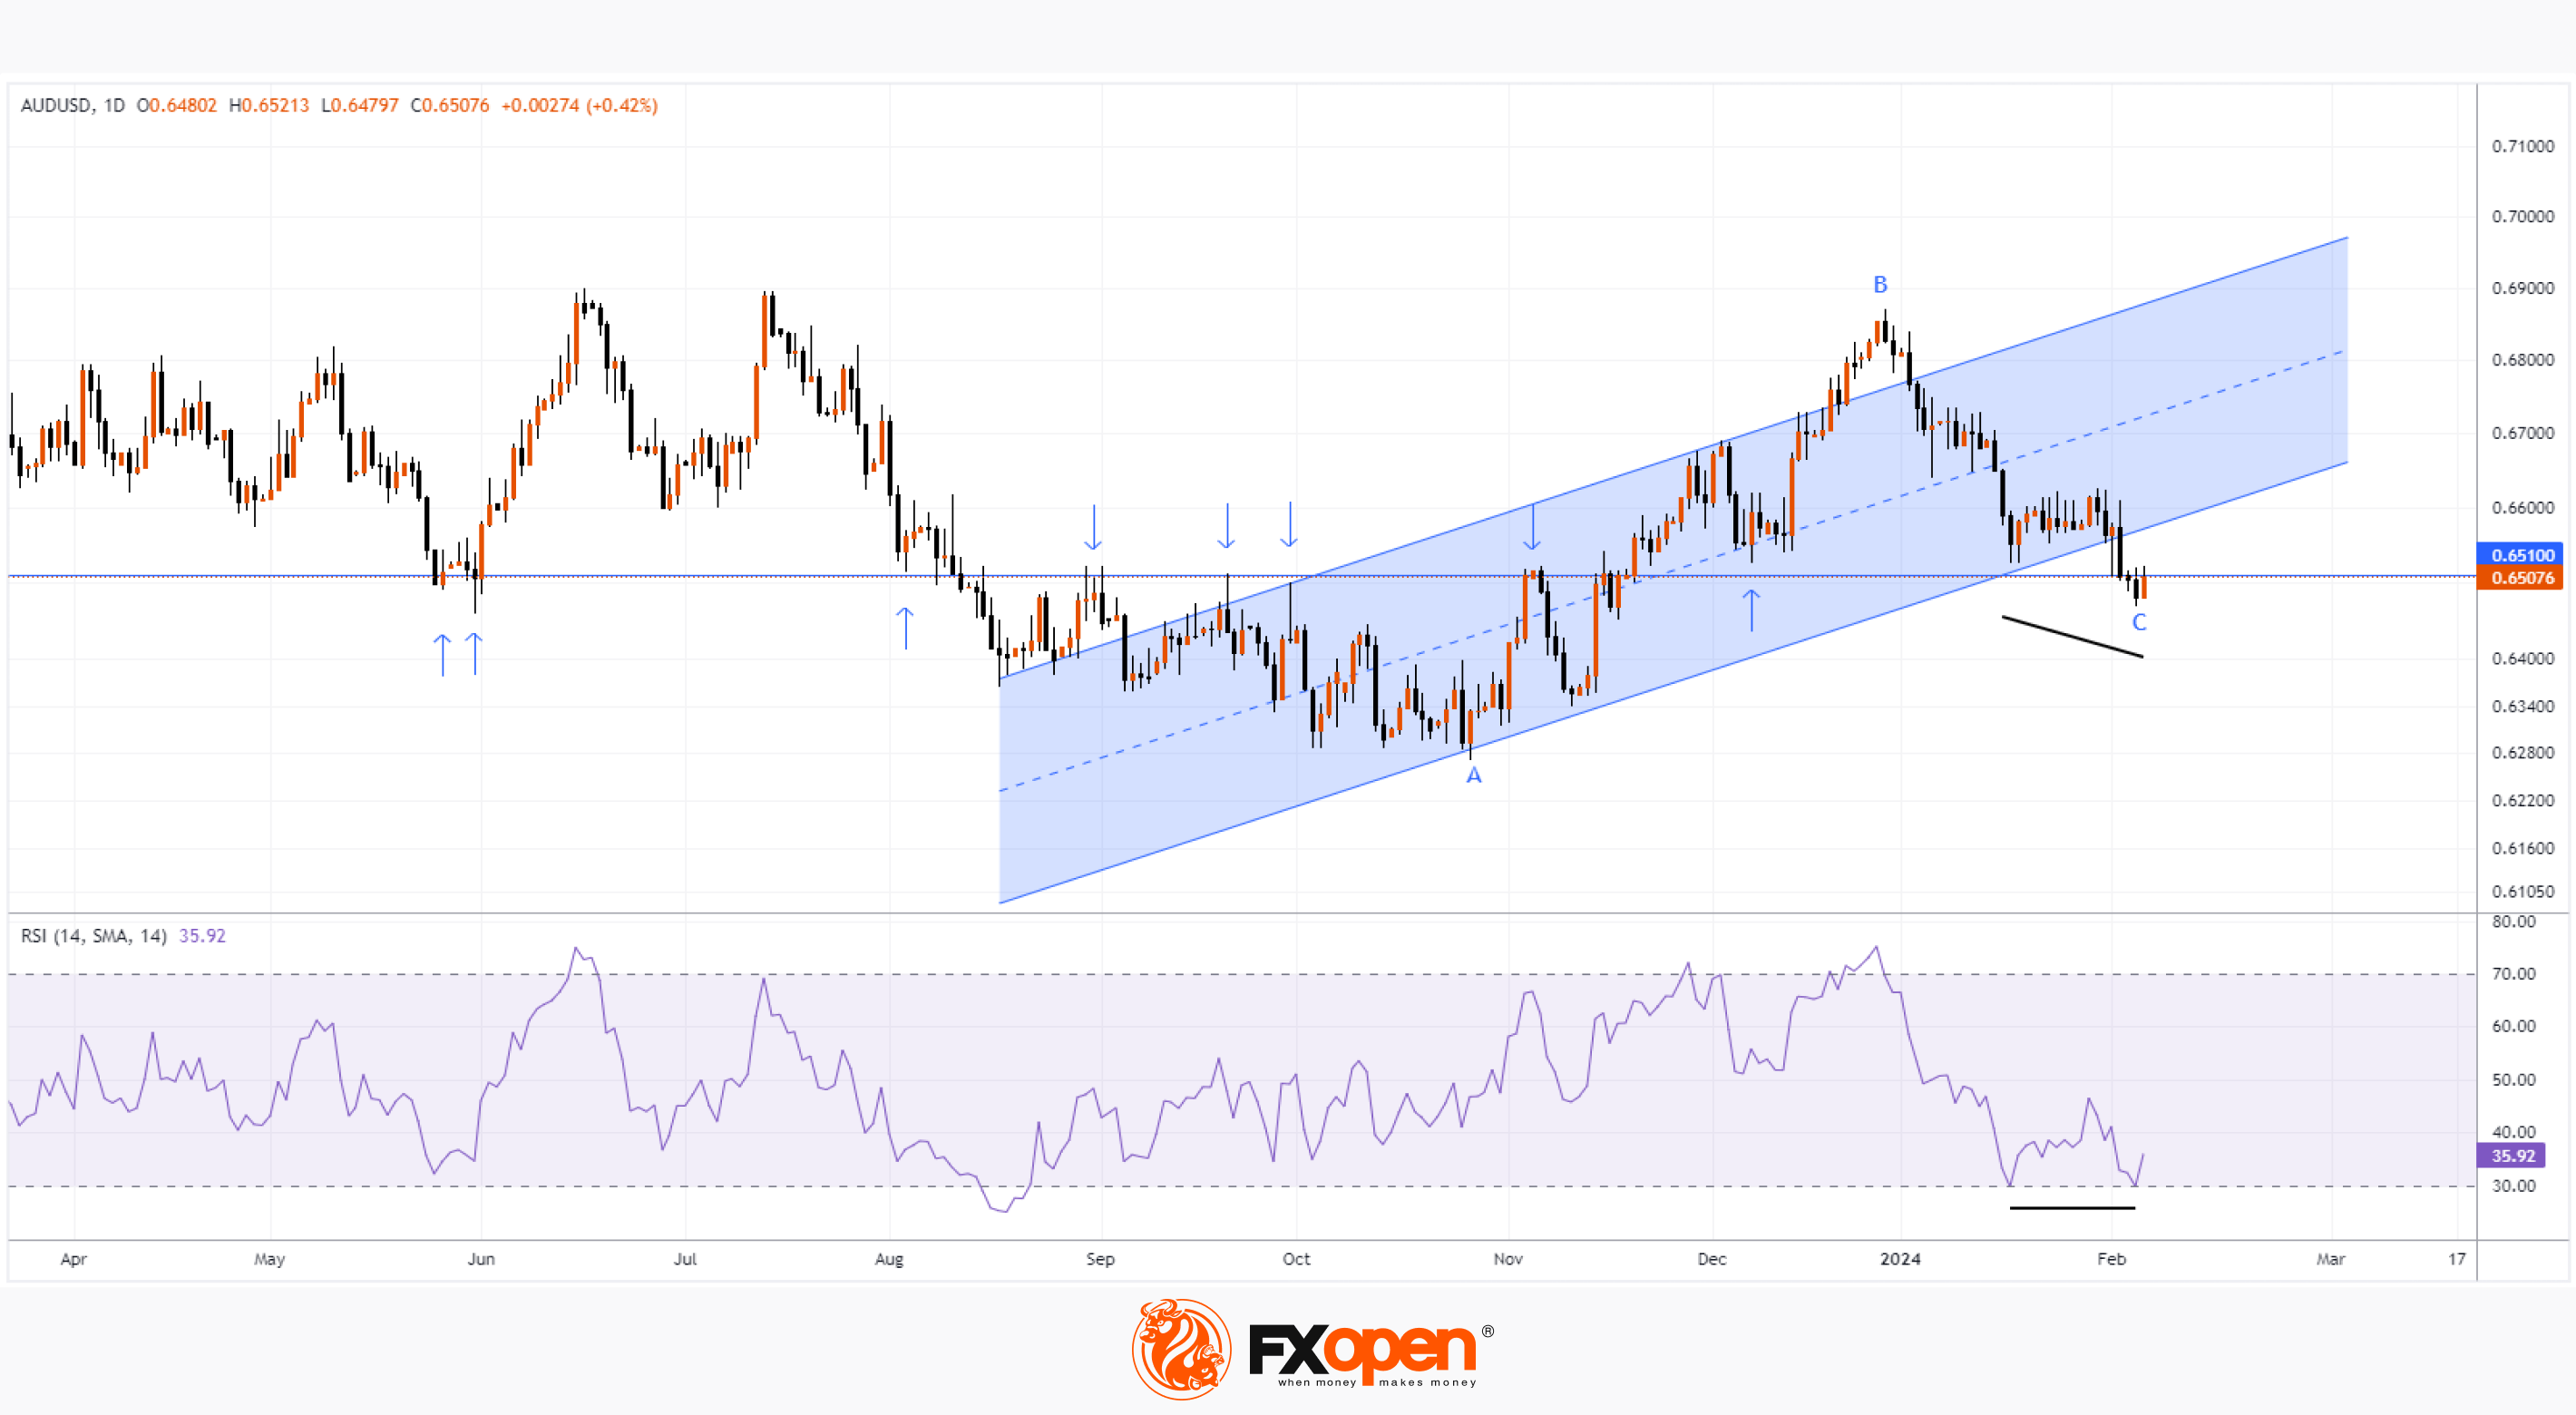
AUD/USD has rallied from its 2024 low following this relatively hawkish rhetoric.
The daily AUD/USD chart today shows that if the bullish momentum does not fade, then based on the results of today's trading the following may form:
→ bullish engulfing candlestick pattern;
→ bullish divergence.
At the same time, the price is near the important level of 0.6510, which since mid-2023 has repeatedly shown its influence on the AUD/USD price both as support and resistance (shown by arrows).
The ability of the AUD/USD price to consolidate above this key level will indicate the strength of demand, with:
→ a false bearish breakdown of the level of 0.651 may form on the chart;
→ it is possible that the bulls will try to build on their success and return the AUD/USD price to the area of the ascending channel (shown in blue), which dates back to last fall.
From the point of view of technical analysis of AUD/USD, the likelihood of a bullish scenario is increased by the fact that point C (the current low of the year) is located in the area of the 0.382 Fibonacci level of the impulse movement A→B.
Trade over 50 forex markets 24 hours a day with FXOpen. Take advantage of low commissions, deep liquidity, and spreads from 0.0 pips. Open your FXOpen account now or learn more about trading forex with FXOpen.
CFDs are complex instruments and come with a high risk of losing your money.
This article represents the opinion of the Companies operating under the FXOpen brand only. It is not to be construed as an offer, solicitation, or recommendation with respect to products and services provided by the Companies operating under the FXOpen brand, nor is it to be considered financial advice.
AUD/USD Rate Rises after RBA Decision
This morning the Central Bank of Australia decided to keep the interest rate at the same level = 4.35%, as expected.
However, RBA management said that further rate hikes cannot be ruled out as inflation is still too high. This is a clear signal that policy easing is unlikely in the near future.
AUD/USD has rallied from its 2024 low following this relatively hawkish rhetoric.
The daily AUD/USD chart today shows that if the bullish momentum does not fade, then based on the results of today's trading the following may form:
→ bullish engulfing candlestick pattern;
→ bullish divergence.
At the same time, the price is near the important level of 0.6510, which since mid-2023 has repeatedly shown its influence on the AUD/USD price both as support and resistance (shown by arrows).
The ability of the AUD/USD price to consolidate above this key level will indicate the strength of demand, with:
→ a false bearish breakdown of the level of 0.651 may form on the chart;
→ it is possible that the bulls will try to build on their success and return the AUD/USD price to the area of the ascending channel (shown in blue), which dates back to last fall.
From the point of view of technical analysis of AUD/USD, the likelihood of a bullish scenario is increased by the fact that point C (the current low of the year) is located in the area of the 0.382 Fibonacci level of the impulse movement A→B.
Trade over 50 forex markets 24 hours a day with FXOpen. Take advantage of low commissions, deep liquidity, and spreads from 0.0 pips. Open your FXOpen account now or learn more about trading forex with FXOpen.
CFDs are complex instruments and come with a high risk of losing your money.
This article represents the opinion of the Companies operating under the FXOpen brand only. It is not to be construed as an offer, solicitation, or recommendation with respect to products and services provided by the Companies operating under the FXOpen brand, nor is it to be considered financial advice.
👍3
#marketanalysis #MarketNews
A Major Network Outage in Solana Had Little Impact on the SOL/USD Exchange Rate
Solana, one of the fastest-growing blockchain networks, experienced significant outages yesterday, starting around 13:00 GMT+3. As a result of the outage, users and developers were unable to process transactions and interact with applications.
Solana engineers quickly released a patch required for the restart. And about four hours later, the network came back online, as validators, collectively controlling 80% of SOL staking, updated to the new version.
This is not the first time the Solana network has experienced downtime. Crypto media have reported at least 11 outages in the past two years, including minor incidents.
According to SolanaCompass.com, the main Solana network has been in "beta mode" (error detection mode) since March 2020 and is still operating as such. Approximately 1.7 billion dollars' worth of capital is locked in the project's network, and SOL, its native token, ranks as the fifth-largest cryptocurrency with a market capitalization of nearly 42 billion dollars.
In 2023, the SOL/USD rate rose by a staggering +960%, and fortunately for investors, yesterday's outage had little impact on the price of the Solana token (and other crypto assets).
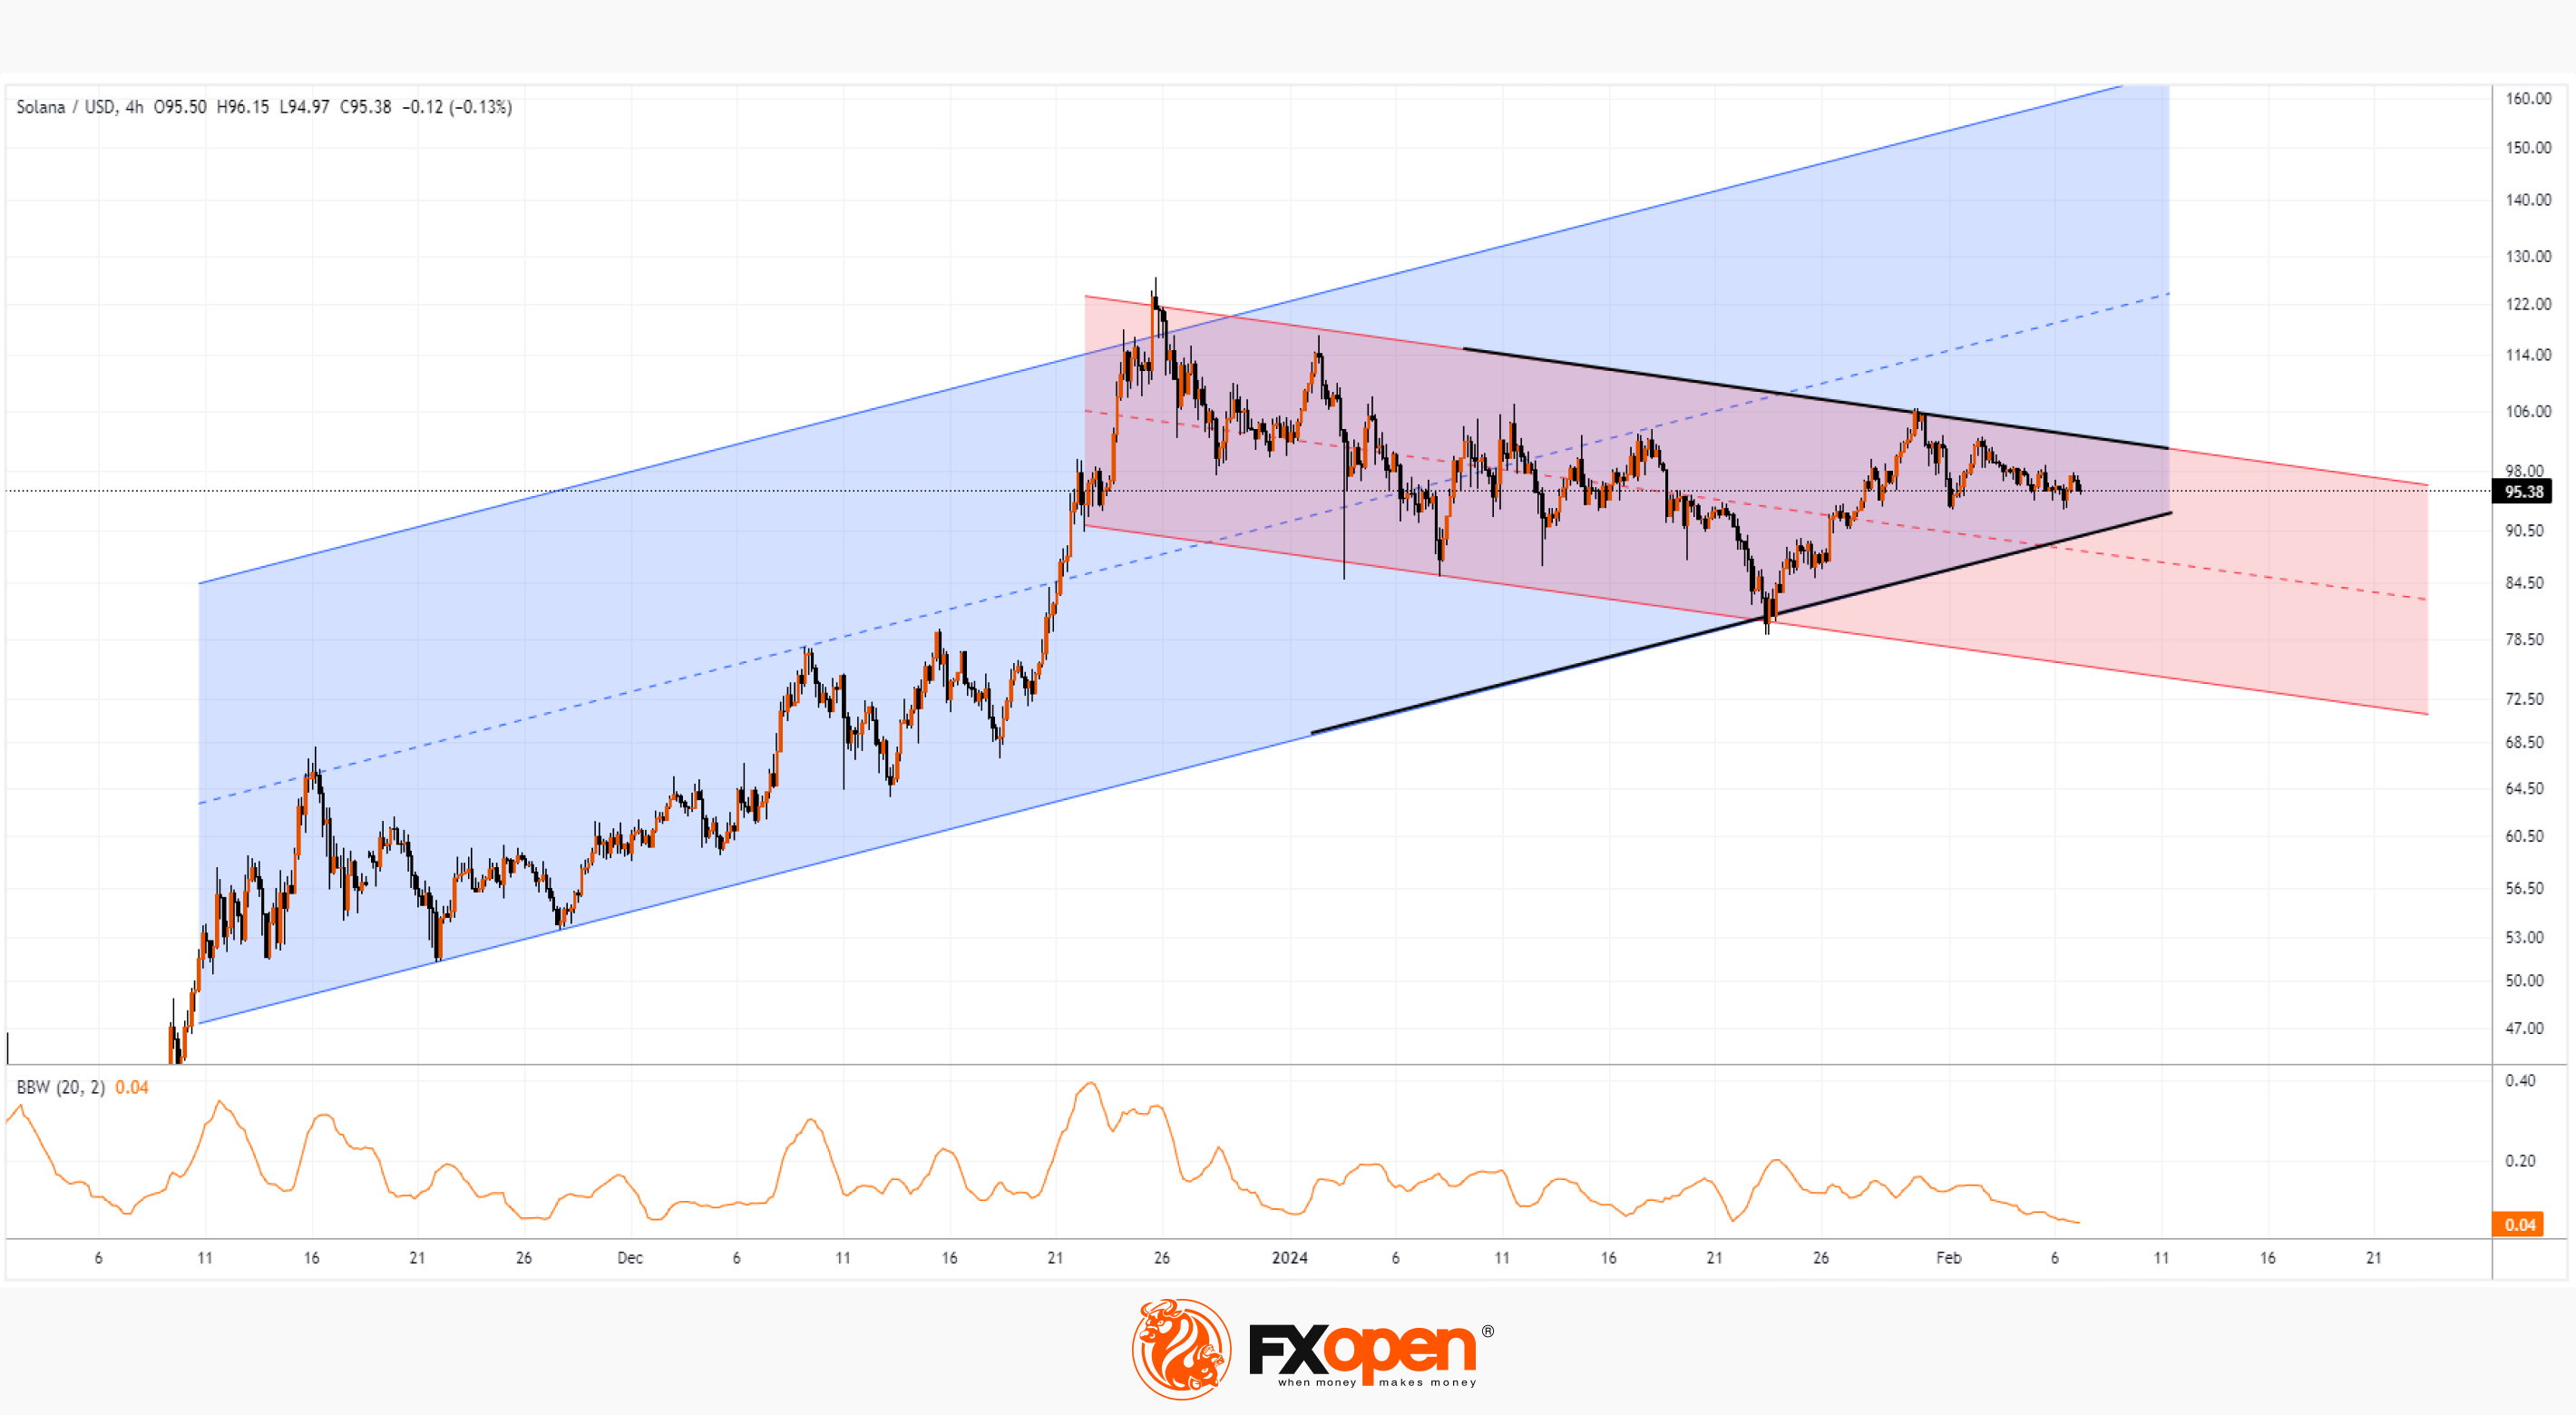
Meanwhile, today's SOL/USD chart shows an interesting picture – the price seems to have temporarily stalled before choosing a direction in which to move:
→ On the one hand, the SOL/USD price is within the bounds of an ascending uptrend (shown in blue), which began in 2023;
→ On the other hand, the chart outlines a descending channel (shown in red).
Meanwhile, the Bollinger Bands width indicator is at minimal values, as if hinting that the SOL/USD price exiting the triangle forming on the chart (shown in black lines) may be associated with increased volatility and the formation of a new important swing.
FXOpen offers the world's most popular cryptocurrency CFDs*, including Bitcoin and Ethereum. Floating spreads, 1:2 leverage — at your service. Open your trading account now or learn more about crypto CFD trading with FXOpen.
CFDs are complex instruments and come with a high risk of losing your money.
This article represents the opinion of the Companies operating under the FXOpen brand only. It is not to be construed as an offer, solicitation, or recommendation with respect to products and services provided by the Companies operating under the FXOpen brand, nor is it to be considered financial advice.
*At FXOpen UK and FXOpen AU, Cryptocurrency CFDs are only available for trading by those clients categorised as Professional clients under FCA Rules and Professional clients under ASIC Rules respectively. They are not available for trading by Retail clients.
A Major Network Outage in Solana Had Little Impact on the SOL/USD Exchange Rate
Solana, one of the fastest-growing blockchain networks, experienced significant outages yesterday, starting around 13:00 GMT+3. As a result of the outage, users and developers were unable to process transactions and interact with applications.
Solana engineers quickly released a patch required for the restart. And about four hours later, the network came back online, as validators, collectively controlling 80% of SOL staking, updated to the new version.
This is not the first time the Solana network has experienced downtime. Crypto media have reported at least 11 outages in the past two years, including minor incidents.
According to SolanaCompass.com, the main Solana network has been in "beta mode" (error detection mode) since March 2020 and is still operating as such. Approximately 1.7 billion dollars' worth of capital is locked in the project's network, and SOL, its native token, ranks as the fifth-largest cryptocurrency with a market capitalization of nearly 42 billion dollars.
In 2023, the SOL/USD rate rose by a staggering +960%, and fortunately for investors, yesterday's outage had little impact on the price of the Solana token (and other crypto assets).
Meanwhile, today's SOL/USD chart shows an interesting picture – the price seems to have temporarily stalled before choosing a direction in which to move:
→ On the one hand, the SOL/USD price is within the bounds of an ascending uptrend (shown in blue), which began in 2023;
→ On the other hand, the chart outlines a descending channel (shown in red).
Meanwhile, the Bollinger Bands width indicator is at minimal values, as if hinting that the SOL/USD price exiting the triangle forming on the chart (shown in black lines) may be associated with increased volatility and the formation of a new important swing.
FXOpen offers the world's most popular cryptocurrency CFDs*, including Bitcoin and Ethereum. Floating spreads, 1:2 leverage — at your service. Open your trading account now or learn more about crypto CFD trading with FXOpen.
CFDs are complex instruments and come with a high risk of losing your money.
This article represents the opinion of the Companies operating under the FXOpen brand only. It is not to be construed as an offer, solicitation, or recommendation with respect to products and services provided by the Companies operating under the FXOpen brand, nor is it to be considered financial advice.
*At FXOpen UK and FXOpen AU, Cryptocurrency CFDs are only available for trading by those clients categorised as Professional clients under FCA Rules and Professional clients under ASIC Rules respectively. They are not available for trading by Retail clients.
👍3
#MarketNews #tradingforex #marketanalysis
NZD/USD Rate Recovering from Its Low of the Year amid News from Labour Market
Yesterday's news showed that New Zealand's labour market is stronger and more resilient than expected.
In the fourth quarter of 2023, employment grew by 0.4% in the fourth quarter (forecast = +0.3%, quarter earlier = -0.1%). The unemployment rate is 4%, forecast = 4.3%.
A strong labour market indicates a margin of safety in the economy. And that may suggest that the Reserve Bank of New Zealand's tight monetary policy to quell inflation may continue longer.
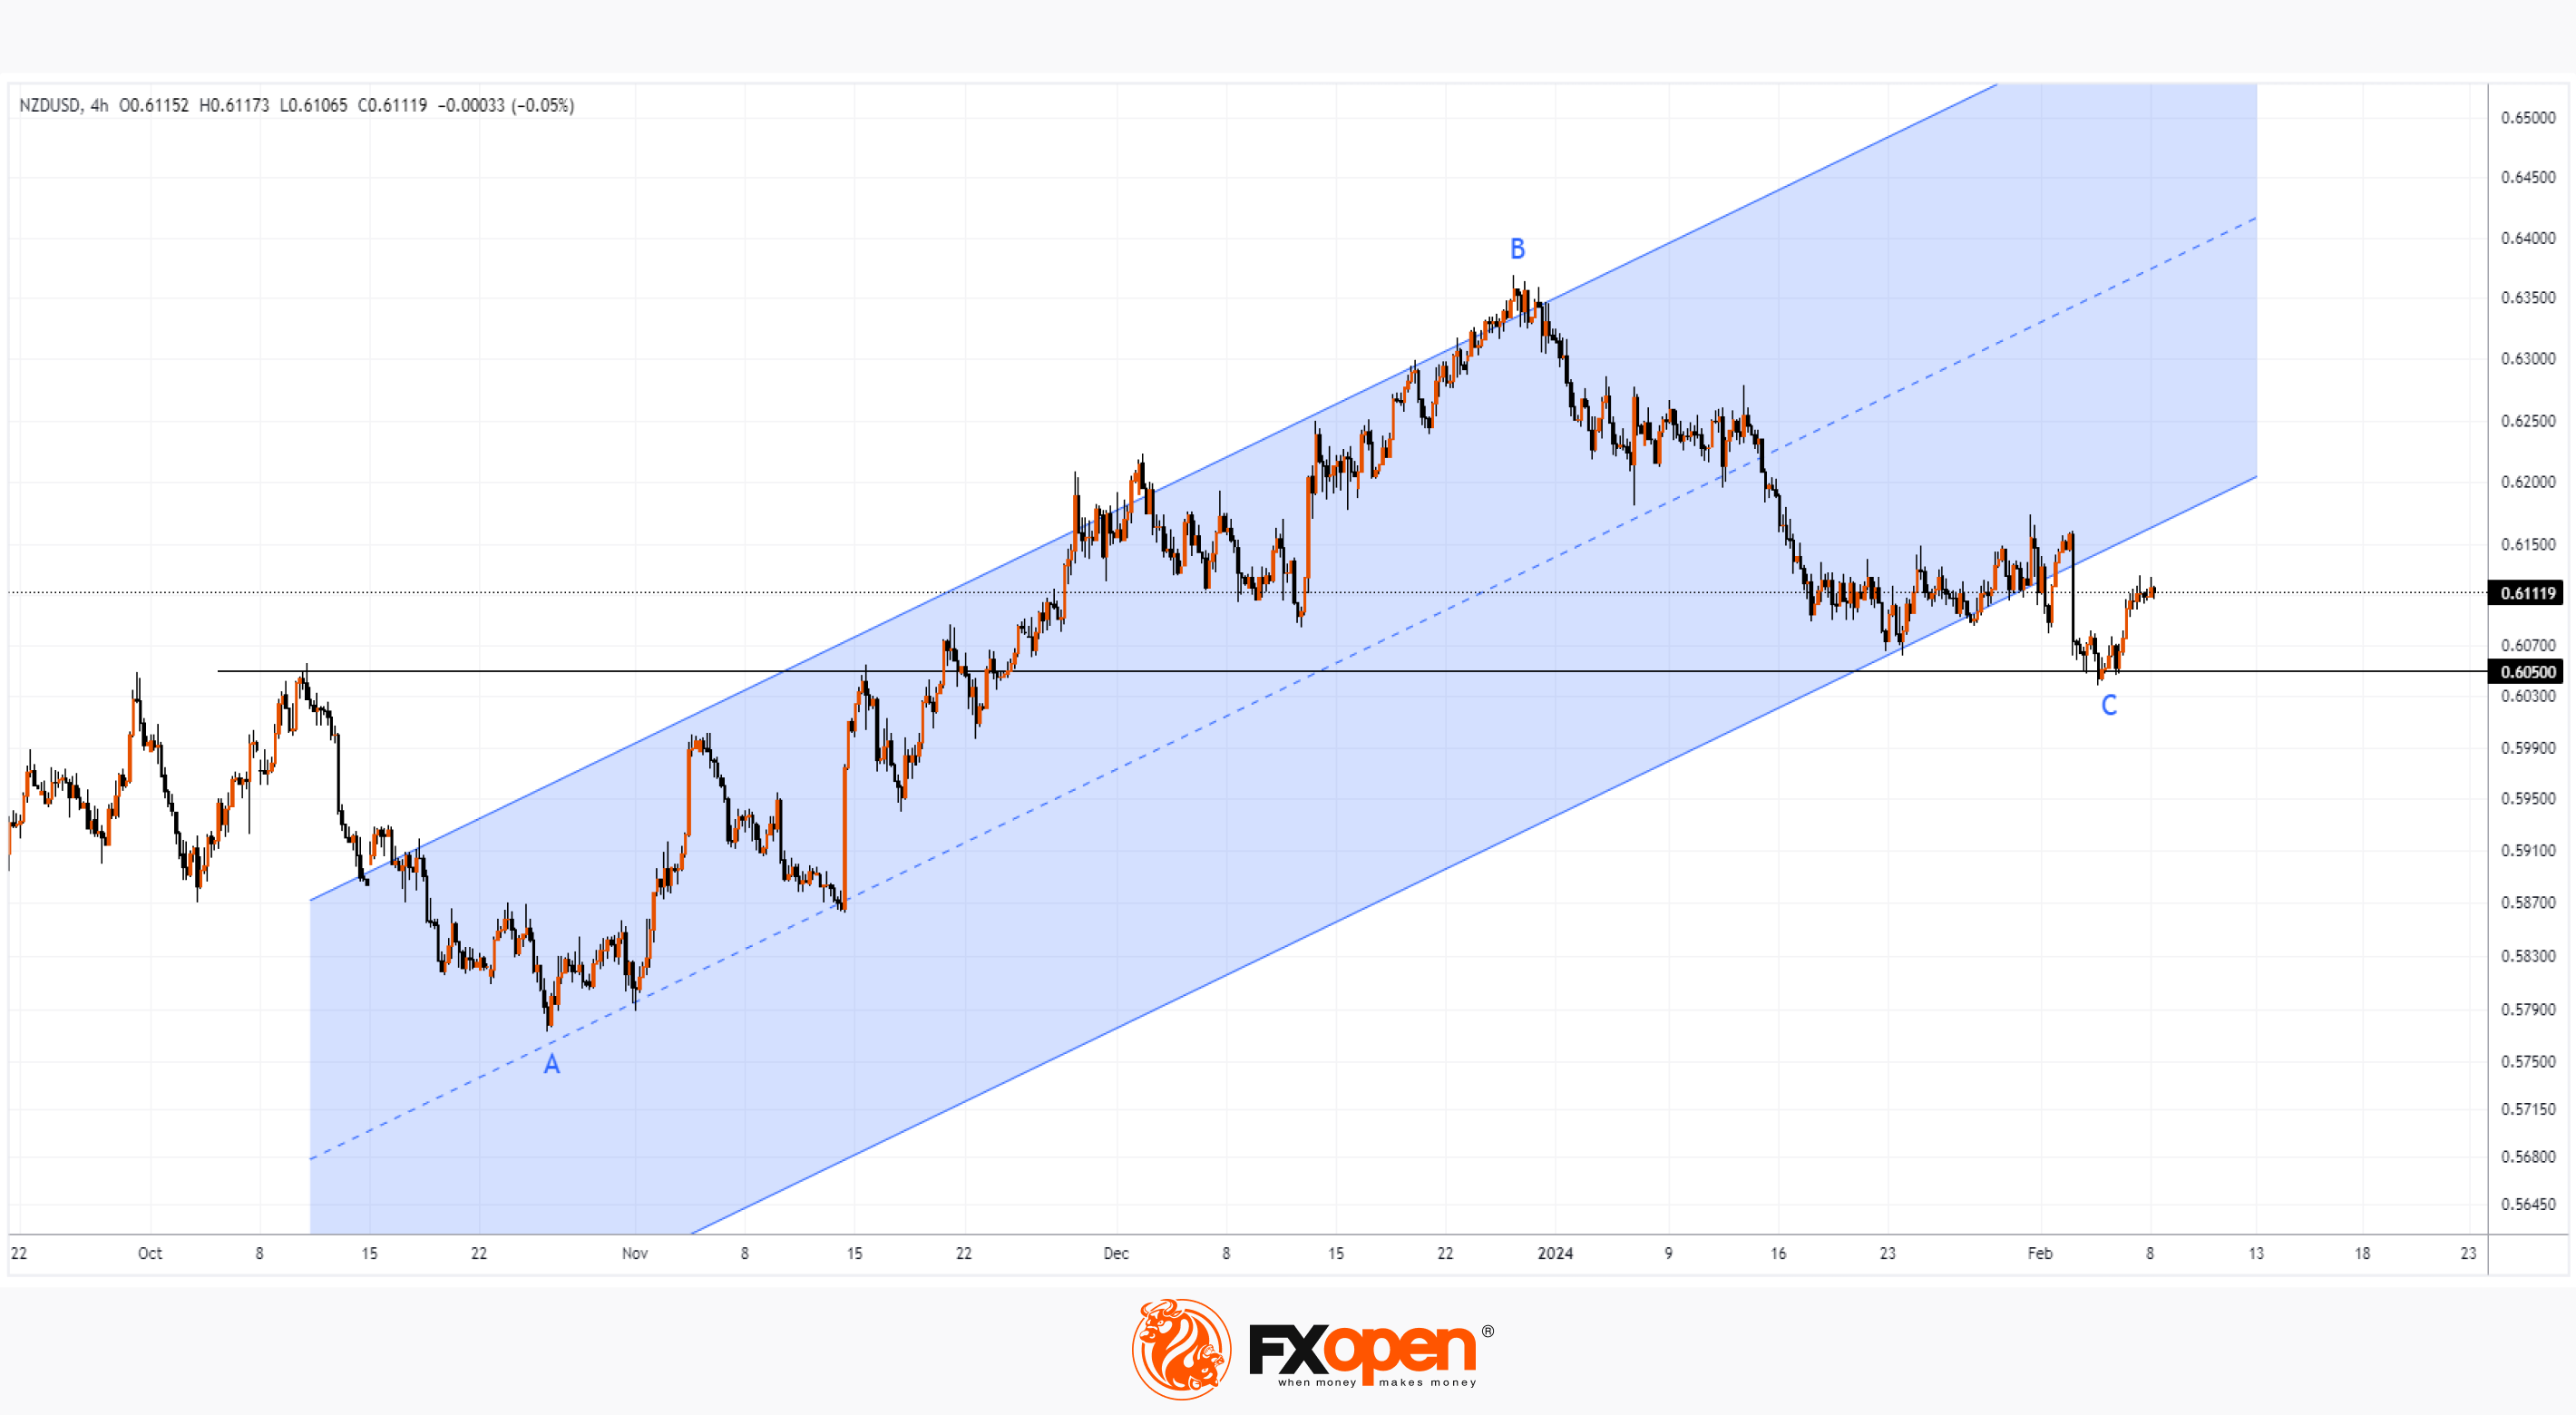
The news helped the NZD strengthen against other currencies. Moreover, an interesting situation develops on the NZD/USD chart:
→ based on the results of yesterday, the price recovered and strengthened above the low C, which today is the minimum of 2024.
→ Moreover, level C is in the region of 50% of the rollback from the impulse movement A→B.
→ At the same time, the chart shows signs of a failed bearish breakout of the level of 0.6050, which previously served as resistance.
Considering the above arguments, there is reason to believe that the bulls may try to resume the uptrend (shown by the blue channel) after the price of NZD/USD has fallen below its border (for now - not for long). The trigger for a new surge in volatility could be news about the state of the labour market in the US, data is expected today at 16:30 GMT+3.
Trade over 50 forex markets 24 hours a day with FXOpen. Take advantage of low commissions, deep liquidity, and spreads from 0.0 pips. Open your FXOpen account now or learn more about trading forex with FXOpen.
CFDs are complex instruments and come with a high risk of losing your money.
This article represents the opinion of the Companies operating under the FXOpen brand only. It is not to be construed as an offer, solicitation, or recommendation with respect to products and services provided by the Companies operating under the FXOpen brand, nor is it to be considered financial advice.
NZD/USD Rate Recovering from Its Low of the Year amid News from Labour Market
Yesterday's news showed that New Zealand's labour market is stronger and more resilient than expected.
In the fourth quarter of 2023, employment grew by 0.4% in the fourth quarter (forecast = +0.3%, quarter earlier = -0.1%). The unemployment rate is 4%, forecast = 4.3%.
A strong labour market indicates a margin of safety in the economy. And that may suggest that the Reserve Bank of New Zealand's tight monetary policy to quell inflation may continue longer.
The news helped the NZD strengthen against other currencies. Moreover, an interesting situation develops on the NZD/USD chart:
→ based on the results of yesterday, the price recovered and strengthened above the low C, which today is the minimum of 2024.
→ Moreover, level C is in the region of 50% of the rollback from the impulse movement A→B.
→ At the same time, the chart shows signs of a failed bearish breakout of the level of 0.6050, which previously served as resistance.
Considering the above arguments, there is reason to believe that the bulls may try to resume the uptrend (shown by the blue channel) after the price of NZD/USD has fallen below its border (for now - not for long). The trigger for a new surge in volatility could be news about the state of the labour market in the US, data is expected today at 16:30 GMT+3.
Trade over 50 forex markets 24 hours a day with FXOpen. Take advantage of low commissions, deep liquidity, and spreads from 0.0 pips. Open your FXOpen account now or learn more about trading forex with FXOpen.
CFDs are complex instruments and come with a high risk of losing your money.
This article represents the opinion of the Companies operating under the FXOpen brand only. It is not to be construed as an offer, solicitation, or recommendation with respect to products and services provided by the Companies operating under the FXOpen brand, nor is it to be considered financial advice.
👍2
#marketanalysis #sp500 #stockmarket
The Price of S&P 500 Sets Historical Record By Exceeding 5,000
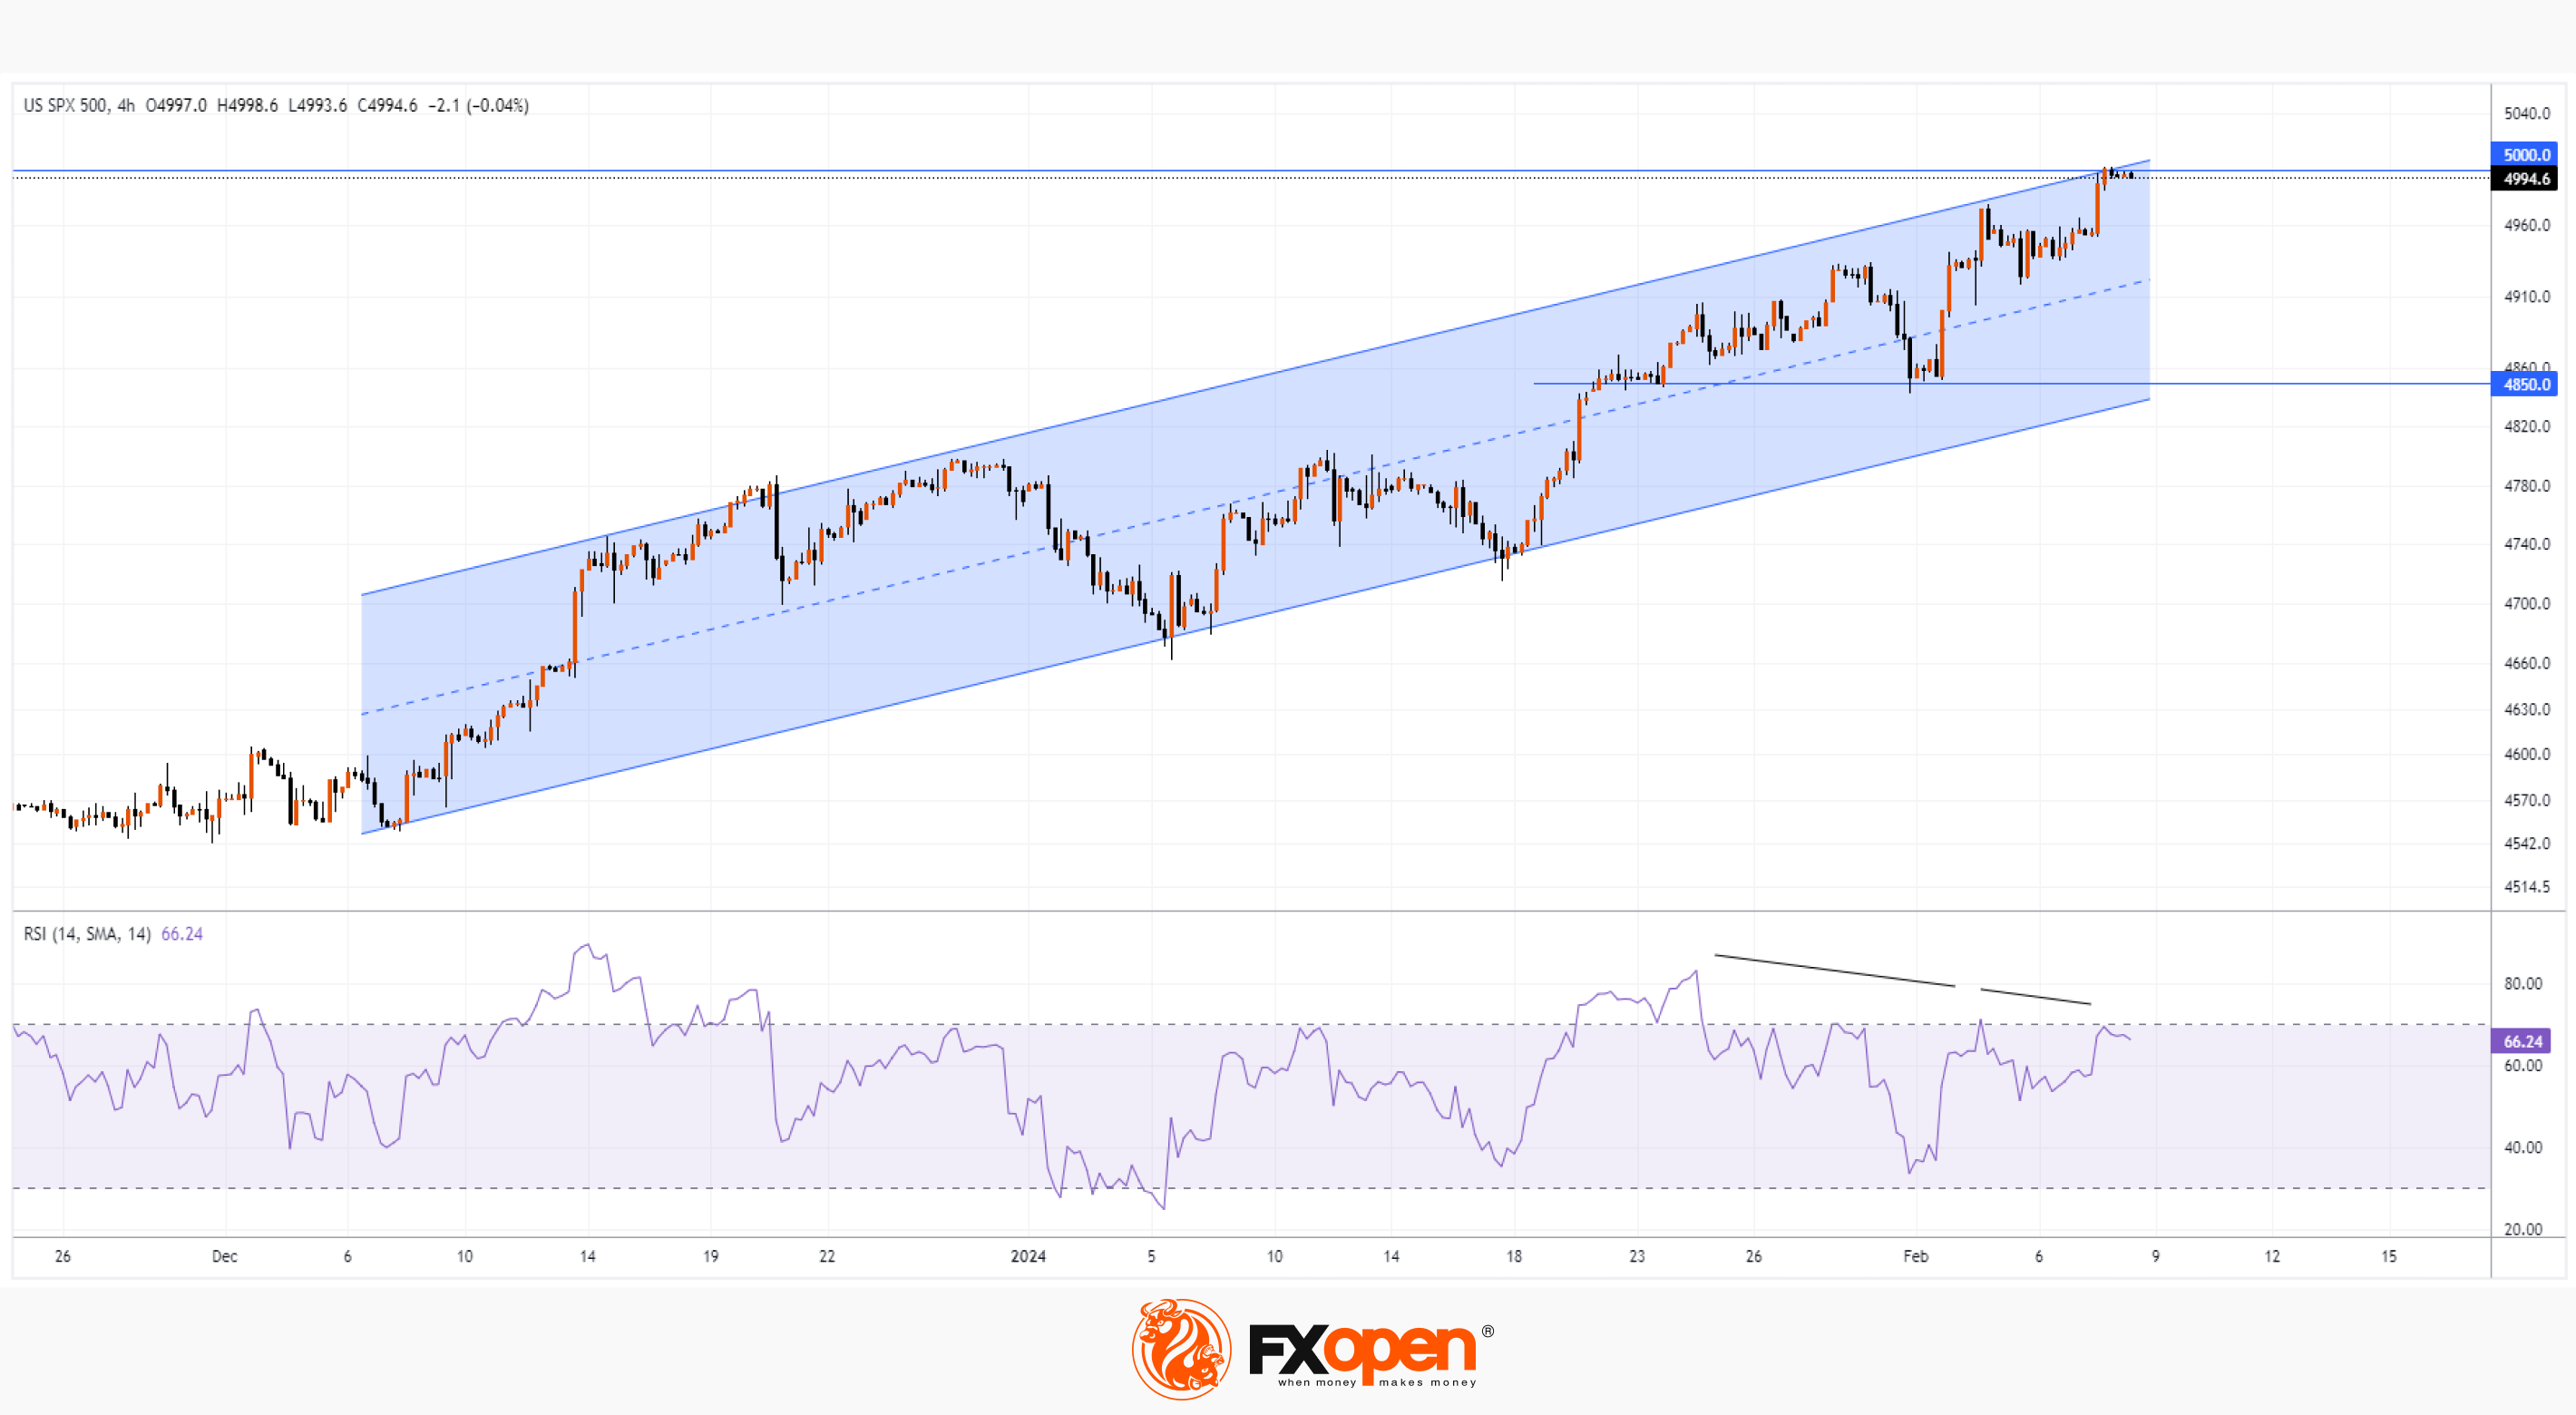
As the graph shows, yesterday, the price of the S&P 500 index exceeded the psychological level of 5,000 for the first time in history. Bullish sentiment in the US stock market is supported by 2 drivers.
1) Expectation of lower interest rates. So, yesterday, the head of the Minneapolis Fed, Neel Kashkari, noted that at the moment he expects two or three rate cuts this year.
2) Strong company reporting for the 4th quarter of 2023. At the end of last week, 46% of S&P 500 companies had reported. Of these companies, 72% reported earnings per share that were above expectations. The successes of technology giants attract particular attention.
As MarketWatch notes, if stocks act strongly in January, there is a significant chance that stocks will continue to rise. This year, the S&P 500 is up 2.5% since the start of January. And according to statistics since 1953, if the S&P 500 grew by 2% or more in January, it gained an average of 13.5% by the end of the year. The index showed positive dynamics in 84% of cases.
The S&P 500 chart today shows that the price is moving within the ascending channel (shown in blue). The slow and steady nature of the growth confirms the strength of bullish sentiment. However:
→ the RSI indicator indicates divergence;
→ the price is near the upper border of the channel.
Therefore, a correction is not excluded - then the psychological level of 5,000 points may become resistance. If a correction occurs, it is possible that the bulls will try to resume the rally from the support of 4,850, in the area of which the lower border of the mentioned ascending channel passes.
Buy and sell stocks of the world's biggest publicly-listed companies with CFDs on FXOpen’s trading platform. Open your FXOpen account now or learn more about trading share CFDs with FXOpen.
CFDs are complex instruments and come with a high risk of losing your money.
This article represents the opinion of the Companies operating under the FXOpen brand only. It is not to be construed as an offer, solicitation, or recommendation with respect to products and services provided by the Companies operating under the FXOpen brand, nor is it to be considered financial advice.
The Price of S&P 500 Sets Historical Record By Exceeding 5,000
As the graph shows, yesterday, the price of the S&P 500 index exceeded the psychological level of 5,000 for the first time in history. Bullish sentiment in the US stock market is supported by 2 drivers.
1) Expectation of lower interest rates. So, yesterday, the head of the Minneapolis Fed, Neel Kashkari, noted that at the moment he expects two or three rate cuts this year.
2) Strong company reporting for the 4th quarter of 2023. At the end of last week, 46% of S&P 500 companies had reported. Of these companies, 72% reported earnings per share that were above expectations. The successes of technology giants attract particular attention.
As MarketWatch notes, if stocks act strongly in January, there is a significant chance that stocks will continue to rise. This year, the S&P 500 is up 2.5% since the start of January. And according to statistics since 1953, if the S&P 500 grew by 2% or more in January, it gained an average of 13.5% by the end of the year. The index showed positive dynamics in 84% of cases.
The S&P 500 chart today shows that the price is moving within the ascending channel (shown in blue). The slow and steady nature of the growth confirms the strength of bullish sentiment. However:
→ the RSI indicator indicates divergence;
→ the price is near the upper border of the channel.
Therefore, a correction is not excluded - then the psychological level of 5,000 points may become resistance. If a correction occurs, it is possible that the bulls will try to resume the rally from the support of 4,850, in the area of which the lower border of the mentioned ascending channel passes.
Buy and sell stocks of the world's biggest publicly-listed companies with CFDs on FXOpen’s trading platform. Open your FXOpen account now or learn more about trading share CFDs with FXOpen.
CFDs are complex instruments and come with a high risk of losing your money.
This article represents the opinion of the Companies operating under the FXOpen brand only. It is not to be construed as an offer, solicitation, or recommendation with respect to products and services provided by the Companies operating under the FXOpen brand, nor is it to be considered financial advice.
👍3
#marketanalysis #MarketNews #tradingforex
Price of USD/JPY Reaches 10-week High amid Statements by Head of Bank of Japan
Bank of Japan Governor Kazuo Ueda said today that there is a high likelihood that accommodative monetary conditions will continue even after the bank ends its negative interest rate policy — an event that is expected as early as next month, according to Reuters.
On the other hand, the USD index has been strengthening since the beginning of 2024, indicating that market participants assume that the easing of the current tight Fed policy may last longer.
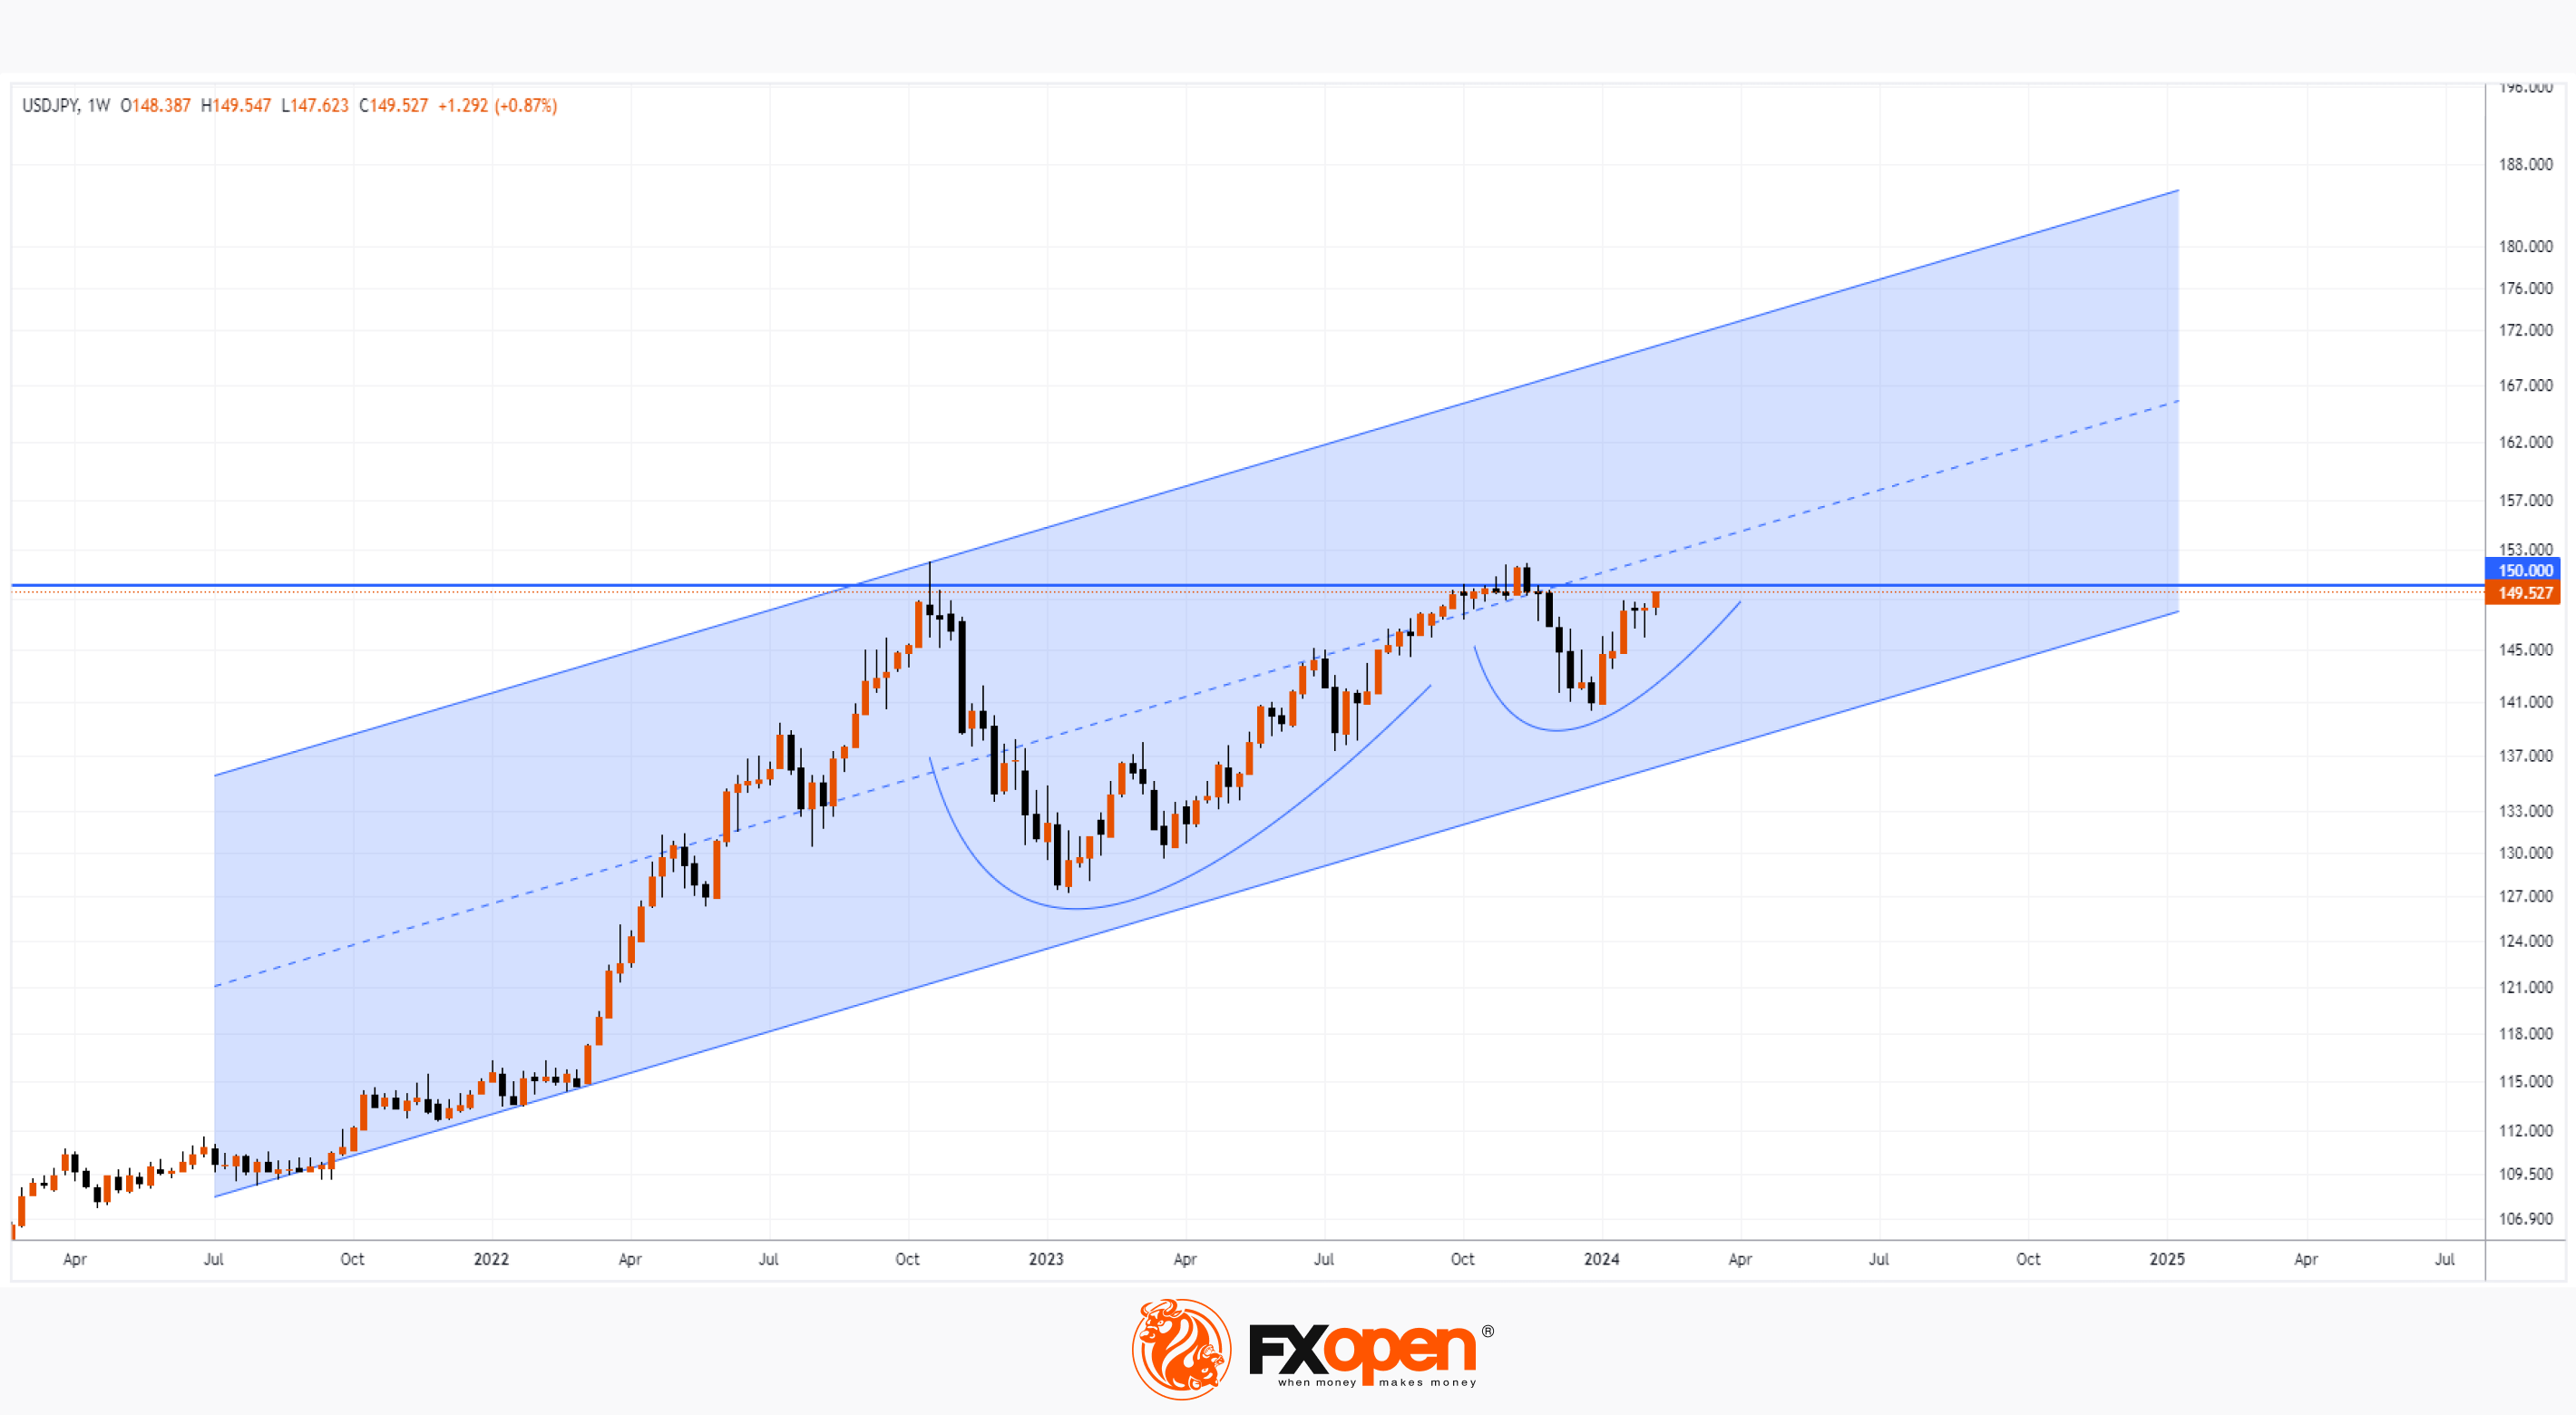
As a result, the price of USD/JPY rises again towards the psychological level of 150 yen per dollar.
The weekly USD/JPY chart shows that:
→ After an attempt at a bullish breakout of this level in the fall of 2022, a strong bearish impulse occurred (justified by the actions of the Bank of Japan to protect the yen), and the price dropped below the level of 130 yen per dollar in early 2023.
→ After an attempt at a bullish breakout in the fall of 2023, a less powerful bearish movement formed, the rate did not fall below 140 yen per dollar.
As a result, a huge cup-and-handle pattern has formed on the USD/JPY chart, which suggests that another attempt at a bullish breakout of the 150 yen per dollar level (if it happens) may be successful, and then the price will have room to continue to rise within the long-term ascending channel (shown in blue).
Technical analysis of the USD/JPY price on lower time frames will provide more details, updated in real time, about how active the bulls are in their push towards the 150 yen level, and how effectively the bears are resisting.
Trade over 50 forex markets 24 hours a day with FXOpen. Take advantage of low commissions, deep liquidity, and spreads from 0.0 pips. Open your FXOpen account now or learn more about trading forex with FXOpen.
CFDs are complex instruments and come with a high risk of losing your money.
This article represents the opinion of the Companies operating under the FXOpen brand only. It is not to be construed as an offer, solicitation, or recommendation with respect to products and services provided by the Companies operating under the FXOpen brand, nor is it to be considered financial advice.
Price of USD/JPY Reaches 10-week High amid Statements by Head of Bank of Japan
Bank of Japan Governor Kazuo Ueda said today that there is a high likelihood that accommodative monetary conditions will continue even after the bank ends its negative interest rate policy — an event that is expected as early as next month, according to Reuters.
On the other hand, the USD index has been strengthening since the beginning of 2024, indicating that market participants assume that the easing of the current tight Fed policy may last longer.
As a result, the price of USD/JPY rises again towards the psychological level of 150 yen per dollar.
The weekly USD/JPY chart shows that:
→ After an attempt at a bullish breakout of this level in the fall of 2022, a strong bearish impulse occurred (justified by the actions of the Bank of Japan to protect the yen), and the price dropped below the level of 130 yen per dollar in early 2023.
→ After an attempt at a bullish breakout in the fall of 2023, a less powerful bearish movement formed, the rate did not fall below 140 yen per dollar.
As a result, a huge cup-and-handle pattern has formed on the USD/JPY chart, which suggests that another attempt at a bullish breakout of the 150 yen per dollar level (if it happens) may be successful, and then the price will have room to continue to rise within the long-term ascending channel (shown in blue).
Technical analysis of the USD/JPY price on lower time frames will provide more details, updated in real time, about how active the bulls are in their push towards the 150 yen level, and how effectively the bears are resisting.
Trade over 50 forex markets 24 hours a day with FXOpen. Take advantage of low commissions, deep liquidity, and spreads from 0.0 pips. Open your FXOpen account now or learn more about trading forex with FXOpen.
CFDs are complex instruments and come with a high risk of losing your money.
This article represents the opinion of the Companies operating under the FXOpen brand only. It is not to be construed as an offer, solicitation, or recommendation with respect to products and services provided by the Companies operating under the FXOpen brand, nor is it to be considered financial advice.
👍3
#marketanalysis #cryptonews #bitcoin #BTCUSD
Bitcoin Recovers to January 11 Prices When ETFs Were Approved
Waiting for SEC regulatory approval of applications to create a Bitcoin ETF was an important driver of Bitcoin price growth at the end of 2023. However, when applications were actually approved on January 11, 2024 (here is what we wrote about it), there was a decline in cryptocurrency prices.
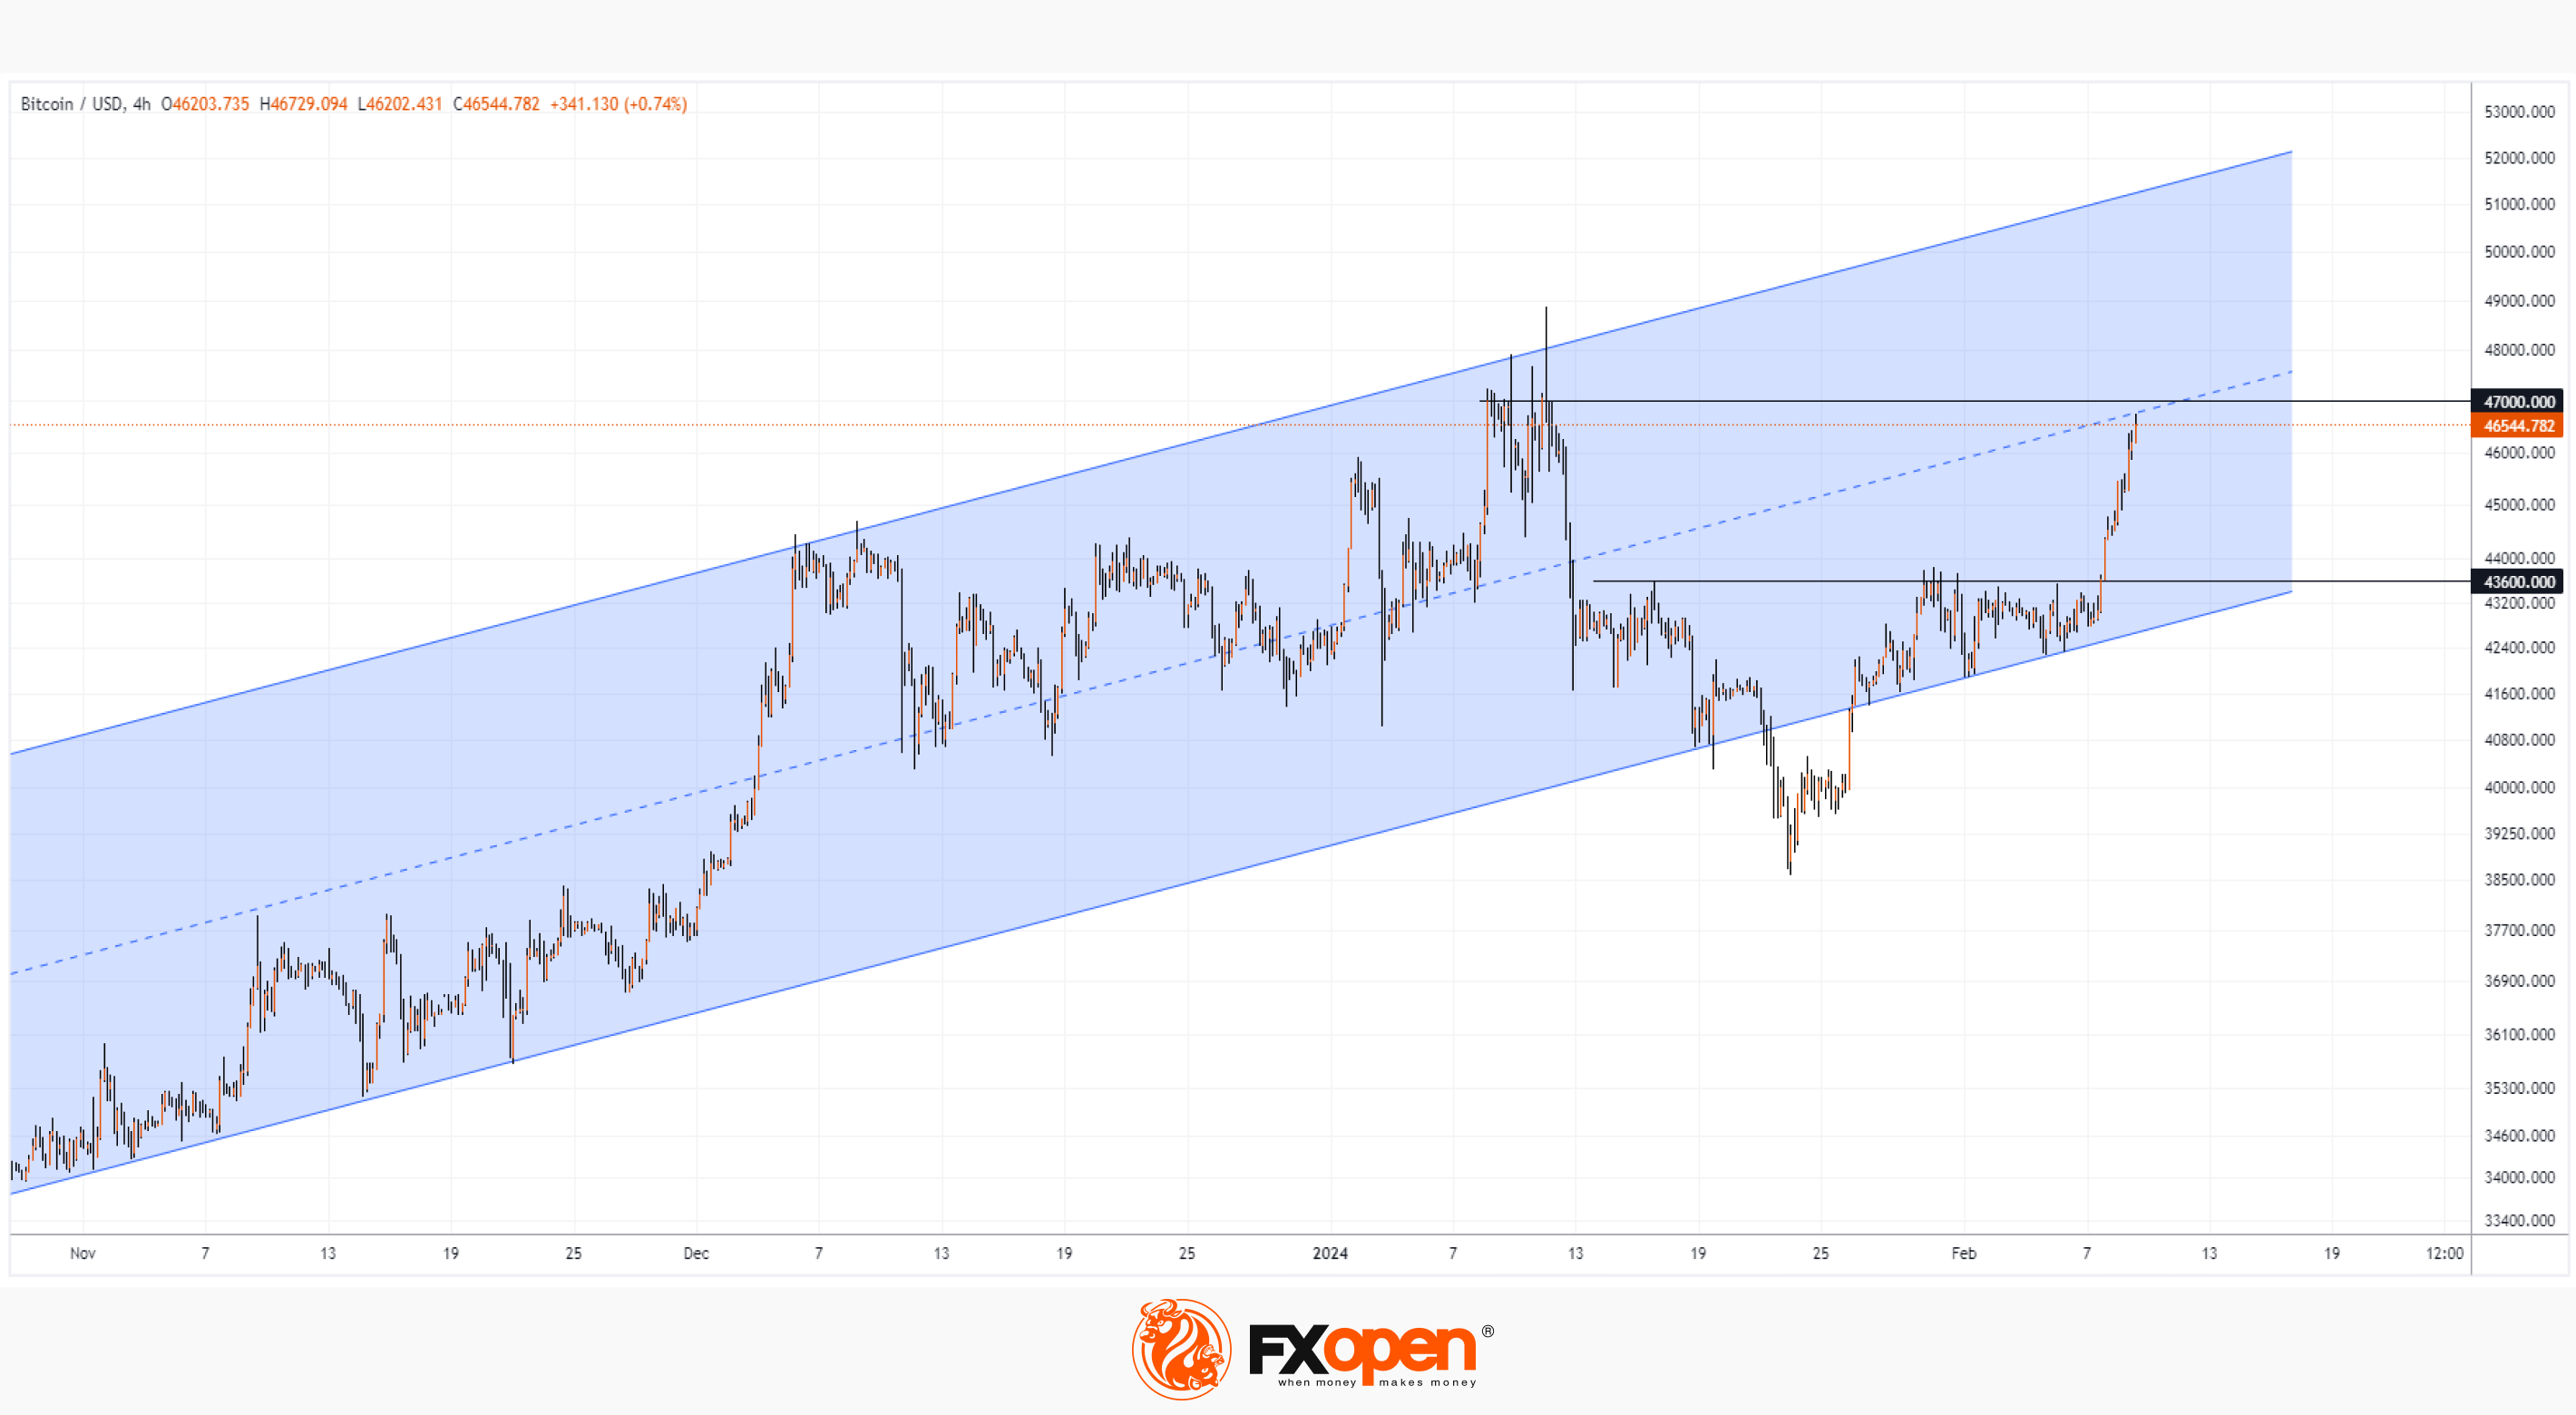
In particular, the price of Bitcoin decreased from a maximum of January 11 at USD 48,877 per coin, dropping below USD 40k in the twenties of January.
Fortunately for investors in the cryptocurrency market, the collapse did not occur, and today the price of Bitcoin exceeded USD 46k, thereby recovering to the levels of January 11.
This was facilitated by:
→ the Chinese New Year (celebration begins on February 10). As crypto media write, traditionally during this period there is an optimistic revival in the cryptocurrency market.
→ Interest in investing in risky assets in anticipation of the Fed lowering interest rates. Access to cryptocurrency investments has become easier with the approval of ETFs.
At the same time, technical analysis of BTC/USD shows that:
→ Bitcoin price is in an upward trend, which is described by a blue channel.
→ The decline below the lower boundary of the channel at the end of January was short-term. Probably the goal was a false breakdown of psychological support at 40 thousand. An example of such patterns could be punctures of the USD 25k level during 2023. Or punctures at the level of 30k in 2021.
How strong is the bullish sentiment? This will be more clear after the Chinese New Year celebrations are over. And also on the action of the price of Bitcoin — after all, it is now near the resistance block, which forms the level of 47k (it prevented the growth of the price of Bitcoin in January) and the median line of the channel. If optimism quickly dries up, it is possible that the price of Bitcoin may roll back to the support at 43,600, which is strengthened by the lower border of the channel.
FXOpen offers the world's most popular cryptocurrency CFDs*, including Bitcoin and Ethereum. Floating spreads, 1:2 leverage — at your service. Open your trading account now or learn more about crypto CFD trading with FXOpen.
*At FXOpen UK and FXOpen AU, Cryptocurrency CFDs are only available for trading by those clients categorised as Professional clients under FCA Rules and Professional clients under ASIC Rules respectively. They are not available for trading by Retail clients.
CFDs are complex instruments and come with a high risk of losing your money.
This article represents the opinion of the Companies operating under the FXOpen brand only. It is not to be construed as an offer, solicitation, or recommendation with respect to products and services provided by the Companies operating under the FXOpen brand, nor is it to be considered financial advice.
Bitcoin Recovers to January 11 Prices When ETFs Were Approved
Waiting for SEC regulatory approval of applications to create a Bitcoin ETF was an important driver of Bitcoin price growth at the end of 2023. However, when applications were actually approved on January 11, 2024 (here is what we wrote about it), there was a decline in cryptocurrency prices.
In particular, the price of Bitcoin decreased from a maximum of January 11 at USD 48,877 per coin, dropping below USD 40k in the twenties of January.
Fortunately for investors in the cryptocurrency market, the collapse did not occur, and today the price of Bitcoin exceeded USD 46k, thereby recovering to the levels of January 11.
This was facilitated by:
→ the Chinese New Year (celebration begins on February 10). As crypto media write, traditionally during this period there is an optimistic revival in the cryptocurrency market.
→ Interest in investing in risky assets in anticipation of the Fed lowering interest rates. Access to cryptocurrency investments has become easier with the approval of ETFs.
At the same time, technical analysis of BTC/USD shows that:
→ Bitcoin price is in an upward trend, which is described by a blue channel.
→ The decline below the lower boundary of the channel at the end of January was short-term. Probably the goal was a false breakdown of psychological support at 40 thousand. An example of such patterns could be punctures of the USD 25k level during 2023. Or punctures at the level of 30k in 2021.
How strong is the bullish sentiment? This will be more clear after the Chinese New Year celebrations are over. And also on the action of the price of Bitcoin — after all, it is now near the resistance block, which forms the level of 47k (it prevented the growth of the price of Bitcoin in January) and the median line of the channel. If optimism quickly dries up, it is possible that the price of Bitcoin may roll back to the support at 43,600, which is strengthened by the lower border of the channel.
FXOpen offers the world's most popular cryptocurrency CFDs*, including Bitcoin and Ethereum. Floating spreads, 1:2 leverage — at your service. Open your trading account now or learn more about crypto CFD trading with FXOpen.
*At FXOpen UK and FXOpen AU, Cryptocurrency CFDs are only available for trading by those clients categorised as Professional clients under FCA Rules and Professional clients under ASIC Rules respectively. They are not available for trading by Retail clients.
CFDs are complex instruments and come with a high risk of losing your money.
This article represents the opinion of the Companies operating under the FXOpen brand only. It is not to be construed as an offer, solicitation, or recommendation with respect to products and services provided by the Companies operating under the FXOpen brand, nor is it to be considered financial advice.
👍2
#AMZN #sp500 #GBPUSD #stockmarket
Weekly Market Wrap With Gary Thomson: S&P 500, CAD, GBP/USD, AMZN
Get the latest scoop on the week's hottest headlines, all in one convenient video. Join Gary Thomson, the COO of FXOpen UK, as he breaks down the most significant news reports and shares his expert insights.
🔸 The Price of S&P 500 Sets Historical Record By Exceeding 5,000
🔸 CAD Strengthened After Statements from the Head of the Bank of Canada
🔸 GBP/USD Displays Volatility as Pound Demonstrates Low Performance
🔸 AMZN Share Price Rises Nearly 8% after Report #Amazon
Stay in the know and empower yourself with our short, yet power-packed video. Watch it now and stay updated with FXOpen. Don't miss out on this invaluable opportunity to sharpen your trading skills and make informed decisions.
https://cutt.ly/owCSFDWl
To take advantage of price fluctuations in the foreign exchange markets, consider enlisting the services of a reliable broker like FXOpen.
⚠️
This forecast represents FXOpen Companies opinion only, it should not be construed as an offer, invitation or recommendation in respect to FXOpen Companies products and services or as financial advice
Weekly Market Wrap With Gary Thomson: S&P 500, CAD, GBP/USD, AMZN
Get the latest scoop on the week's hottest headlines, all in one convenient video. Join Gary Thomson, the COO of FXOpen UK, as he breaks down the most significant news reports and shares his expert insights.
🔸 The Price of S&P 500 Sets Historical Record By Exceeding 5,000
🔸 CAD Strengthened After Statements from the Head of the Bank of Canada
🔸 GBP/USD Displays Volatility as Pound Demonstrates Low Performance
🔸 AMZN Share Price Rises Nearly 8% after Report #Amazon
Stay in the know and empower yourself with our short, yet power-packed video. Watch it now and stay updated with FXOpen. Don't miss out on this invaluable opportunity to sharpen your trading skills and make informed decisions.
https://cutt.ly/owCSFDWl
To take advantage of price fluctuations in the foreign exchange markets, consider enlisting the services of a reliable broker like FXOpen.
⚠️
This forecast represents FXOpen Companies opinion only, it should not be construed as an offer, invitation or recommendation in respect to FXOpen Companies products and services or as financial advice
YouTube
Weekly Market Wrap With Gary Thomson: S&P 500, CAD, GBP/USD, AMZN
Get the latest scoop on the week's hottest headlines, all in one convenient video. Join Gary Thomson, the COO of FXOpen UK, as he breaks down the most significant news reports and shares his expert insights.
00:33 - The Price of S&P 500 Sets Historical Record…
00:33 - The Price of S&P 500 Sets Historical Record…
👍2
#marketanalysis #stockmarket #stocks
Nikkei 225 Index Price Sets 34-year High
The price of the Nikkei 225 index is fixed above the level of 37,000 points. The last time this happened was after the index reached its all-time high in 1989.
The bullish behavior of the Japanese stock market has the following reasons:
→ Strong corporate reporting. In particular, SoftBank shares rose 11% due to increased sales of its subsidiary Arm, which develops chips for the development of artificial intelligence.
→ Dovish view of the Bank of Japan's monetary policy. Thus, Bank of Japan Vice Governor Shinichi Uchida said that the central bank will not aggressively tighten its monetary policy even if it ultimately decides to end negative interest rates.
The Nikkei 225 index chart shows that:
→ the price moves within a large-scale ascending channel (shown in blue), which covers the entire year 2023;
→ in 2024, the price rises within the channel shown in black;
→ the 34,000 level was broken with an acceleration in the rally on January 10 - evidence that the bulls held a landslide victory here — so the area above 34,000 could serve as an area of support;
→ the median line of the blue channel and the lower border of the black channel can also serve as support for the price of the Nikkei 225 index in the event of a correction.
And a correction is very likely, given that the RSI indicator indicates a bearish divergence (a sign of depleted demand forces) — perhaps investors are busy taking profits after the price of the Nikkei 225 index has risen by more than 12% since the beginning of 2024.
Trade global index CFDs with zero commission and tight spreads. Open your FXOpen account now or learn more about trading index CFDs with FXOpen.
CFDs are complex instruments and come with a high risk of losing your money.
This article represents the opinion of the Companies operating under the FXOpen brand only. It is not to be construed as an offer, solicitation, or recommendation with respect to products and services provided by the Companies operating under the FXOpen brand, nor is it to be considered financial advice.
Nikkei 225 Index Price Sets 34-year High
The price of the Nikkei 225 index is fixed above the level of 37,000 points. The last time this happened was after the index reached its all-time high in 1989.
The bullish behavior of the Japanese stock market has the following reasons:
→ Strong corporate reporting. In particular, SoftBank shares rose 11% due to increased sales of its subsidiary Arm, which develops chips for the development of artificial intelligence.
→ Dovish view of the Bank of Japan's monetary policy. Thus, Bank of Japan Vice Governor Shinichi Uchida said that the central bank will not aggressively tighten its monetary policy even if it ultimately decides to end negative interest rates.
The Nikkei 225 index chart shows that:
→ the price moves within a large-scale ascending channel (shown in blue), which covers the entire year 2023;
→ in 2024, the price rises within the channel shown in black;
→ the 34,000 level was broken with an acceleration in the rally on January 10 - evidence that the bulls held a landslide victory here — so the area above 34,000 could serve as an area of support;
→ the median line of the blue channel and the lower border of the black channel can also serve as support for the price of the Nikkei 225 index in the event of a correction.
And a correction is very likely, given that the RSI indicator indicates a bearish divergence (a sign of depleted demand forces) — perhaps investors are busy taking profits after the price of the Nikkei 225 index has risen by more than 12% since the beginning of 2024.
Trade global index CFDs with zero commission and tight spreads. Open your FXOpen account now or learn more about trading index CFDs with FXOpen.
CFDs are complex instruments and come with a high risk of losing your money.
This article represents the opinion of the Companies operating under the FXOpen brand only. It is not to be construed as an offer, solicitation, or recommendation with respect to products and services provided by the Companies operating under the FXOpen brand, nor is it to be considered financial advice.
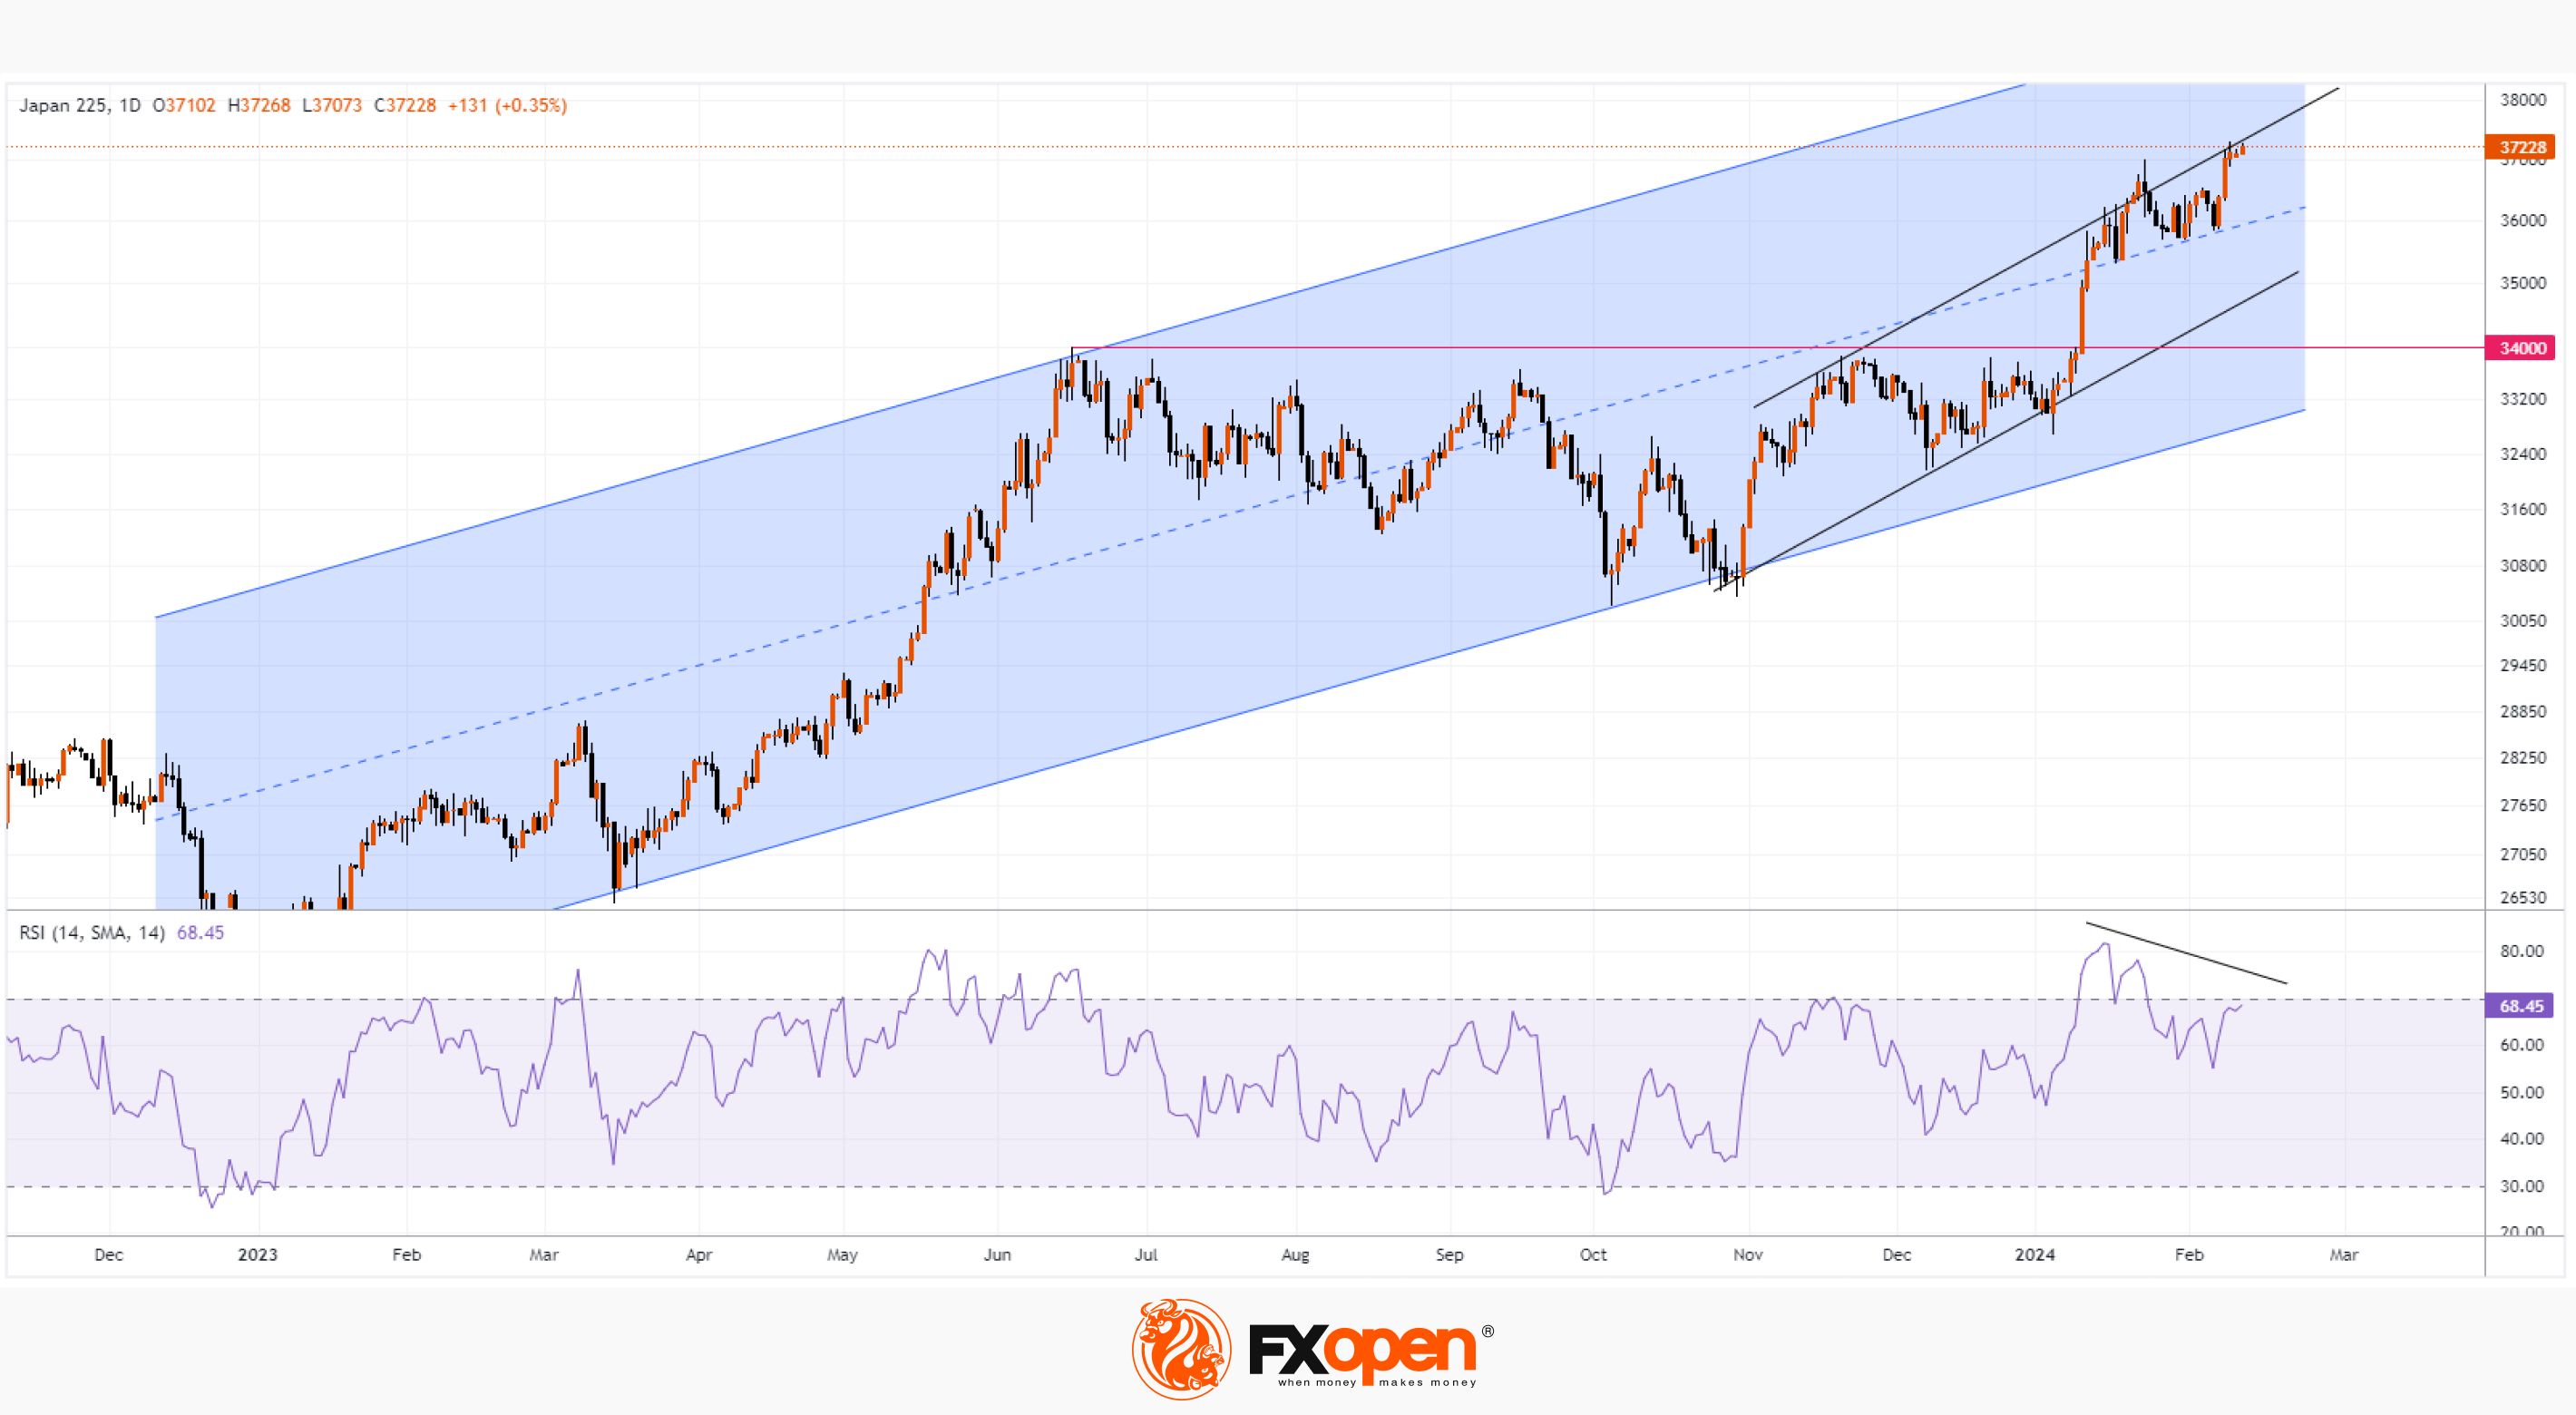
👍3
#bitcoin #BTCUSD #MarketNews
Bitcoin Price Exceeds Psychological Level of $50k
The last time the BTC price was above $50,000 was in December 2021, making its way to the low around $15,500 reached in November 2022.
Reaching the $50,000 level was facilitated by:
→ waiting for the halving, after which the price of Bitcoin is believed to receive a bullish impulse due to a reduction in supply;
→ the effect of the approval of a Bitcoin ETF;
→ expectation of easing of the Fed's monetary policy, which increases interest in risky assets. By the way, the Nasdaq-100 technology stock index set a historical high yesterday, breaking the level of 18,000 points.
At the same time, the BTC/USD chart shows that:
→ the price of Bitcoin moves within an ascending channel (shown in blue), which dates back to last fall;
→ from the point of view of technical analysis, with this channel construction, the price of Bitcoin still has some room to rise to its upper limit.
However, please note that:
→ the widely known crypto fear and greed index has a value of 79 out of 100, indicating extreme greed;
→ the RSI indicator is in the overbought zone and is forming a bearish divergence pattern, which is a sign of weakening buying pressure;
→ exceeding the psychological level can result in a false breakout, as was the case with a short-term decline in the price of Bitcoin below the support level of 40,000.
Considering the above arguments, there is reason to believe that if the Bitcoin rally continues, it may soon be replaced by a correction to allow the market to “blow off steam” at least in the short term.
FXOpen offers the world's most popular cryptocurrency CFDs*, including Bitcoin and Ethereum. Floating spreads, 1:2 leverage — at your service. Open your trading account now or learn more about crypto CFD trading with FXOpen.
*At FXOpen UK and FXOpen AU, Cryptocurrency CFDs are only available for trading by those clients categorised as Professional clients under FCA Rules and Professional clients under ASIC Rules respectively. They are not available for trading by Retail clients.
CFDs are complex instruments and come with a high risk of losing your money.
This article represents the opinion of the Companies operating under the FXOpen brand only. It is not to be construed as an offer, solicitation, or recommendation with respect to products and services provided by the Companies operating under the FXOpen brand, nor is it to be considered financial advice.
Bitcoin Price Exceeds Psychological Level of $50k
The last time the BTC price was above $50,000 was in December 2021, making its way to the low around $15,500 reached in November 2022.
Reaching the $50,000 level was facilitated by:
→ waiting for the halving, after which the price of Bitcoin is believed to receive a bullish impulse due to a reduction in supply;
→ the effect of the approval of a Bitcoin ETF;
→ expectation of easing of the Fed's monetary policy, which increases interest in risky assets. By the way, the Nasdaq-100 technology stock index set a historical high yesterday, breaking the level of 18,000 points.
At the same time, the BTC/USD chart shows that:
→ the price of Bitcoin moves within an ascending channel (shown in blue), which dates back to last fall;
→ from the point of view of technical analysis, with this channel construction, the price of Bitcoin still has some room to rise to its upper limit.
However, please note that:
→ the widely known crypto fear and greed index has a value of 79 out of 100, indicating extreme greed;
→ the RSI indicator is in the overbought zone and is forming a bearish divergence pattern, which is a sign of weakening buying pressure;
→ exceeding the psychological level can result in a false breakout, as was the case with a short-term decline in the price of Bitcoin below the support level of 40,000.
Considering the above arguments, there is reason to believe that if the Bitcoin rally continues, it may soon be replaced by a correction to allow the market to “blow off steam” at least in the short term.
FXOpen offers the world's most popular cryptocurrency CFDs*, including Bitcoin and Ethereum. Floating spreads, 1:2 leverage — at your service. Open your trading account now or learn more about crypto CFD trading with FXOpen.
*At FXOpen UK and FXOpen AU, Cryptocurrency CFDs are only available for trading by those clients categorised as Professional clients under FCA Rules and Professional clients under ASIC Rules respectively. They are not available for trading by Retail clients.
CFDs are complex instruments and come with a high risk of losing your money.
This article represents the opinion of the Companies operating under the FXOpen brand only. It is not to be construed as an offer, solicitation, or recommendation with respect to products and services provided by the Companies operating under the FXOpen brand, nor is it to be considered financial advice.
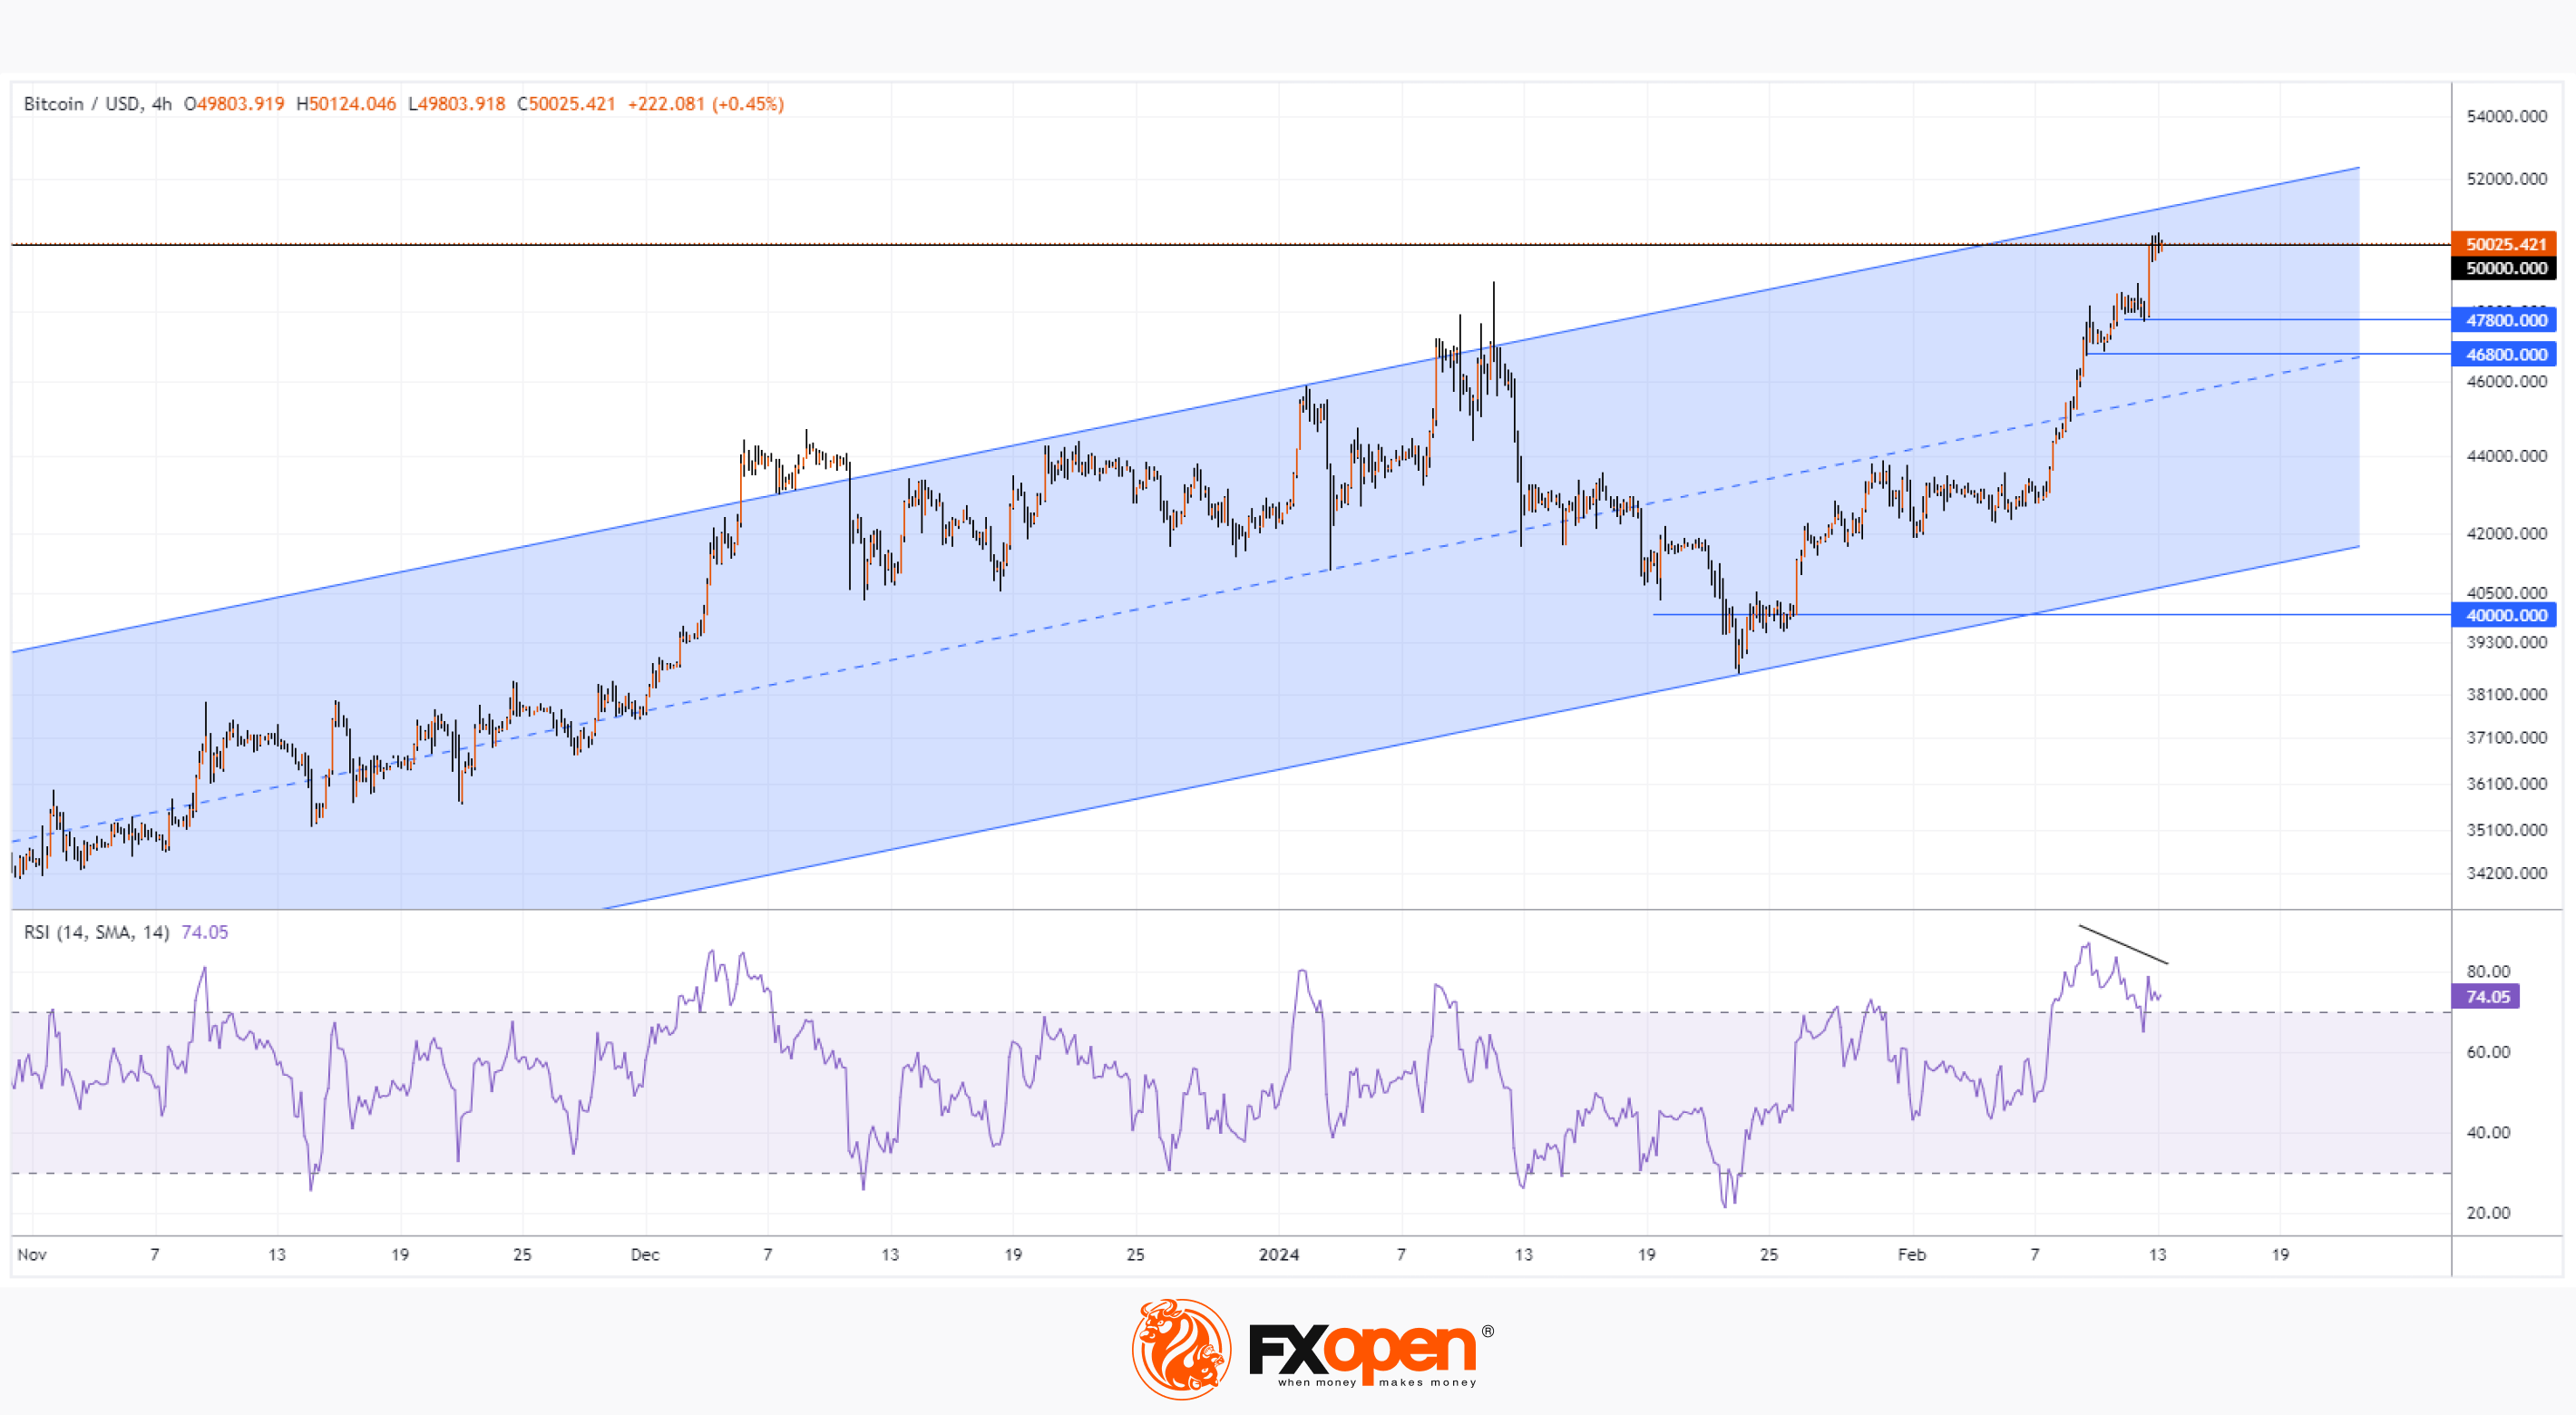
👍4