
#tsla #stockmarket #MarketNews #stocks #ElonMusk
TSLA Analysis: Price Recovers after Disastrous Report
We previously wrote that lower vehicle deliveries could lower TSLA's stock price.
And as it became known on Tuesday, Tesla, led by Elon Musk, delivered just 386,810 cars in the first three months of 2024 - 14% below analysts' forecasts, according to Bloomberg. As a result, Tesla shares fell 4.9% that day, extending their 2024 decline to 33%, the worst performance in the Nasdaq 100 Index.
What is the market outlook?
Bullish arguments:
→ After a strong disappointment on Tuesday, the price of TSLA showed signs of stability on Wednesday and Thursday. Since these were bullish candles, and the market was recovering despite the non-bearish gap on Tuesday, this can be interpreted as a sign of demand.
→ From the point of view of technical analysis, the market is supported by the lower border of the downward channel (shown in red). The price forms rebounds from this border, as shown by the arrows.
→ Bloomberg writes about a decrease in the number of short positions after the report on Tuesday. This could be a sign that short position holders do not see any further decline in the price of TSLA and are taking profits.
Bearish arguments:
→ TSLA price is still in the lower half of the downward channel, despite the bullish sentiment in the stock market.
→ Resistance may come from the level of USD 183 per share and the median line of the descending channel.
If the bears continue to dominate, the price of TSLA could fall towards the psychological level of USD 150 per share. But the balance of sentiment may be changed by the release of Tesla’s first-quarter reports, scheduled for April 17.
Buy and sell stocks of the world's biggest publicly-listed companies with CFDs on FXOpen’s trading platform. Open your FXOpen account now or learn more about trading share CFDs with FXOpen.
CFDs are complex instruments and come with a high risk of losing your money.
This article represents the opinion of the Companies operating under the FXOpen brand only. It is not to be construed as an offer, solicitation, or recommendation with respect to products and services provided by the Companies operating under the FXOpen brand, nor is it to be considered financial advice.
TSLA Analysis: Price Recovers after Disastrous Report
We previously wrote that lower vehicle deliveries could lower TSLA's stock price.
And as it became known on Tuesday, Tesla, led by Elon Musk, delivered just 386,810 cars in the first three months of 2024 - 14% below analysts' forecasts, according to Bloomberg. As a result, Tesla shares fell 4.9% that day, extending their 2024 decline to 33%, the worst performance in the Nasdaq 100 Index.
What is the market outlook?
Bullish arguments:
→ After a strong disappointment on Tuesday, the price of TSLA showed signs of stability on Wednesday and Thursday. Since these were bullish candles, and the market was recovering despite the non-bearish gap on Tuesday, this can be interpreted as a sign of demand.
→ From the point of view of technical analysis, the market is supported by the lower border of the downward channel (shown in red). The price forms rebounds from this border, as shown by the arrows.
→ Bloomberg writes about a decrease in the number of short positions after the report on Tuesday. This could be a sign that short position holders do not see any further decline in the price of TSLA and are taking profits.
Bearish arguments:
→ TSLA price is still in the lower half of the downward channel, despite the bullish sentiment in the stock market.
→ Resistance may come from the level of USD 183 per share and the median line of the descending channel.
If the bears continue to dominate, the price of TSLA could fall towards the psychological level of USD 150 per share. But the balance of sentiment may be changed by the release of Tesla’s first-quarter reports, scheduled for April 17.
Buy and sell stocks of the world's biggest publicly-listed companies with CFDs on FXOpen’s trading platform. Open your FXOpen account now or learn more about trading share CFDs with FXOpen.
CFDs are complex instruments and come with a high risk of losing your money.
This article represents the opinion of the Companies operating under the FXOpen brand only. It is not to be construed as an offer, solicitation, or recommendation with respect to products and services provided by the Companies operating under the FXOpen brand, nor is it to be considered financial advice.
Market Pulse
TSLA analysis: Price Returns to Above the $170 Level, But for How Long?
After forming a low of the year on March 14, TSLA price managed to rise above the USD 170 level
👍3
#BTCUSD #bitcoin #cryptonews #crypto
BTC/USD Analysis: Bearish Arguments Become More Convincing
On March 18, we wrote about the activation of bears near the USD 70,000 level and the likelihood of consolidation forming near this psychological mark.
On March 25, we wrote that anxiety remains in the Bitcoin market.
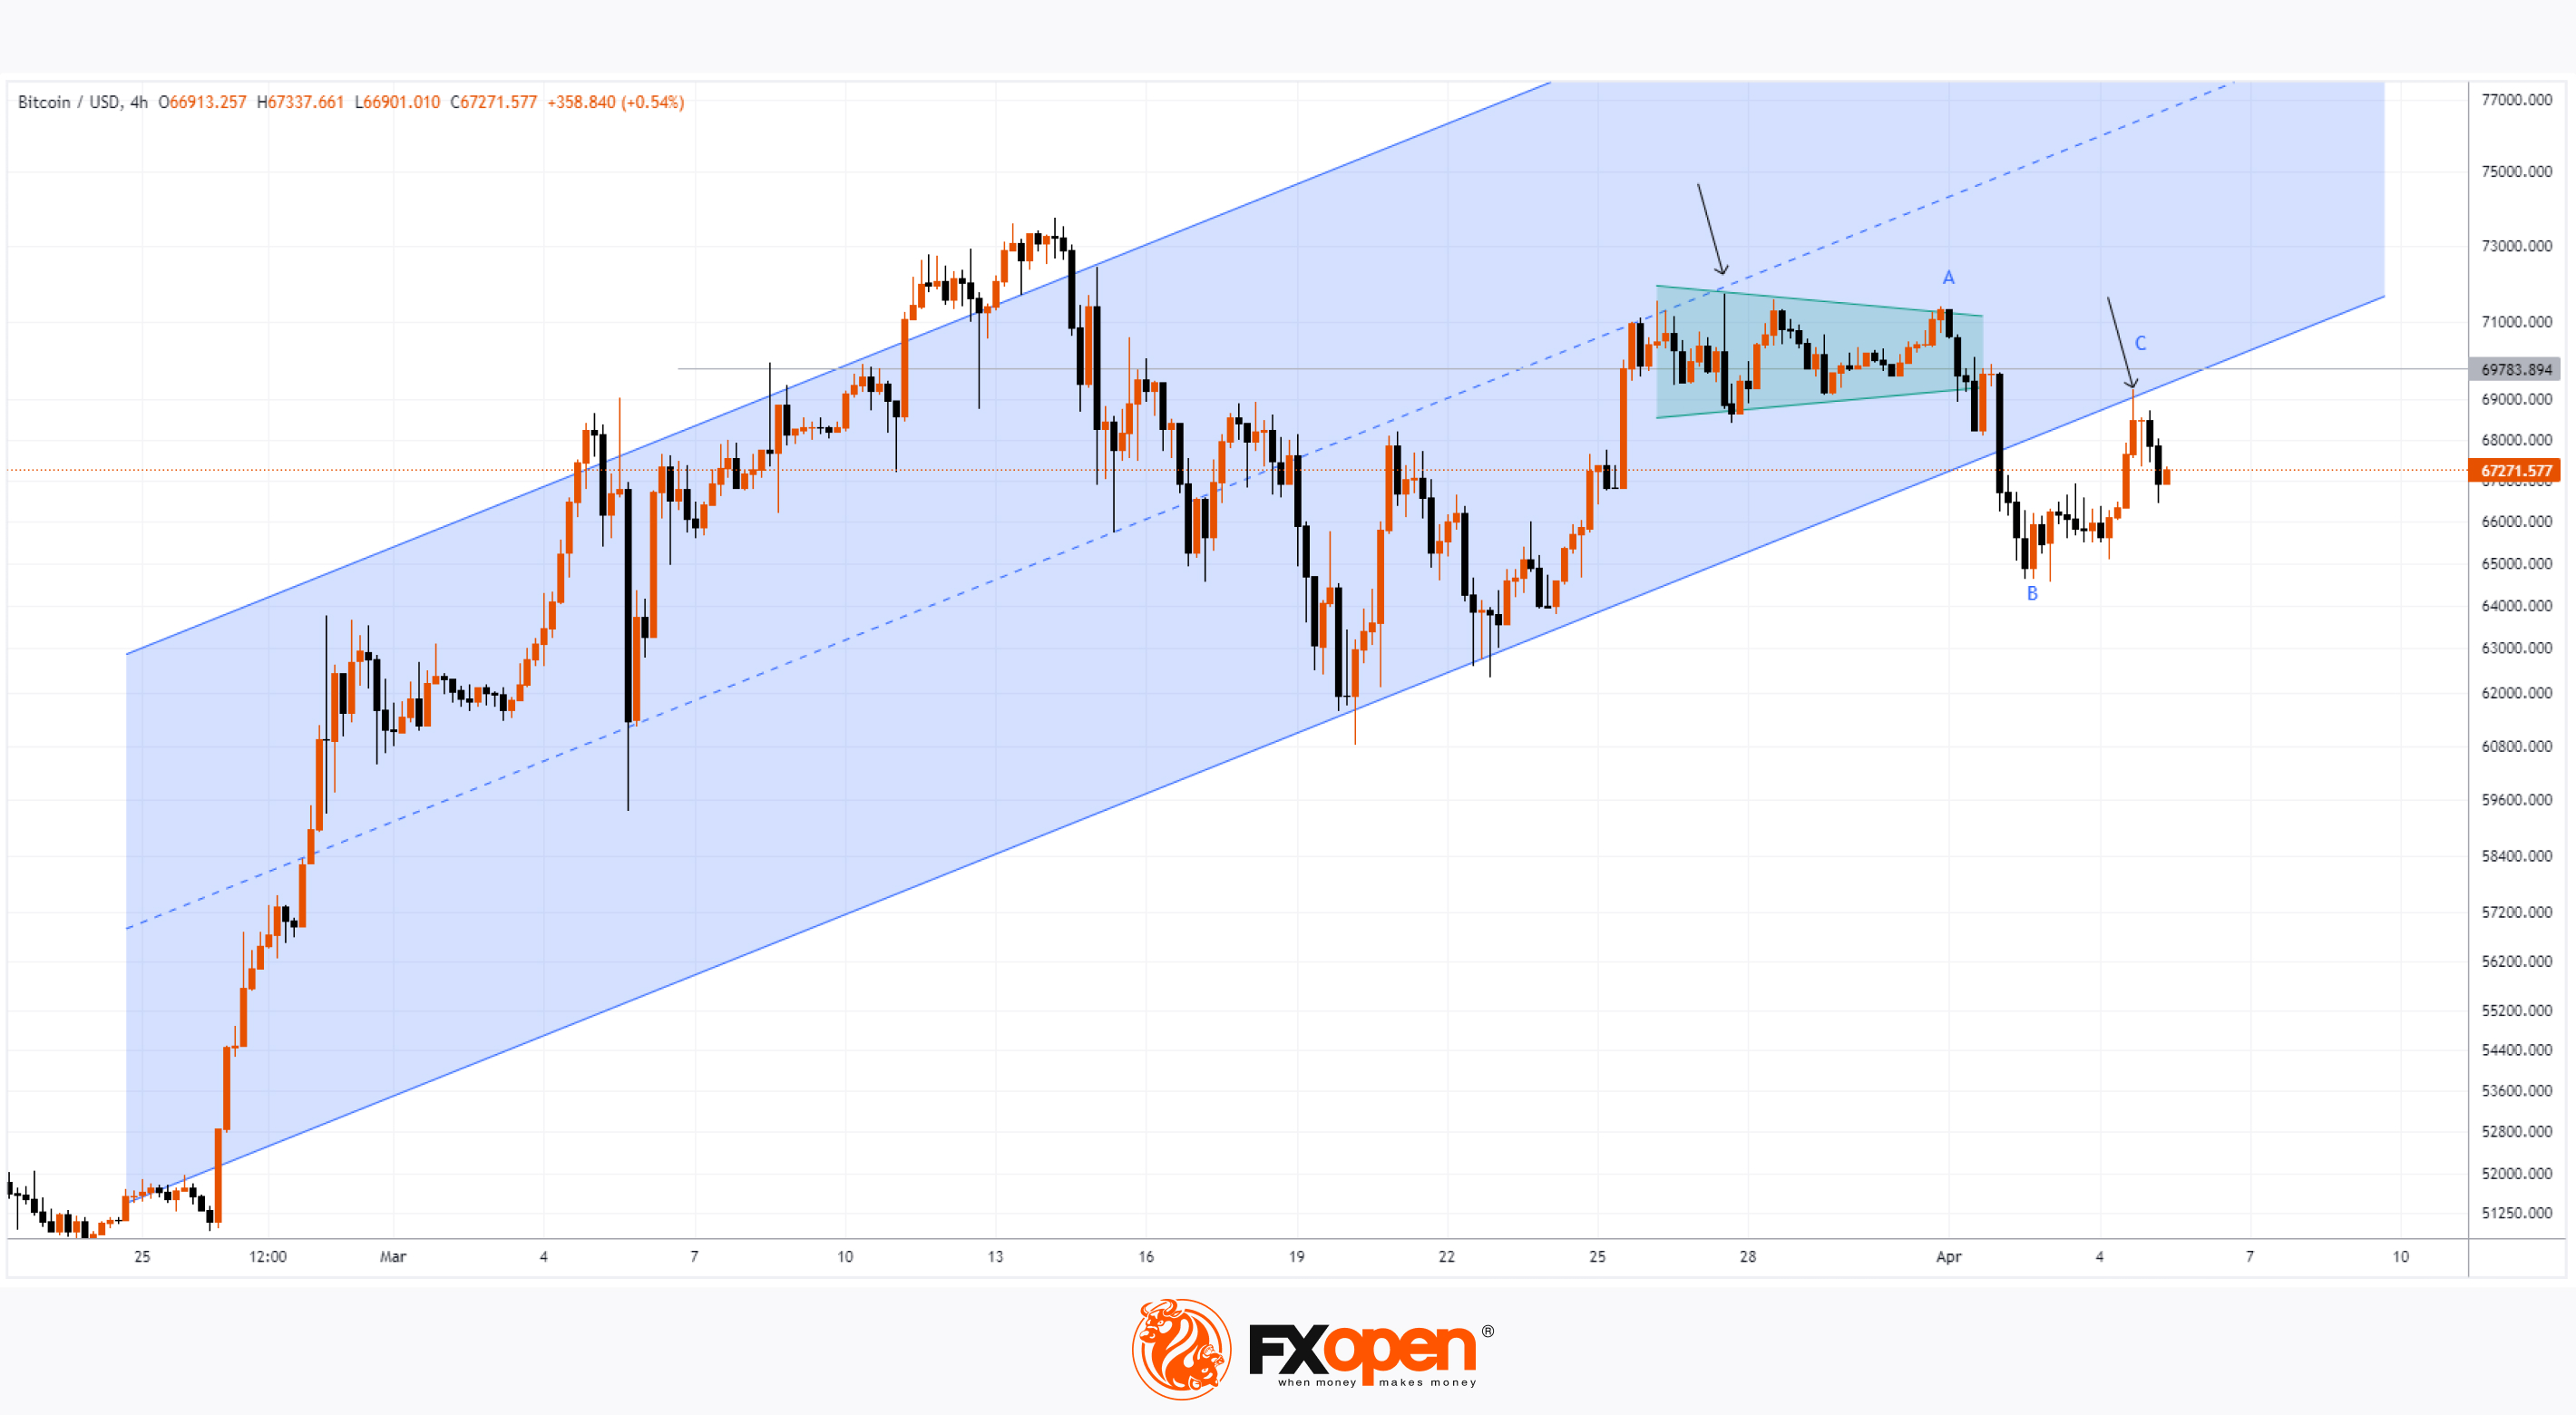
Technical analysis of the BTC/USD chart with new data on the behavior of Bitcoin prices today relative to the previously designated levels and lines shows that bearish arguments are becoming more convincing:
→ the median line of the ascending channel acted as resistance (shown by the first arrow);
→ the price has formed a consolidation zone (shown in green) with a subsequent bearish exit from it;
→ after a bearish breakdown of the lower border of the ascending channel, it showed signs of resistance (shown by the second arrow);
→ the increase in B→C is about 50% of the decrease in A→B, which corresponds to the proportion of the normal intermediate recovery within the dominant bearish trend.
Attempts to reach the level of USD 70k for Bitcoin in April were unsuccessful. The inability of the cryptocurrency price to demonstrate bullish dynamics is alarming due to the approaching halving, which is considered a positive factor influencing the price of Bitcoin.
It is possible that further developments will provide more turning points for building a downward channel.
FXOpen offers the world's most popular cryptocurrency CFDs*, including Bitcoin and Ethereum. Floating spreads, 1:2 leverage — at your service. Open your trading account now or learn more about crypto CFD trading with FXOpen.
*At FXOpen UK and FXOpen AU, Cryptocurrency CFDs are only available for trading by those clients categorised as Professional clients under FCA Rules and Professional clients under AFSL 412871 – ABN 61 143 678 719 respectively. They are not available for trading by Retail clients.
CFDs are complex instruments and come with a high risk of losing your money.
This article represents the opinion of the Companies operating under the FXOpen brand only. It is not to be construed as an offer, solicitation, or recommendation with respect to products and services provided by the Companies operating under the FXOpen brand, nor is it to be considered financial advice.
BTC/USD Analysis: Bearish Arguments Become More Convincing
On March 18, we wrote about the activation of bears near the USD 70,000 level and the likelihood of consolidation forming near this psychological mark.
On March 25, we wrote that anxiety remains in the Bitcoin market.
Technical analysis of the BTC/USD chart with new data on the behavior of Bitcoin prices today relative to the previously designated levels and lines shows that bearish arguments are becoming more convincing:
→ the median line of the ascending channel acted as resistance (shown by the first arrow);
→ the price has formed a consolidation zone (shown in green) with a subsequent bearish exit from it;
→ after a bearish breakdown of the lower border of the ascending channel, it showed signs of resistance (shown by the second arrow);
→ the increase in B→C is about 50% of the decrease in A→B, which corresponds to the proportion of the normal intermediate recovery within the dominant bearish trend.
Attempts to reach the level of USD 70k for Bitcoin in April were unsuccessful. The inability of the cryptocurrency price to demonstrate bullish dynamics is alarming due to the approaching halving, which is considered a positive factor influencing the price of Bitcoin.
It is possible that further developments will provide more turning points for building a downward channel.
FXOpen offers the world's most popular cryptocurrency CFDs*, including Bitcoin and Ethereum. Floating spreads, 1:2 leverage — at your service. Open your trading account now or learn more about crypto CFD trading with FXOpen.
*At FXOpen UK and FXOpen AU, Cryptocurrency CFDs are only available for trading by those clients categorised as Professional clients under FCA Rules and Professional clients under AFSL 412871 – ABN 61 143 678 719 respectively. They are not available for trading by Retail clients.
CFDs are complex instruments and come with a high risk of losing your money.
This article represents the opinion of the Companies operating under the FXOpen brand only. It is not to be construed as an offer, solicitation, or recommendation with respect to products and services provided by the Companies operating under the FXOpen brand, nor is it to be considered financial advice.
👍3
#oilprices #EURUSD #stockmarket #goldprice #XAUUSD
Weekly Market Wrap With Gary Thomson: US stock market, EUR/USD, Oil, Gold
Get the latest scoop on the week's hottest headlines, all in one convenient video. Join Gary Thomson, the COO of FXOpen UK, as he breaks down the most significant news reports and shares his expert insights.
🔸 The US Stock Market Awaits the Publication of NFP and Unemployment Data
🔸 Market Analysis: EUR/USD Starts Recovery, USD/CHF Could Extend Gains
🔸 Brent Oil Price Reaches Its Highest Since October 2023
🔸 Gold Price XAU/USD Sets Another All-time High
Stay in the know and empower yourself with our short, yet power-packed video. Watch it now and stay updated with FXOpen. Don't miss out on this invaluable opportunity to sharpen your trading skills and make informed decisions.
https://cutt.ly/Qw8KWpdE
To take advantage of price fluctuations in the foreign exchange markets, consider enlisting the services of a reliable broker like FXOpen.
⚠️
This forecast represents FXOpen Companies opinion only, it should not be construed as an offer, invitation or recommendation in respect to FXOpen Companies products and services or as financial advice
Weekly Market Wrap With Gary Thomson: US stock market, EUR/USD, Oil, Gold
Get the latest scoop on the week's hottest headlines, all in one convenient video. Join Gary Thomson, the COO of FXOpen UK, as he breaks down the most significant news reports and shares his expert insights.
🔸 The US Stock Market Awaits the Publication of NFP and Unemployment Data
🔸 Market Analysis: EUR/USD Starts Recovery, USD/CHF Could Extend Gains
🔸 Brent Oil Price Reaches Its Highest Since October 2023
🔸 Gold Price XAU/USD Sets Another All-time High
Stay in the know and empower yourself with our short, yet power-packed video. Watch it now and stay updated with FXOpen. Don't miss out on this invaluable opportunity to sharpen your trading skills and make informed decisions.
https://cutt.ly/Qw8KWpdE
To take advantage of price fluctuations in the foreign exchange markets, consider enlisting the services of a reliable broker like FXOpen.
⚠️
This forecast represents FXOpen Companies opinion only, it should not be construed as an offer, invitation or recommendation in respect to FXOpen Companies products and services or as financial advice
YouTube
Weekly Market Wrap With Gary Thomson: US stock market, EUR/USD, Oil, Gold
Get the latest scoop on the week's hottest headlines, all in one convenient video. Join Gary Thomson, the COO of FXOpen UK, as he breaks down the most significant news reports and shares his expert insights.
00:32 The US Stock Market Awaits the Publication…
00:32 The US Stock Market Awaits the Publication…
👍2
#BTCUSD #bitcoin #cryptonews #crypto #MarketNews
BTC/USD Analysis: Bitcoin Price Rises Ahead of Halving
The halving (reduction of block mining rewards) is expected to occur on April 19-20.
Theoretically, Bitcoin mining will become less profitable, leading to a reduction in coin supply. Given unchanged demand, this should drive up the BTC/USD price. Ripple CEO Brad Garlinghouse has forecasted that the cryptocurrency market cap will double by the end of 2024, reaching $5 trillion, with Bitcoin's halving contributing to this growth.
In practice, Bitcoin price is influenced by too many factors to conclusively prove the bullish impact of halving. For instance, looking at history, the last halving occurred on May 11, 2020, and the price increased by approximately 12% in the following week. On the other hand, today's Bitcoin price might already reflect the imminent halving.
Nevertheless, the market currently shows predominantly positive sentiment, as over the weekend, BTC/USD price rose by around 2.5%.
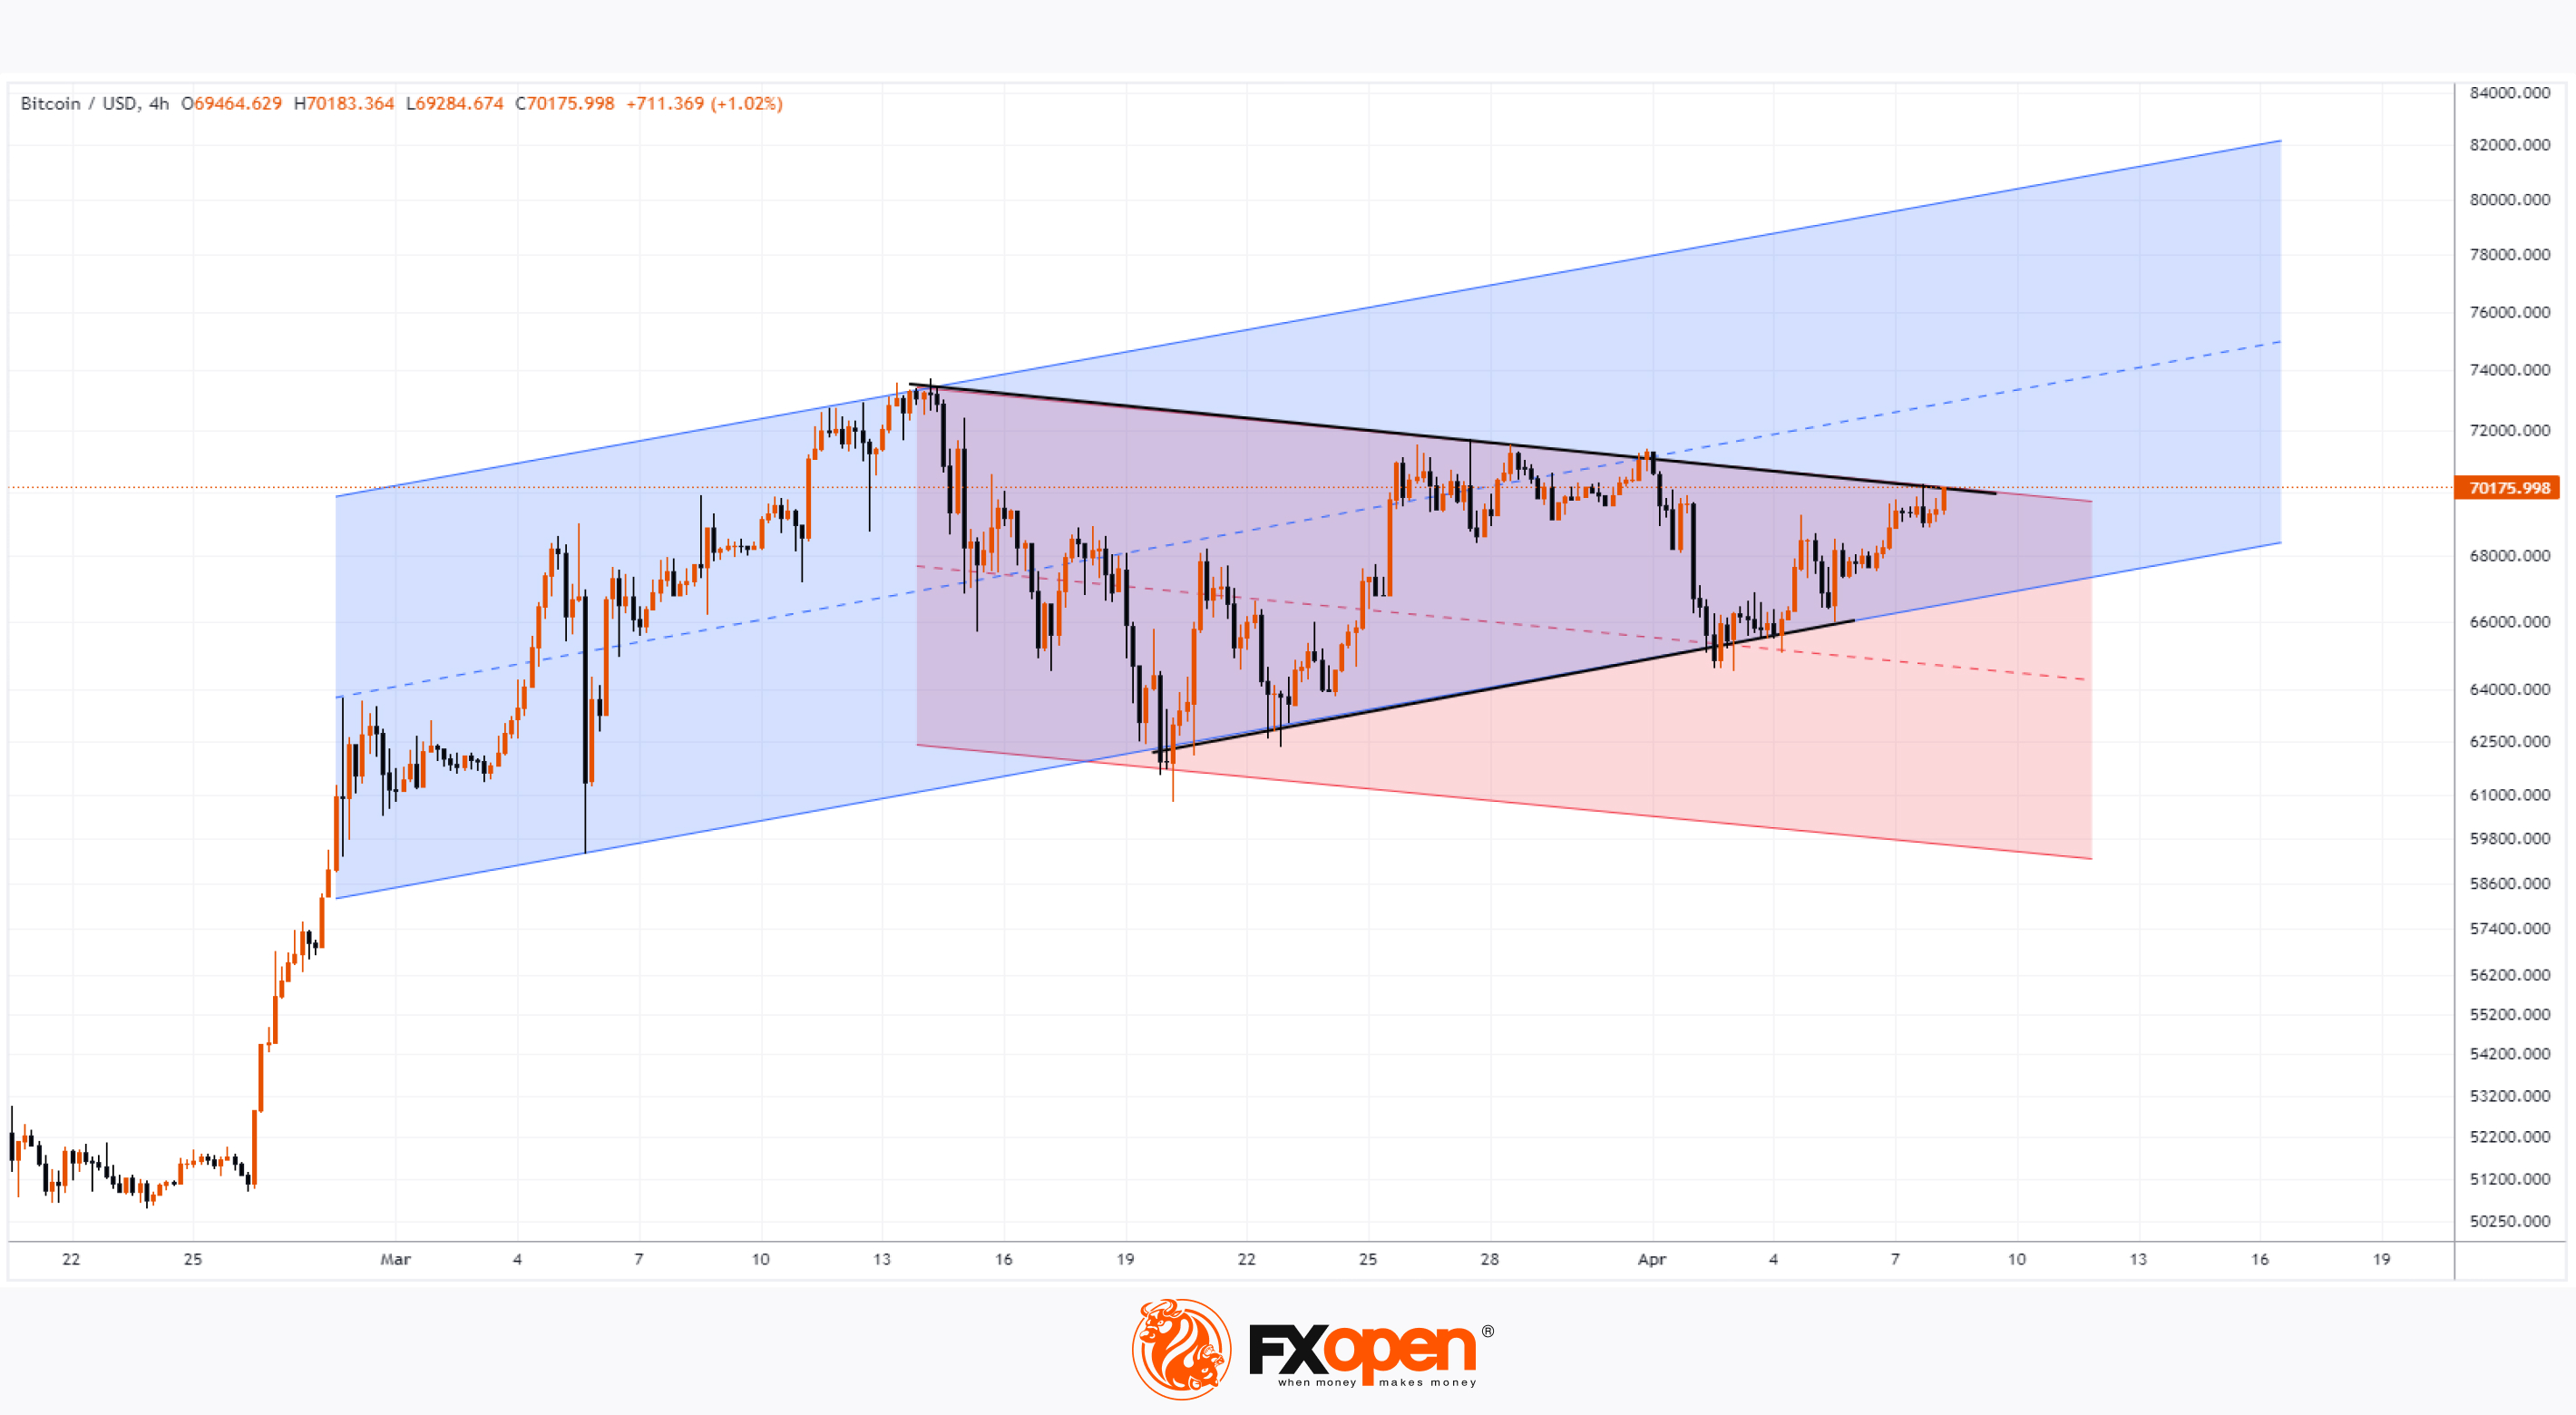
According to the technical analysis of the BTC/USD chart today:
→ From April 2-4, there was no downward pressure on the market to push the price below the lower boundary of the ascending channel (shown in blue), which remains relevant.
→ Conversely, a series of higher lows forming since April 2 indicates bullish intentions to break above the descending channel (shown in red).
Therefore, the approaching halving and associated positive expectations could lead to:
→ Breaking above the consolidating zone (shown with black lines).
→ Overcoming a significant resistance level near the psychological mark of $70,000 per coin.
In this scenario, the nearest target for bulls could be the median line of the blue ascending channel.
FXOpen offers the world's most popular cryptocurrency CFDs*, including Bitcoin and Ethereum. Floating spreads, 1:2 leverage — at your service. Open your trading account now or learn more about crypto CFD trading with FXOpen.
*At FXOpen UK and FXOpen AU, Cryptocurrency CFDs are only available for trading by those clients categorised as Professional clients under FCA Rules and Professional clients under AFSL 412871 – ABN 61 143 678 719 respectively. They are not available for trading by Retail clients.
CFDs are complex instruments and come with a high risk of losing your money.
This article represents the opinion of the Companies operating under the FXOpen brand only. It is not to be construed as an offer, solicitation, or recommendation with respect to products and services provided by the Companies operating under the FXOpen brand, nor is it to be considered financial advice.
BTC/USD Analysis: Bitcoin Price Rises Ahead of Halving
The halving (reduction of block mining rewards) is expected to occur on April 19-20.
Theoretically, Bitcoin mining will become less profitable, leading to a reduction in coin supply. Given unchanged demand, this should drive up the BTC/USD price. Ripple CEO Brad Garlinghouse has forecasted that the cryptocurrency market cap will double by the end of 2024, reaching $5 trillion, with Bitcoin's halving contributing to this growth.
In practice, Bitcoin price is influenced by too many factors to conclusively prove the bullish impact of halving. For instance, looking at history, the last halving occurred on May 11, 2020, and the price increased by approximately 12% in the following week. On the other hand, today's Bitcoin price might already reflect the imminent halving.
Nevertheless, the market currently shows predominantly positive sentiment, as over the weekend, BTC/USD price rose by around 2.5%.
According to the technical analysis of the BTC/USD chart today:
→ From April 2-4, there was no downward pressure on the market to push the price below the lower boundary of the ascending channel (shown in blue), which remains relevant.
→ Conversely, a series of higher lows forming since April 2 indicates bullish intentions to break above the descending channel (shown in red).
Therefore, the approaching halving and associated positive expectations could lead to:
→ Breaking above the consolidating zone (shown with black lines).
→ Overcoming a significant resistance level near the psychological mark of $70,000 per coin.
In this scenario, the nearest target for bulls could be the median line of the blue ascending channel.
FXOpen offers the world's most popular cryptocurrency CFDs*, including Bitcoin and Ethereum. Floating spreads, 1:2 leverage — at your service. Open your trading account now or learn more about crypto CFD trading with FXOpen.
*At FXOpen UK and FXOpen AU, Cryptocurrency CFDs are only available for trading by those clients categorised as Professional clients under FCA Rules and Professional clients under AFSL 412871 – ABN 61 143 678 719 respectively. They are not available for trading by Retail clients.
CFDs are complex instruments and come with a high risk of losing your money.
This article represents the opinion of the Companies operating under the FXOpen brand only. It is not to be construed as an offer, solicitation, or recommendation with respect to products and services provided by the Companies operating under the FXOpen brand, nor is it to be considered financial advice.
👍3
#marketanalysis #MarketNews #inflation
The Market Is Waiting for Inflation Values in the US
Tomorrow one of the most significant events of the week will take place, which can greatly affect the sentiment of participants in both the currency and stock markets - at 15:30 GMT+3 inflation data will be published, namely: the values of the CPI (Consumer Price Index) and Core indices CPI.
According to ForexFactory, analysts expect the following values:
→ Core consumer price index, excluding food and energy prices, (Core CPI) in monthly terms: forecast = 0.3%, previous value = 0.4%
→ Consumer Price Index (CPI) in monthly terms – similar: forecast = 0.3%, previous value = 0.4%.
→ CPI in annual terms: forecast = 3.4%, previous value = 3.2%.
The Fed's inflation target is 2%. The values that will be published tomorrow may greatly affect market participants' expectations regarding the Fed's monetary policy.
According to the CME FedWatch tool:
→ traders are confident that the Fed will leave the rate unchanged in May;
→ the probability that the Fed will cut rates in June is just over 50%. But if the CPI indicates that inflation is stable, the likelihood will likely decrease.
Minneapolis Fed President Neel Kashkari said last week that a Fed rate cut was not a possible scenario if inflation continued to move sideways. George Lagarias, chief economist at Mazars, told CNBC, "I wouldn't be surprised if we see smaller rate cuts by the end of the year."
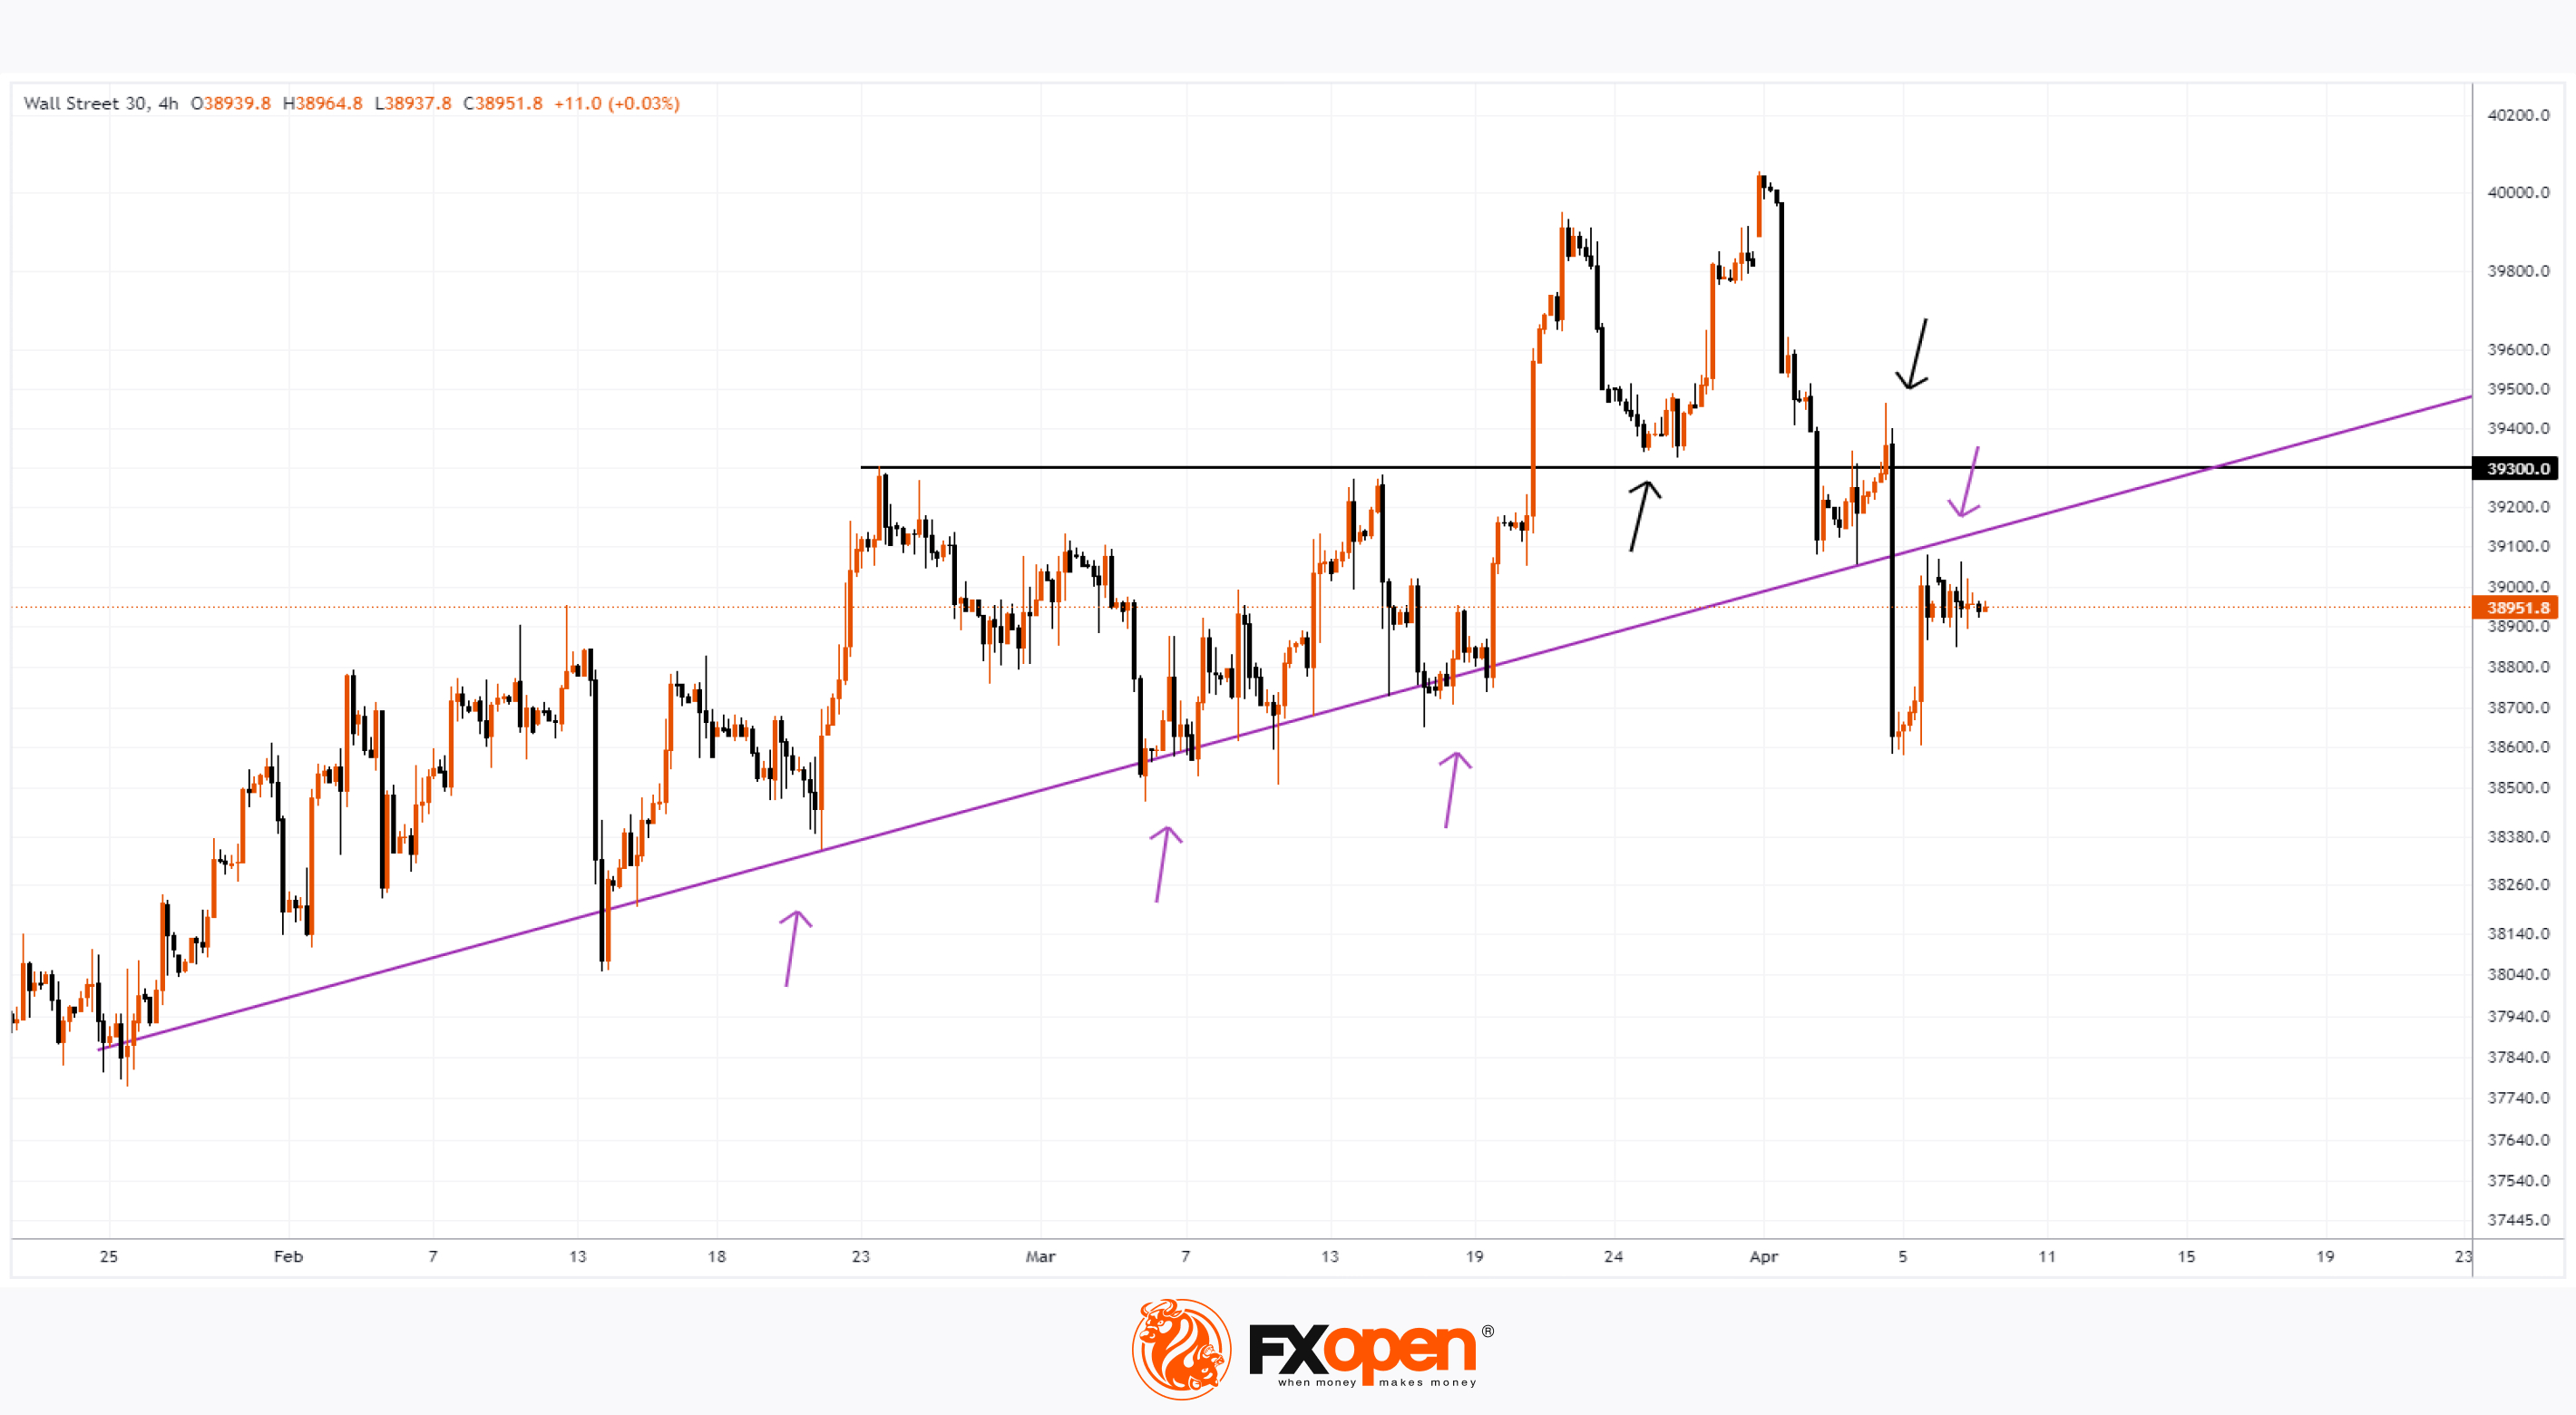
As the chart of the Dow Jones Index (US-30) shows, today the mood in the stock market can be described as cautious, since:
→ The 39,300 level, which served as support at the end of March, acts as resistance in April (shown in black).
→ The trend line, which has served as support since February, also changed its role to resistance (shown in purple).
It is possible that high CPI readings will cause the price of US-30 to decline further as market participants increase confidence that the Fed will continue to pursue tight policies to curb inflation for longer.
Trade global index CFDs with zero commission and tight spreads. Open your FXOpen account now or learn more about trading index CFDs with FXOpen.
CFDs are complex instruments and come with a high risk of losing your money.
This article represents the opinion of the Companies operating under the FXOpen brand only. It is not to be construed as an offer, solicitation, or recommendation with respect to products and services provided by the Companies operating under the FXOpen brand, nor is it to be considered financial advice.
The Market Is Waiting for Inflation Values in the US
Tomorrow one of the most significant events of the week will take place, which can greatly affect the sentiment of participants in both the currency and stock markets - at 15:30 GMT+3 inflation data will be published, namely: the values of the CPI (Consumer Price Index) and Core indices CPI.
According to ForexFactory, analysts expect the following values:
→ Core consumer price index, excluding food and energy prices, (Core CPI) in monthly terms: forecast = 0.3%, previous value = 0.4%
→ Consumer Price Index (CPI) in monthly terms – similar: forecast = 0.3%, previous value = 0.4%.
→ CPI in annual terms: forecast = 3.4%, previous value = 3.2%.
The Fed's inflation target is 2%. The values that will be published tomorrow may greatly affect market participants' expectations regarding the Fed's monetary policy.
According to the CME FedWatch tool:
→ traders are confident that the Fed will leave the rate unchanged in May;
→ the probability that the Fed will cut rates in June is just over 50%. But if the CPI indicates that inflation is stable, the likelihood will likely decrease.
Minneapolis Fed President Neel Kashkari said last week that a Fed rate cut was not a possible scenario if inflation continued to move sideways. George Lagarias, chief economist at Mazars, told CNBC, "I wouldn't be surprised if we see smaller rate cuts by the end of the year."
As the chart of the Dow Jones Index (US-30) shows, today the mood in the stock market can be described as cautious, since:
→ The 39,300 level, which served as support at the end of March, acts as resistance in April (shown in black).
→ The trend line, which has served as support since February, also changed its role to resistance (shown in purple).
It is possible that high CPI readings will cause the price of US-30 to decline further as market participants increase confidence that the Fed will continue to pursue tight policies to curb inflation for longer.
Trade global index CFDs with zero commission and tight spreads. Open your FXOpen account now or learn more about trading index CFDs with FXOpen.
CFDs are complex instruments and come with a high risk of losing your money.
This article represents the opinion of the Companies operating under the FXOpen brand only. It is not to be construed as an offer, solicitation, or recommendation with respect to products and services provided by the Companies operating under the FXOpen brand, nor is it to be considered financial advice.
👍2
#marketanalysis #MarketNews #forextrading
NZD/USD Rate Increases after the Decision of the Reserve Bank of New Zealand
This morning the Reserve Bank of New Zealand (RBNZ) decided to keep interest rates unchanged at 5.5%:
→ the decision to keep the interest rate at this high level is made for the sixth time in a row;
→ the RBNZ said rates should remain high for some time to ensure inflation is contained;
→ this decision was expected - all 25 economists in the Bloomberg survey predicted it.
However, New Zealand's economy is in recession, with GDP contracting in four of the last five quarters — prompting market participants to speculate that the central bank will begin cutting rates in the second half of this year.
The market reaction was a slight strengthening of the New Zealand dollar. Thus, the NZD/USD rate today rose to its April high.
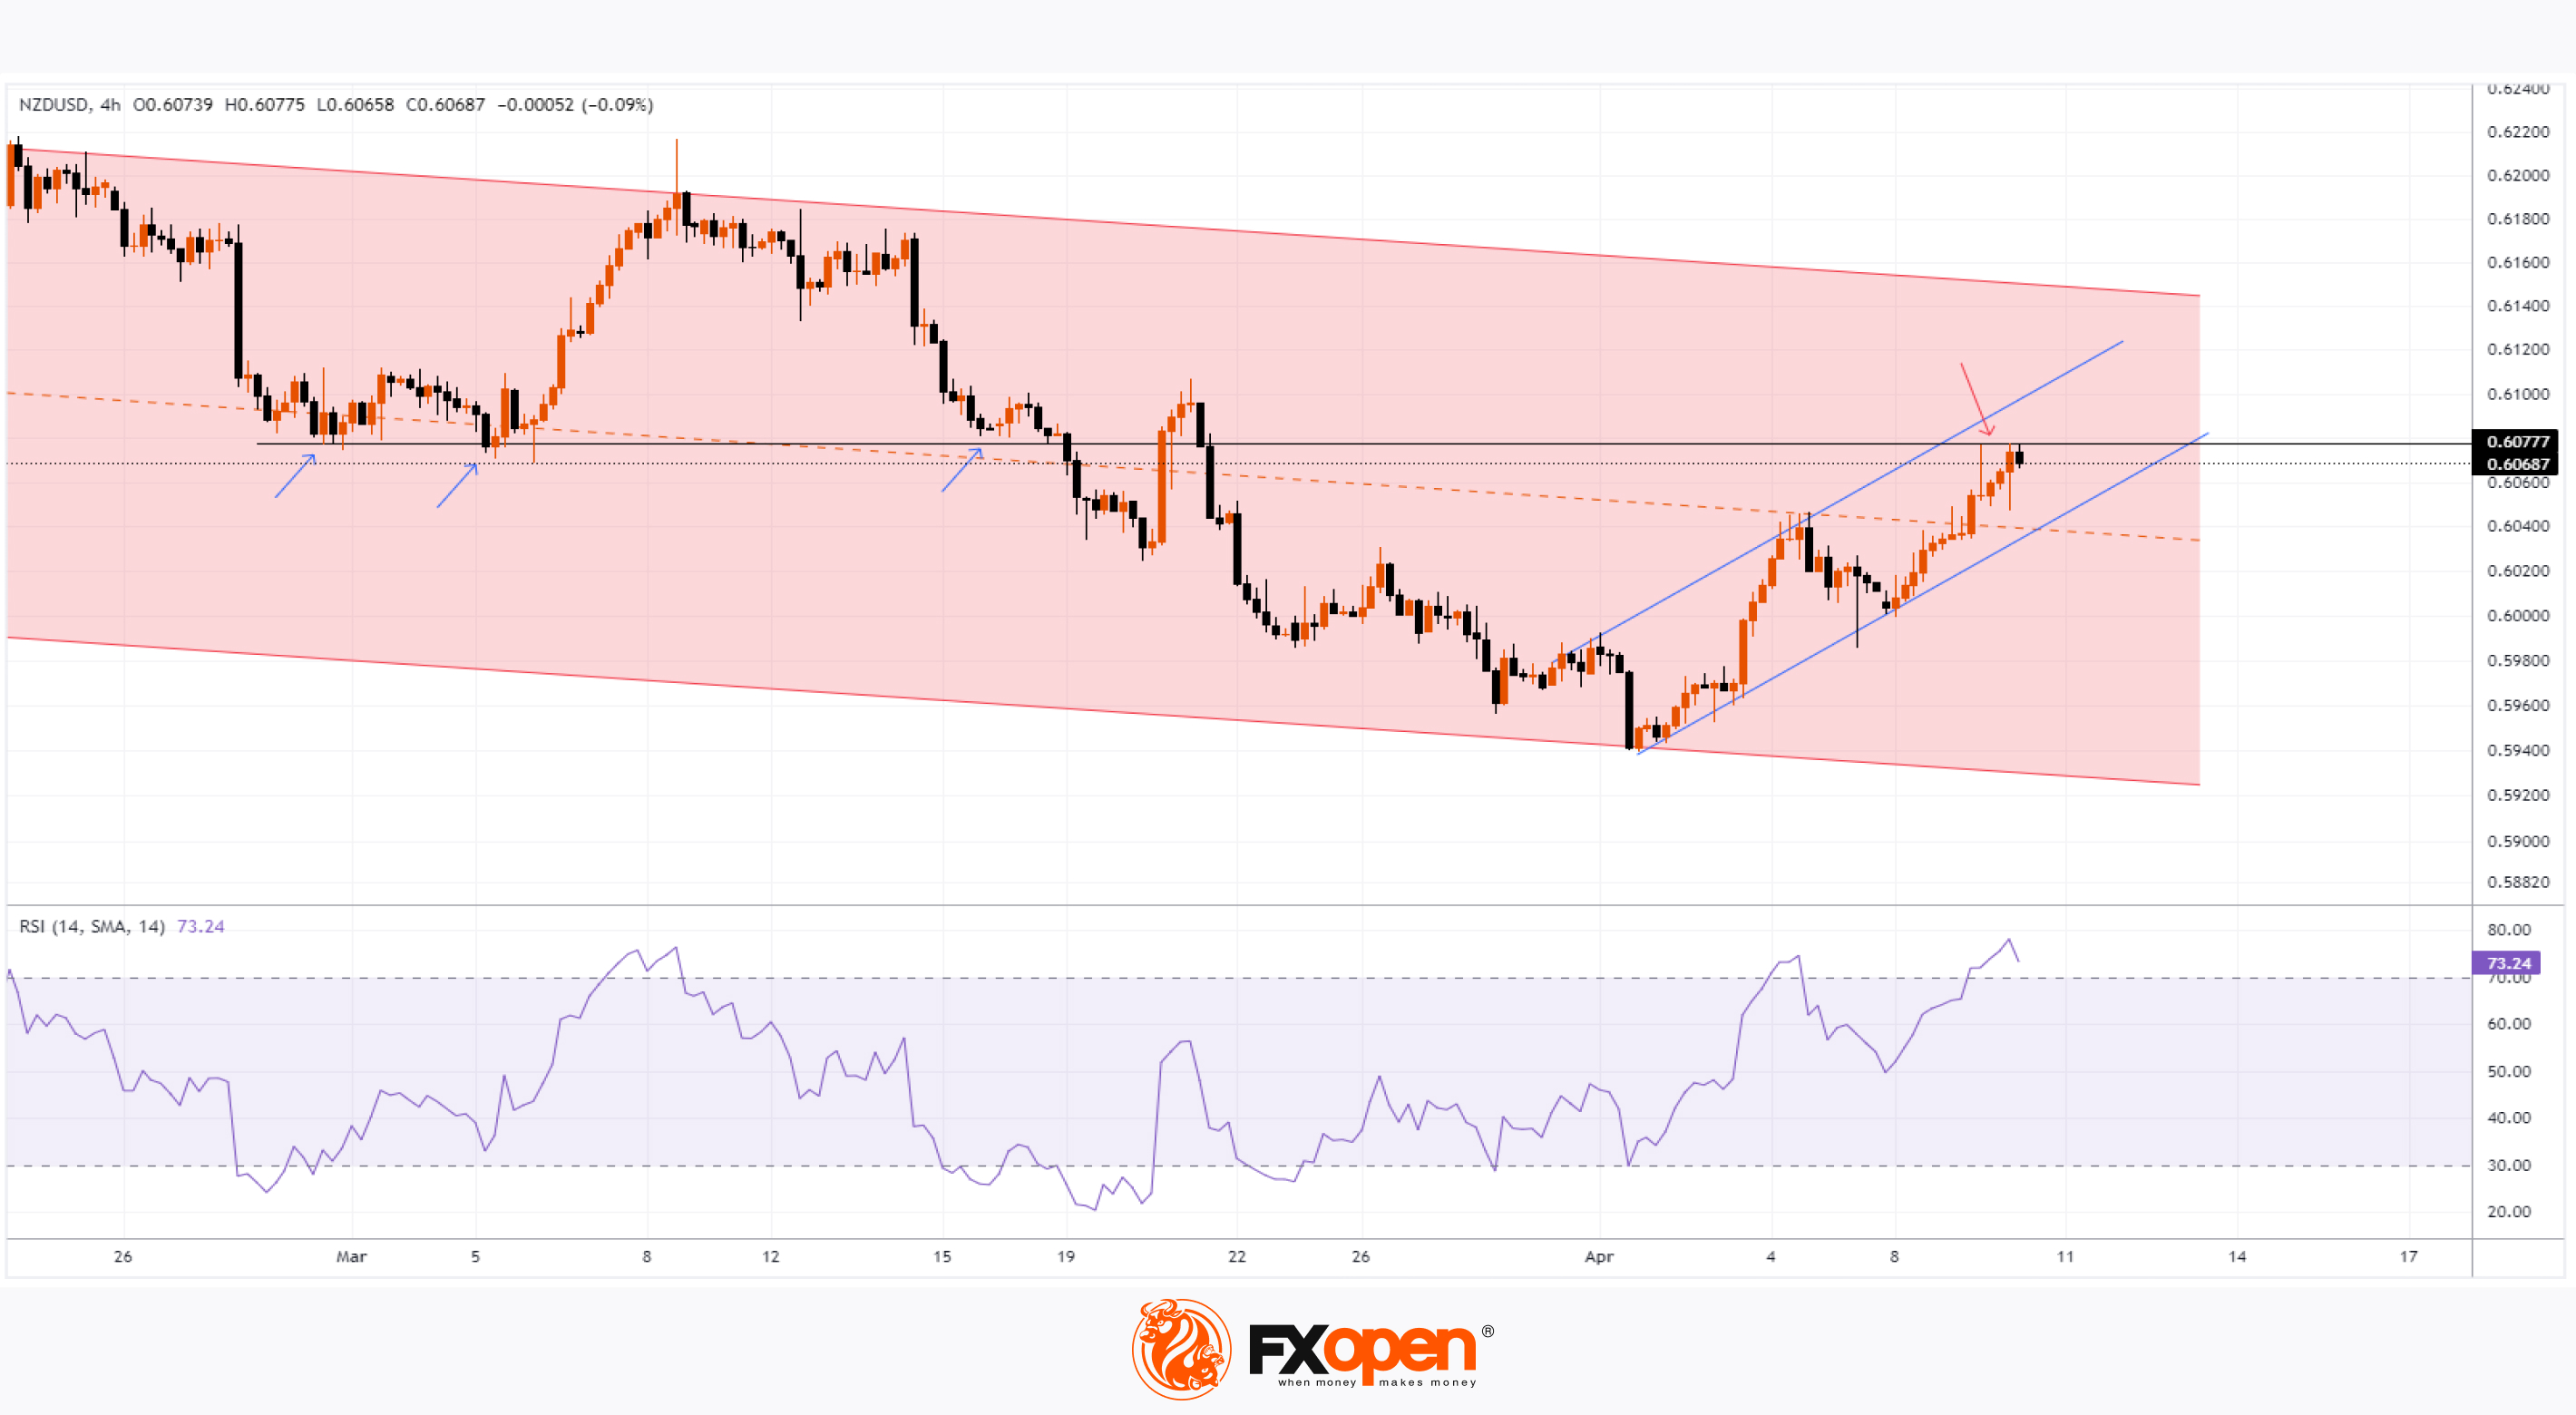
Technical analysis of the NZD/USD chart today shows that:
→ in 2024, there is some preponderance on the bearish side of the market, which is expressed by the formation of a downward channel (shown in red);
→ starting from the first of April, an upward impulse was formed (shown by blue lines), which allowed the price of NZD/USD to rise from the low of the year and reach the upper half of the red channel;
The level 0.60777 looks like current resistance, since it:
→ previously provided support (shown by blue arrows);
→ acts as an obstacle to growth within the blue lines (shown by the red arrow), as evidenced by the action of the NZD/USD price on April 9-10.
At the same time, the RSI indicator is in the overbought zone.
From a technical analysis perspective, the market is vulnerable to a pullback. The further development of the dynamics of the NZD/USD exchange rate today will have an important impact (will be published at 15:30 GMT+3) on the news about the inflation level in the US, which we wrote about yesterday.
Trade over 50 forex markets 24 hours a day with FXOpen. Take advantage of low commissions, deep liquidity, and spreads from 0.0 pips. Open your FXOpen account now or learn more about trading forex with FXOpen.
CFDs are complex instruments and come with a high risk of losing your money.
This article represents the opinion of the Companies operating under the FXOpen brand only. It is not to be construed as an offer, solicitation, or recommendation with respect to products and services provided by the Companies operating under the FXOpen brand, nor is it to be considered financial advice.
NZD/USD Rate Increases after the Decision of the Reserve Bank of New Zealand
This morning the Reserve Bank of New Zealand (RBNZ) decided to keep interest rates unchanged at 5.5%:
→ the decision to keep the interest rate at this high level is made for the sixth time in a row;
→ the RBNZ said rates should remain high for some time to ensure inflation is contained;
→ this decision was expected - all 25 economists in the Bloomberg survey predicted it.
However, New Zealand's economy is in recession, with GDP contracting in four of the last five quarters — prompting market participants to speculate that the central bank will begin cutting rates in the second half of this year.
The market reaction was a slight strengthening of the New Zealand dollar. Thus, the NZD/USD rate today rose to its April high.
Technical analysis of the NZD/USD chart today shows that:
→ in 2024, there is some preponderance on the bearish side of the market, which is expressed by the formation of a downward channel (shown in red);
→ starting from the first of April, an upward impulse was formed (shown by blue lines), which allowed the price of NZD/USD to rise from the low of the year and reach the upper half of the red channel;
The level 0.60777 looks like current resistance, since it:
→ previously provided support (shown by blue arrows);
→ acts as an obstacle to growth within the blue lines (shown by the red arrow), as evidenced by the action of the NZD/USD price on April 9-10.
At the same time, the RSI indicator is in the overbought zone.
From a technical analysis perspective, the market is vulnerable to a pullback. The further development of the dynamics of the NZD/USD exchange rate today will have an important impact (will be published at 15:30 GMT+3) on the news about the inflation level in the US, which we wrote about yesterday.
Trade over 50 forex markets 24 hours a day with FXOpen. Take advantage of low commissions, deep liquidity, and spreads from 0.0 pips. Open your FXOpen account now or learn more about trading forex with FXOpen.
CFDs are complex instruments and come with a high risk of losing your money.
This article represents the opinion of the Companies operating under the FXOpen brand only. It is not to be construed as an offer, solicitation, or recommendation with respect to products and services provided by the Companies operating under the FXOpen brand, nor is it to be considered financial advice.
👍2
#marketanalysis #cryptonews #crypto
ADA Drops to Last Place in the Top 10 Cryptocurrencies
ADA, the native blockchain token of the Cardano network, has dropped to 10th place among the cryptocurrencies with the largest capitalization. Today, according to CoinMarketCap, the capitalization of Cardano (ADA) is USD 20.7 billion.
On the one hand, this happened due to the success of such competitors as:
→ Dogecoin (DOGE) with a capitalization of USD 27.1 billion, approximately +108% since the beginning of the year;
→ Toncoin (TON) with a capitalization of USD 23.7 billion, approximately +193% since the beginning of the year.
On the other hand, the ADA/USD rate behaves weaker than other cryptocurrencies. Year to date, it has dropped by several percent since January 1, 2024. And this is against the background of a bull market, which should greatly confuse investors.
Will Cardano (ADA) be able to strengthen its position in the top 10 cryptocurrencies?
Bulls' hopes may be tied to the approaching Chang update (expected in the second quarter of 2024), which will implement the concept of a self-governing community on the blockchain by introducing delegate representatives (DReps) and community voting to approve the first draft of the Cardano Constitution.
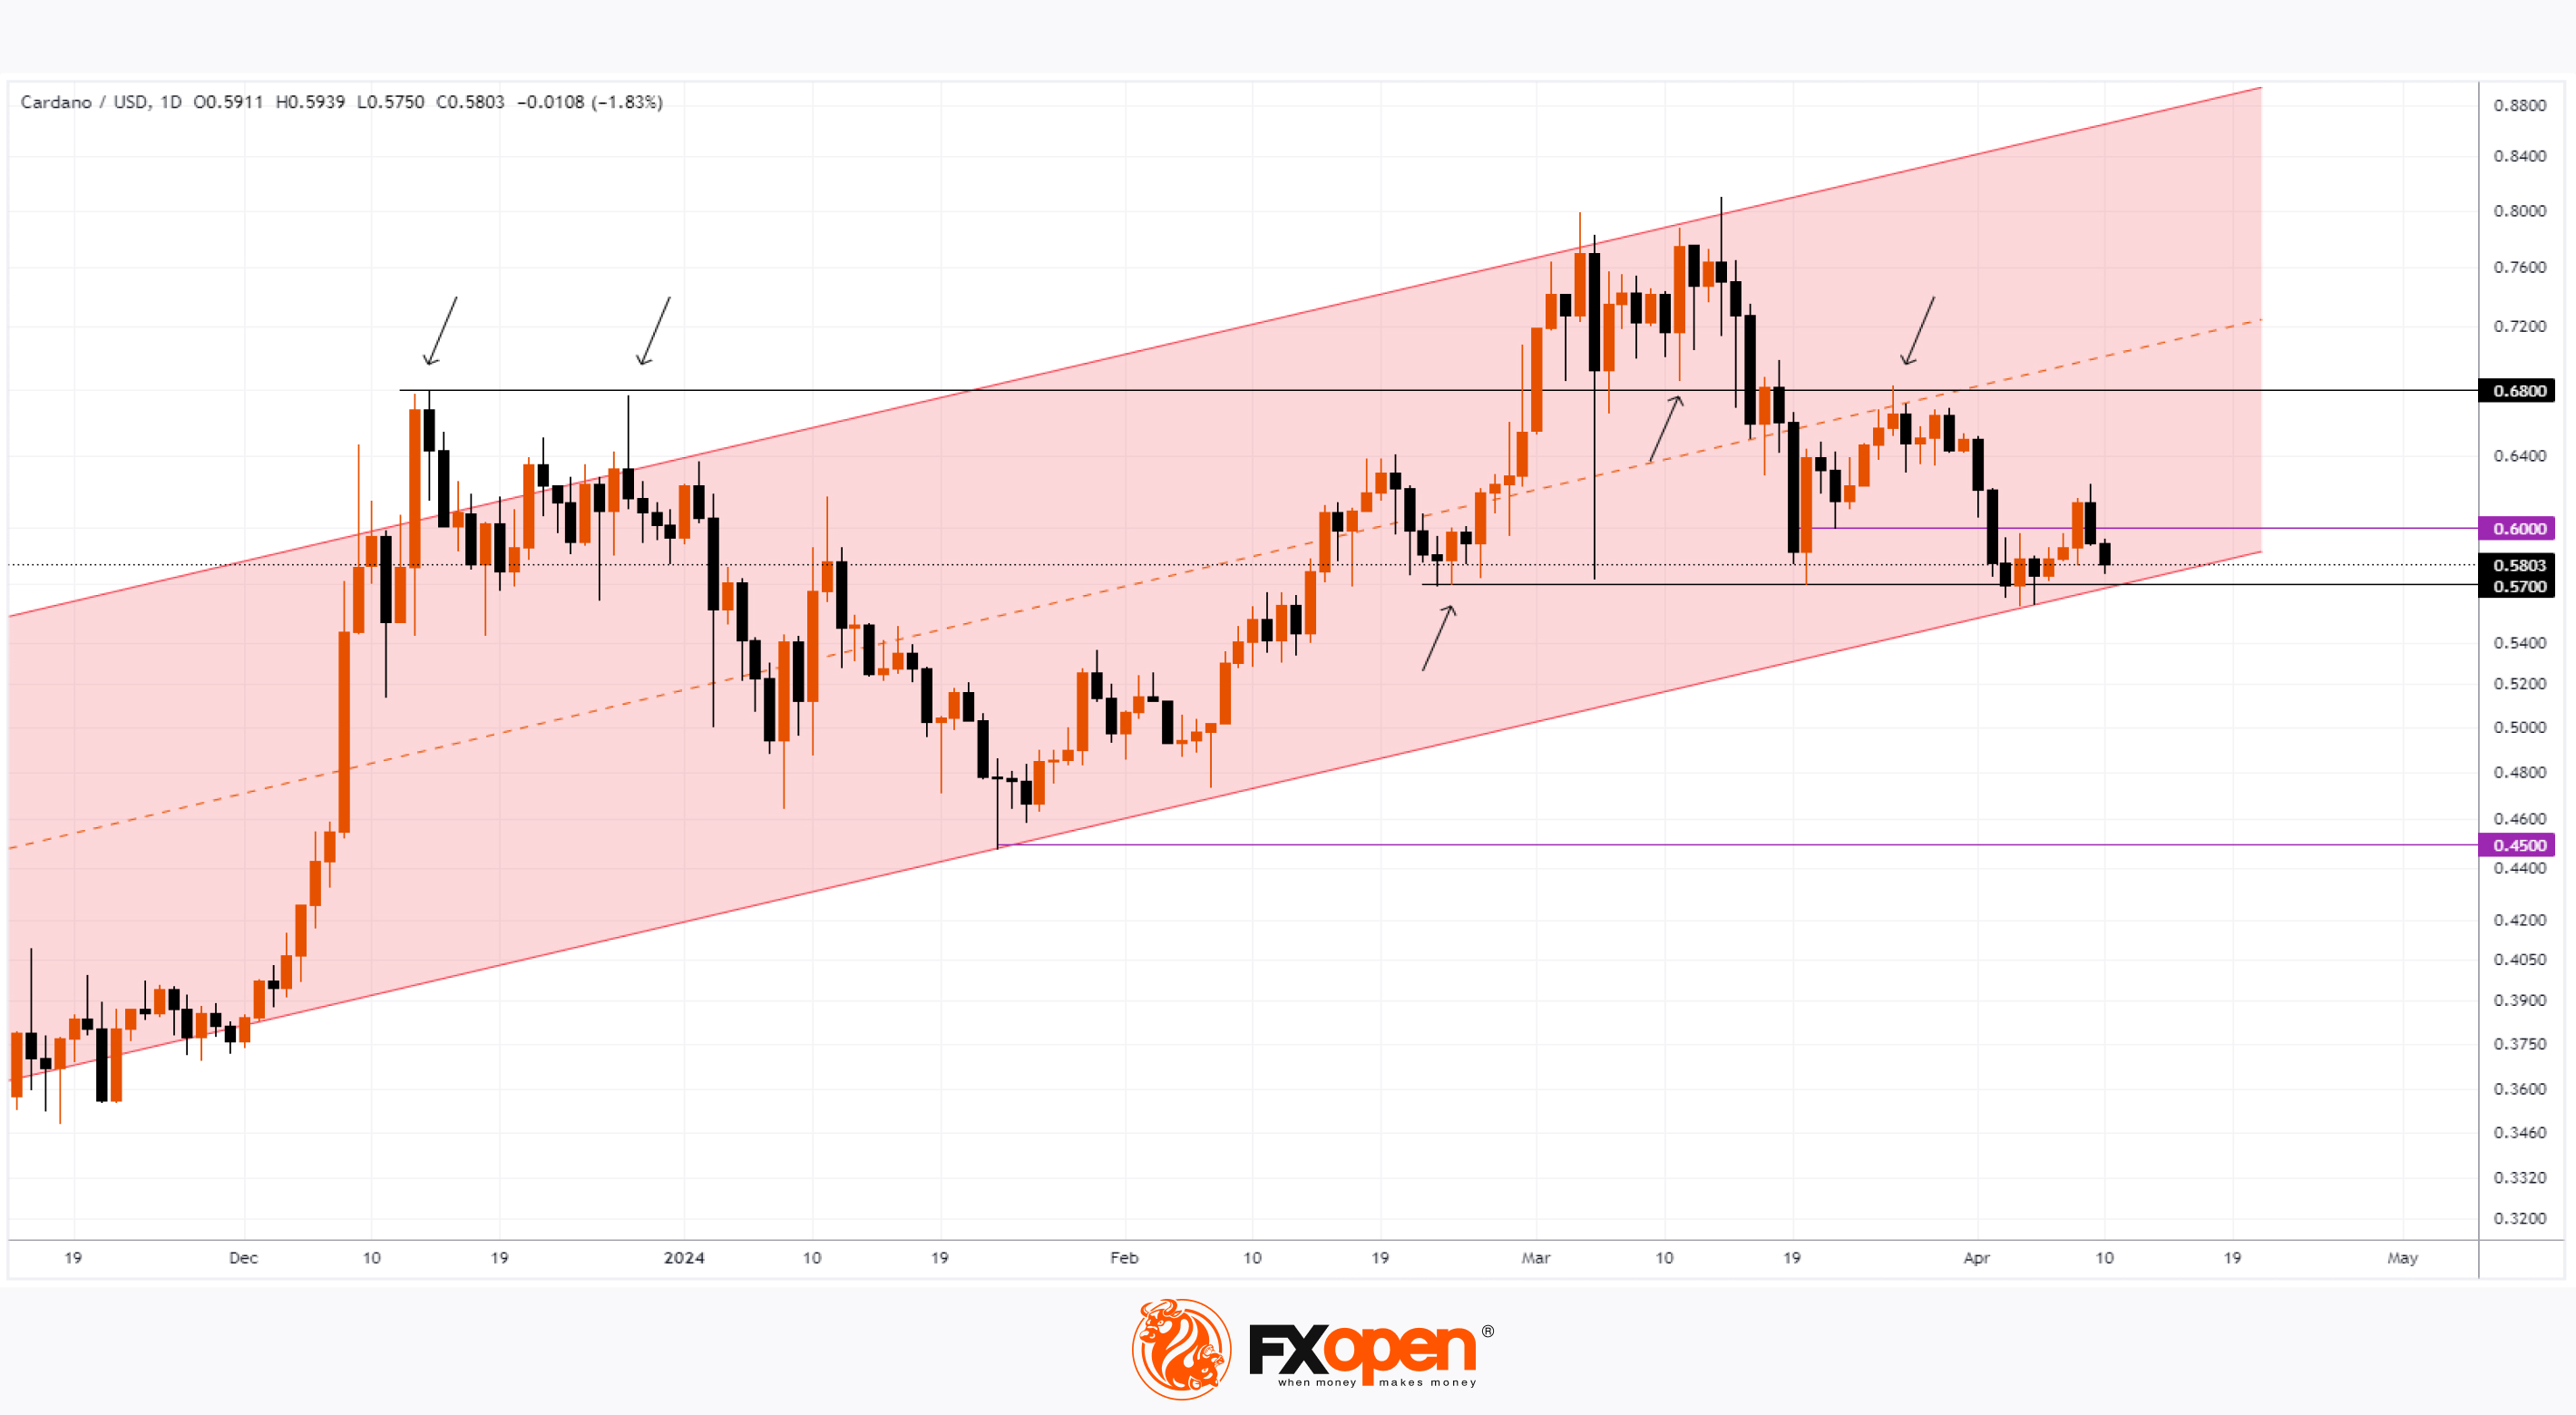
Technical analysis of the ADA/USD chart today shows more bearish signals:
→ the price of ADA/USD moves within the ascending channel;
→ the important level USD 0.6800 again acts as resistance (as shown by the arrows);
→ the price tried to push off from the lower border of the channel, but was unable to gain a foothold above the psychological level of USD 0.6000.
The level of USD 0.5700, reinforced by the lower border of the channel, acts as the most important support in such a situation - its breakdown will open the way to the psychological level of 0.5000 and the minimum of the year in the area of 0.4500.
Given the failure of the ADA/USD price to follow trends in the cryptocurrency bull market in early 2024, such a scenario looks likely.
FXOpen offers the world's most popular cryptocurrency CFDs*, including Bitcoin and Ethereum. Floating spreads, 1:2 leverage — at your service. Open your trading account now or learn more about crypto CFD trading with FXOpen.
*At FXOpen UK and FXOpen AU, Cryptocurrency CFDs are only available for trading by those clients categorised as Professional clients under FCA Rules and Professional clients under AFSL 412871 – ABN 61 143 678 719 respectively. They are not available for trading by Retail clients.
CFDs are complex instruments and come with a high risk of losing your money.
This article represents the opinion of the Companies operating under the FXOpen brand only. It is not to be construed as an offer, solicitation, or recommendation with respect to products and services provided by the Companies operating under the FXOpen brand, nor is it to be considered financial advice.
ADA Drops to Last Place in the Top 10 Cryptocurrencies
ADA, the native blockchain token of the Cardano network, has dropped to 10th place among the cryptocurrencies with the largest capitalization. Today, according to CoinMarketCap, the capitalization of Cardano (ADA) is USD 20.7 billion.
On the one hand, this happened due to the success of such competitors as:
→ Dogecoin (DOGE) with a capitalization of USD 27.1 billion, approximately +108% since the beginning of the year;
→ Toncoin (TON) with a capitalization of USD 23.7 billion, approximately +193% since the beginning of the year.
On the other hand, the ADA/USD rate behaves weaker than other cryptocurrencies. Year to date, it has dropped by several percent since January 1, 2024. And this is against the background of a bull market, which should greatly confuse investors.
Will Cardano (ADA) be able to strengthen its position in the top 10 cryptocurrencies?
Bulls' hopes may be tied to the approaching Chang update (expected in the second quarter of 2024), which will implement the concept of a self-governing community on the blockchain by introducing delegate representatives (DReps) and community voting to approve the first draft of the Cardano Constitution.
Technical analysis of the ADA/USD chart today shows more bearish signals:
→ the price of ADA/USD moves within the ascending channel;
→ the important level USD 0.6800 again acts as resistance (as shown by the arrows);
→ the price tried to push off from the lower border of the channel, but was unable to gain a foothold above the psychological level of USD 0.6000.
The level of USD 0.5700, reinforced by the lower border of the channel, acts as the most important support in such a situation - its breakdown will open the way to the psychological level of 0.5000 and the minimum of the year in the area of 0.4500.
Given the failure of the ADA/USD price to follow trends in the cryptocurrency bull market in early 2024, such a scenario looks likely.
FXOpen offers the world's most popular cryptocurrency CFDs*, including Bitcoin and Ethereum. Floating spreads, 1:2 leverage — at your service. Open your trading account now or learn more about crypto CFD trading with FXOpen.
*At FXOpen UK and FXOpen AU, Cryptocurrency CFDs are only available for trading by those clients categorised as Professional clients under FCA Rules and Professional clients under AFSL 412871 – ABN 61 143 678 719 respectively. They are not available for trading by Retail clients.
CFDs are complex instruments and come with a high risk of losing your money.
This article represents the opinion of the Companies operating under the FXOpen brand only. It is not to be construed as an offer, solicitation, or recommendation with respect to products and services provided by the Companies operating under the FXOpen brand, nor is it to be considered financial advice.
👍2
#usdollar #inflation #marketanalysis
Inflation Data Sharply Strengthens the US Dollar
Data on consumer prices and core inflation published yesterday exceeded expectations. According to ForexFactory:
→ Core CPI in monthly terms: actual = 0.4%, expected = 0.3%, a month ago = 0.4%;
→ CPI in annual terms: actual = 3.5%, forecast was = 3.4%, previous value = 3.2% with a target value of 2%.
As a result of the publication of news, market participants' expectations that the Federal Reserve will leave rates unchanged in June have sharply increased. According to the CME FedWatch Tool, before the publication of news about inflation, the probability of this was = 42.6% (that is, the majority believed that there would be a rate cut), then after the publication the probability = 83.0%. This is a dramatic change in sentiment.
Speaking to Bloomberg, former US Treasury Secretary Larry Summers said cutting rates in June would be a dangerous and egregious mistake, adding: "You have to take seriously the possibility that the next rate move will be upwards rather than downward." .
The reaction of financial markets was the strengthening of the US dollar in the context of tight monetary policy, the effect of which will last longer:
→ USD has risen in price in currency pairs — for example, USD/CHF has risen to its maximum in six months;
→ Bitcoin fell in price, but this morning the main cryptocurrency has already recovered from yesterday’s fall;
→ gold tested support at 2,320.
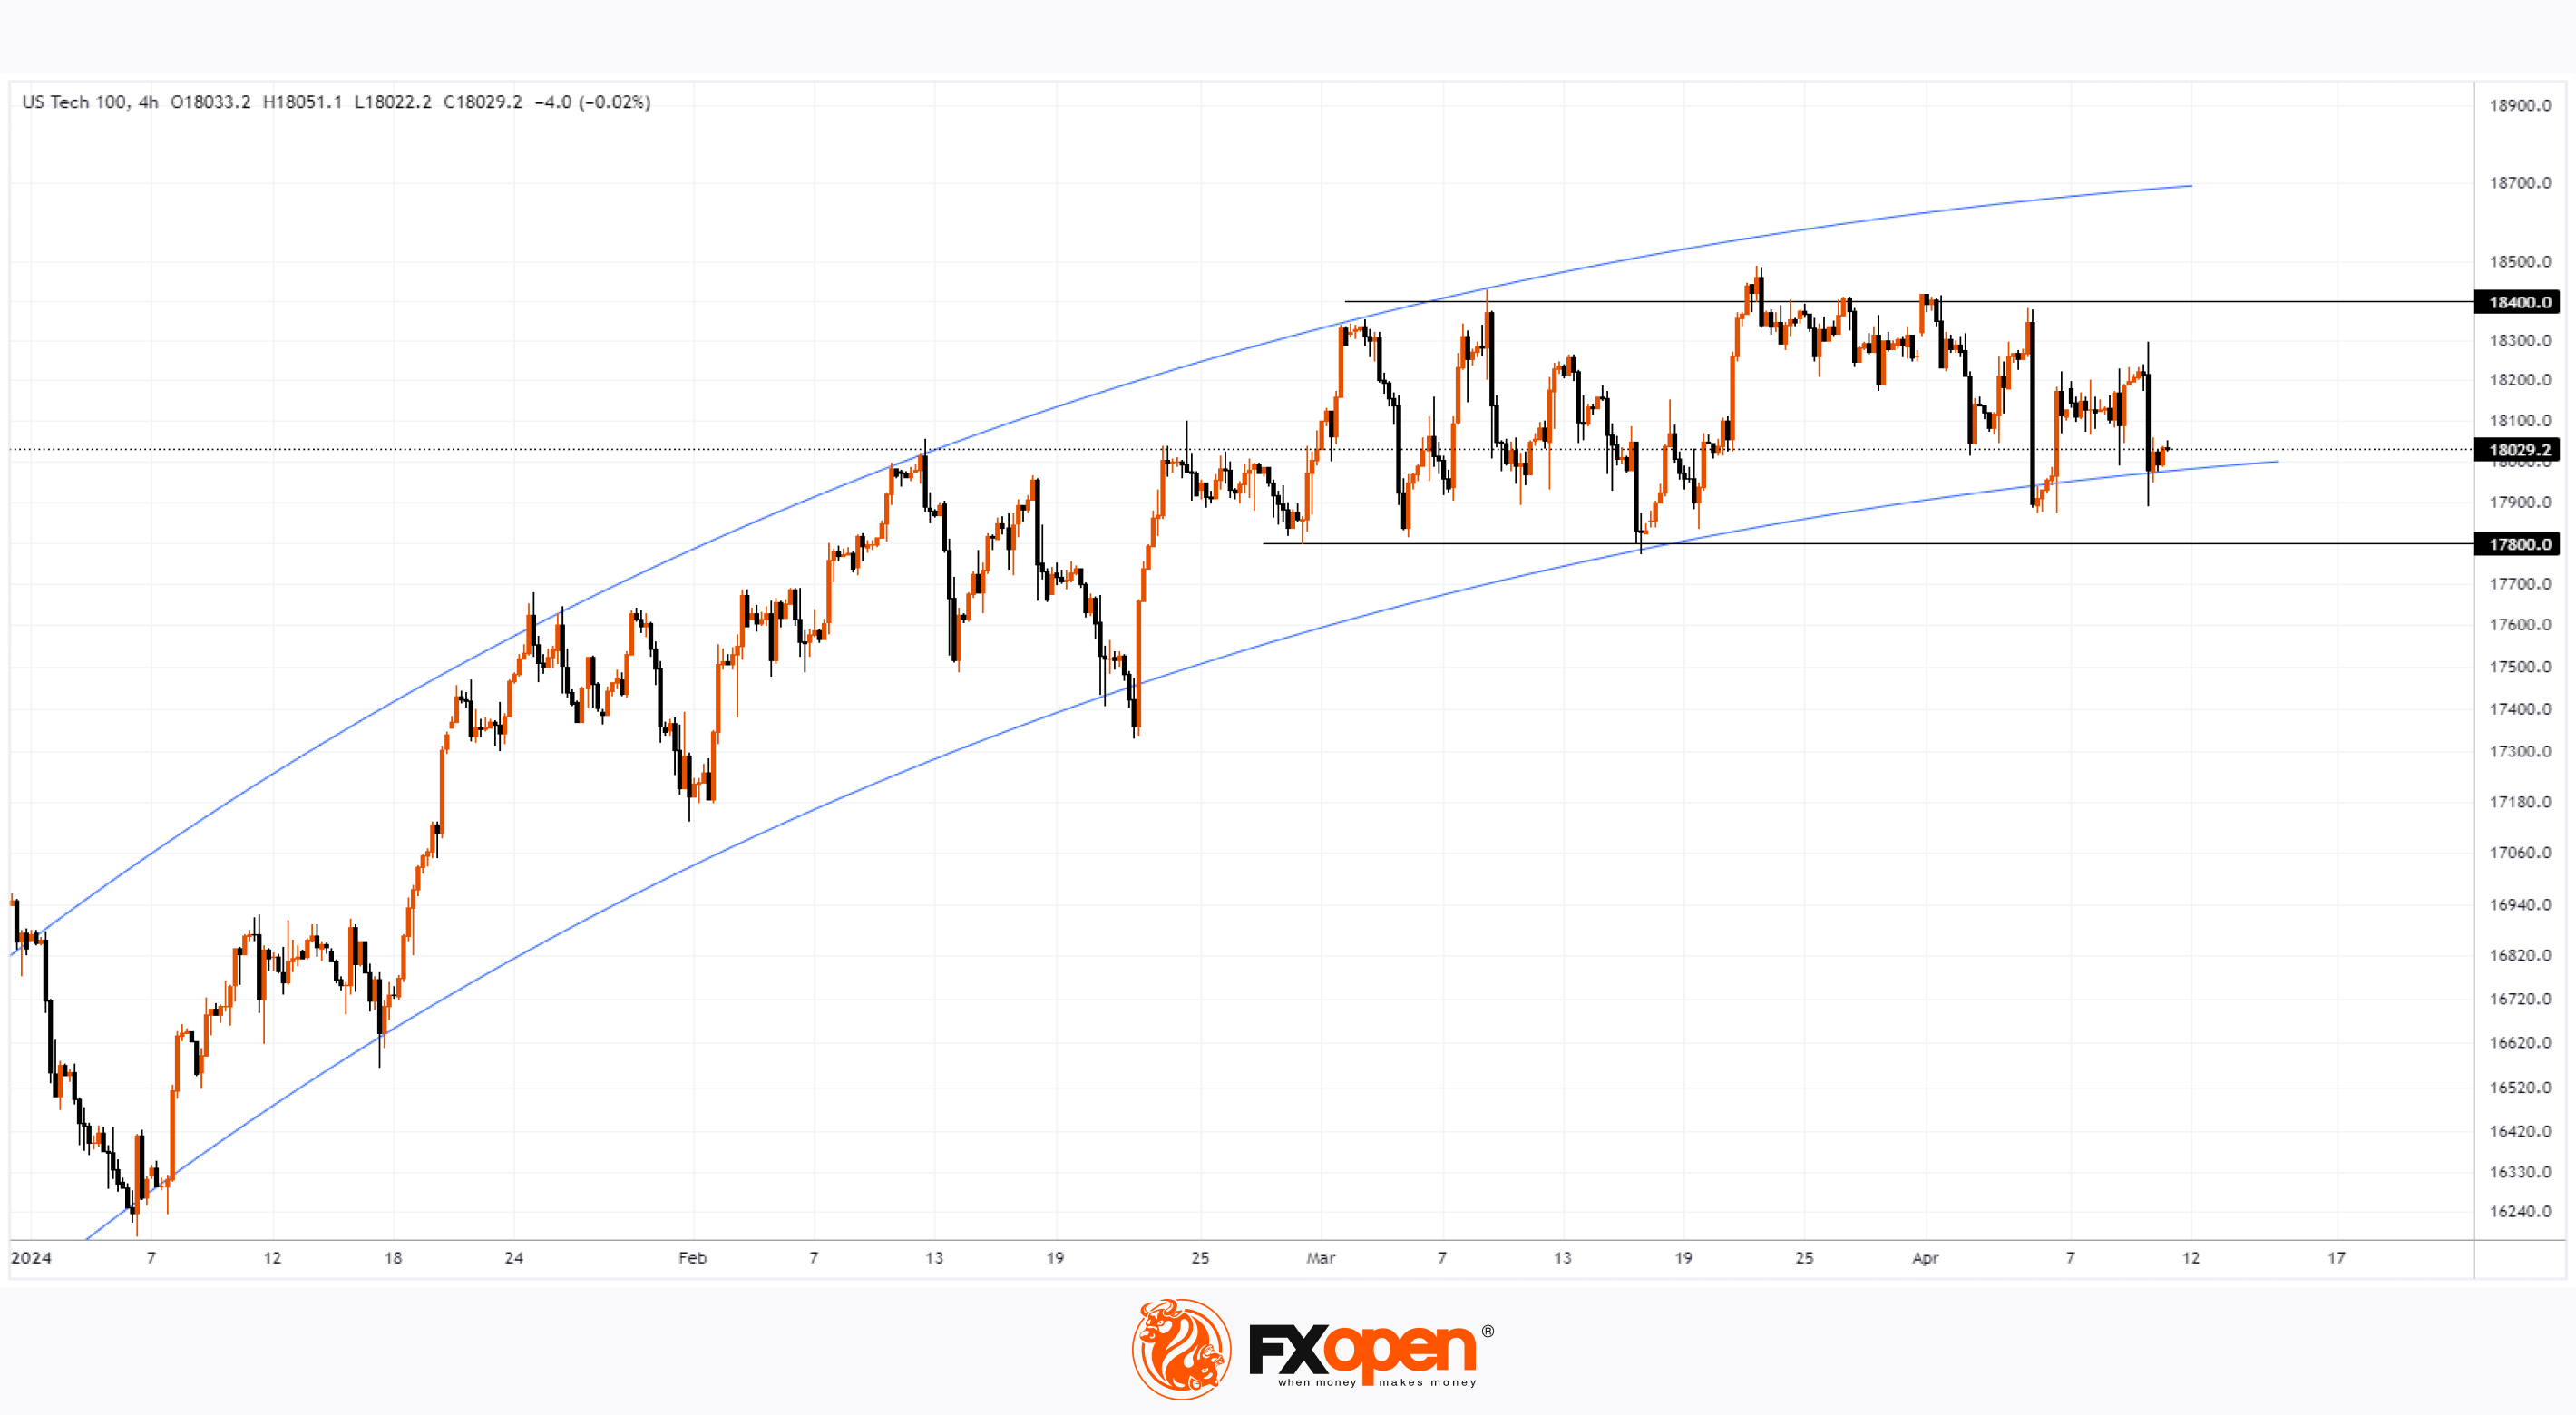
Stock markets have also come under pressure. Technical analysis of the Nasdaq-100 chart shows that:
→ the price is moving along an upward trajectory (shown by blue lines), but its rounding indicates that the forces of demand (which were largely based on expectations of lower interest rates) are being exhausted;
→ also the weakness of demand is indicated by the fact that the NASDAQ price cannot overcome the resistance of 18,400 to reach the upper blue line;
→ as a result of yesterday's news, the index dropped to the lower blue line, which acts as support.
It is possible that in the near future the market will be in consolidation between the levels of 17,800 and 18,400, shifting the focus to the beginning of the reporting season of companies for the first quarter of 2024.
Trade over 50 forex markets 24 hours a day with FXOpen. Take advantage of low commissions, deep liquidity, and spreads from 0.0 pips. Open your FXOpen account now or learn more about trading forex with FXOpen.
CFDs are complex instruments and come with a high risk of losing your money.
This article represents the opinion of the Companies operating under the FXOpen brand only. It is not to be construed as an offer, solicitation, or recommendation with respect to products and services provided by the Companies operating under the FXOpen brand, nor is it to be considered financial advice.
Inflation Data Sharply Strengthens the US Dollar
Data on consumer prices and core inflation published yesterday exceeded expectations. According to ForexFactory:
→ Core CPI in monthly terms: actual = 0.4%, expected = 0.3%, a month ago = 0.4%;
→ CPI in annual terms: actual = 3.5%, forecast was = 3.4%, previous value = 3.2% with a target value of 2%.
As a result of the publication of news, market participants' expectations that the Federal Reserve will leave rates unchanged in June have sharply increased. According to the CME FedWatch Tool, before the publication of news about inflation, the probability of this was = 42.6% (that is, the majority believed that there would be a rate cut), then after the publication the probability = 83.0%. This is a dramatic change in sentiment.
Speaking to Bloomberg, former US Treasury Secretary Larry Summers said cutting rates in June would be a dangerous and egregious mistake, adding: "You have to take seriously the possibility that the next rate move will be upwards rather than downward." .
The reaction of financial markets was the strengthening of the US dollar in the context of tight monetary policy, the effect of which will last longer:
→ USD has risen in price in currency pairs — for example, USD/CHF has risen to its maximum in six months;
→ Bitcoin fell in price, but this morning the main cryptocurrency has already recovered from yesterday’s fall;
→ gold tested support at 2,320.
Stock markets have also come under pressure. Technical analysis of the Nasdaq-100 chart shows that:
→ the price is moving along an upward trajectory (shown by blue lines), but its rounding indicates that the forces of demand (which were largely based on expectations of lower interest rates) are being exhausted;
→ also the weakness of demand is indicated by the fact that the NASDAQ price cannot overcome the resistance of 18,400 to reach the upper blue line;
→ as a result of yesterday's news, the index dropped to the lower blue line, which acts as support.
It is possible that in the near future the market will be in consolidation between the levels of 17,800 and 18,400, shifting the focus to the beginning of the reporting season of companies for the first quarter of 2024.
Trade over 50 forex markets 24 hours a day with FXOpen. Take advantage of low commissions, deep liquidity, and spreads from 0.0 pips. Open your FXOpen account now or learn more about trading forex with FXOpen.
CFDs are complex instruments and come with a high risk of losing your money.
This article represents the opinion of the Companies operating under the FXOpen brand only. It is not to be construed as an offer, solicitation, or recommendation with respect to products and services provided by the Companies operating under the FXOpen brand, nor is it to be considered financial advice.
👍2
#USDJPY #marketanalysis #MarketNews
USD/JPY Rises to Highest Since 1990
This morning the USD/JPY rate is around 153.20 yen per US dollar, which was facilitated by a sharp strengthening of the dollar against the backdrop of news about inflation in the United States. Thus, the yen weakened to levels last seen in mid-1990.
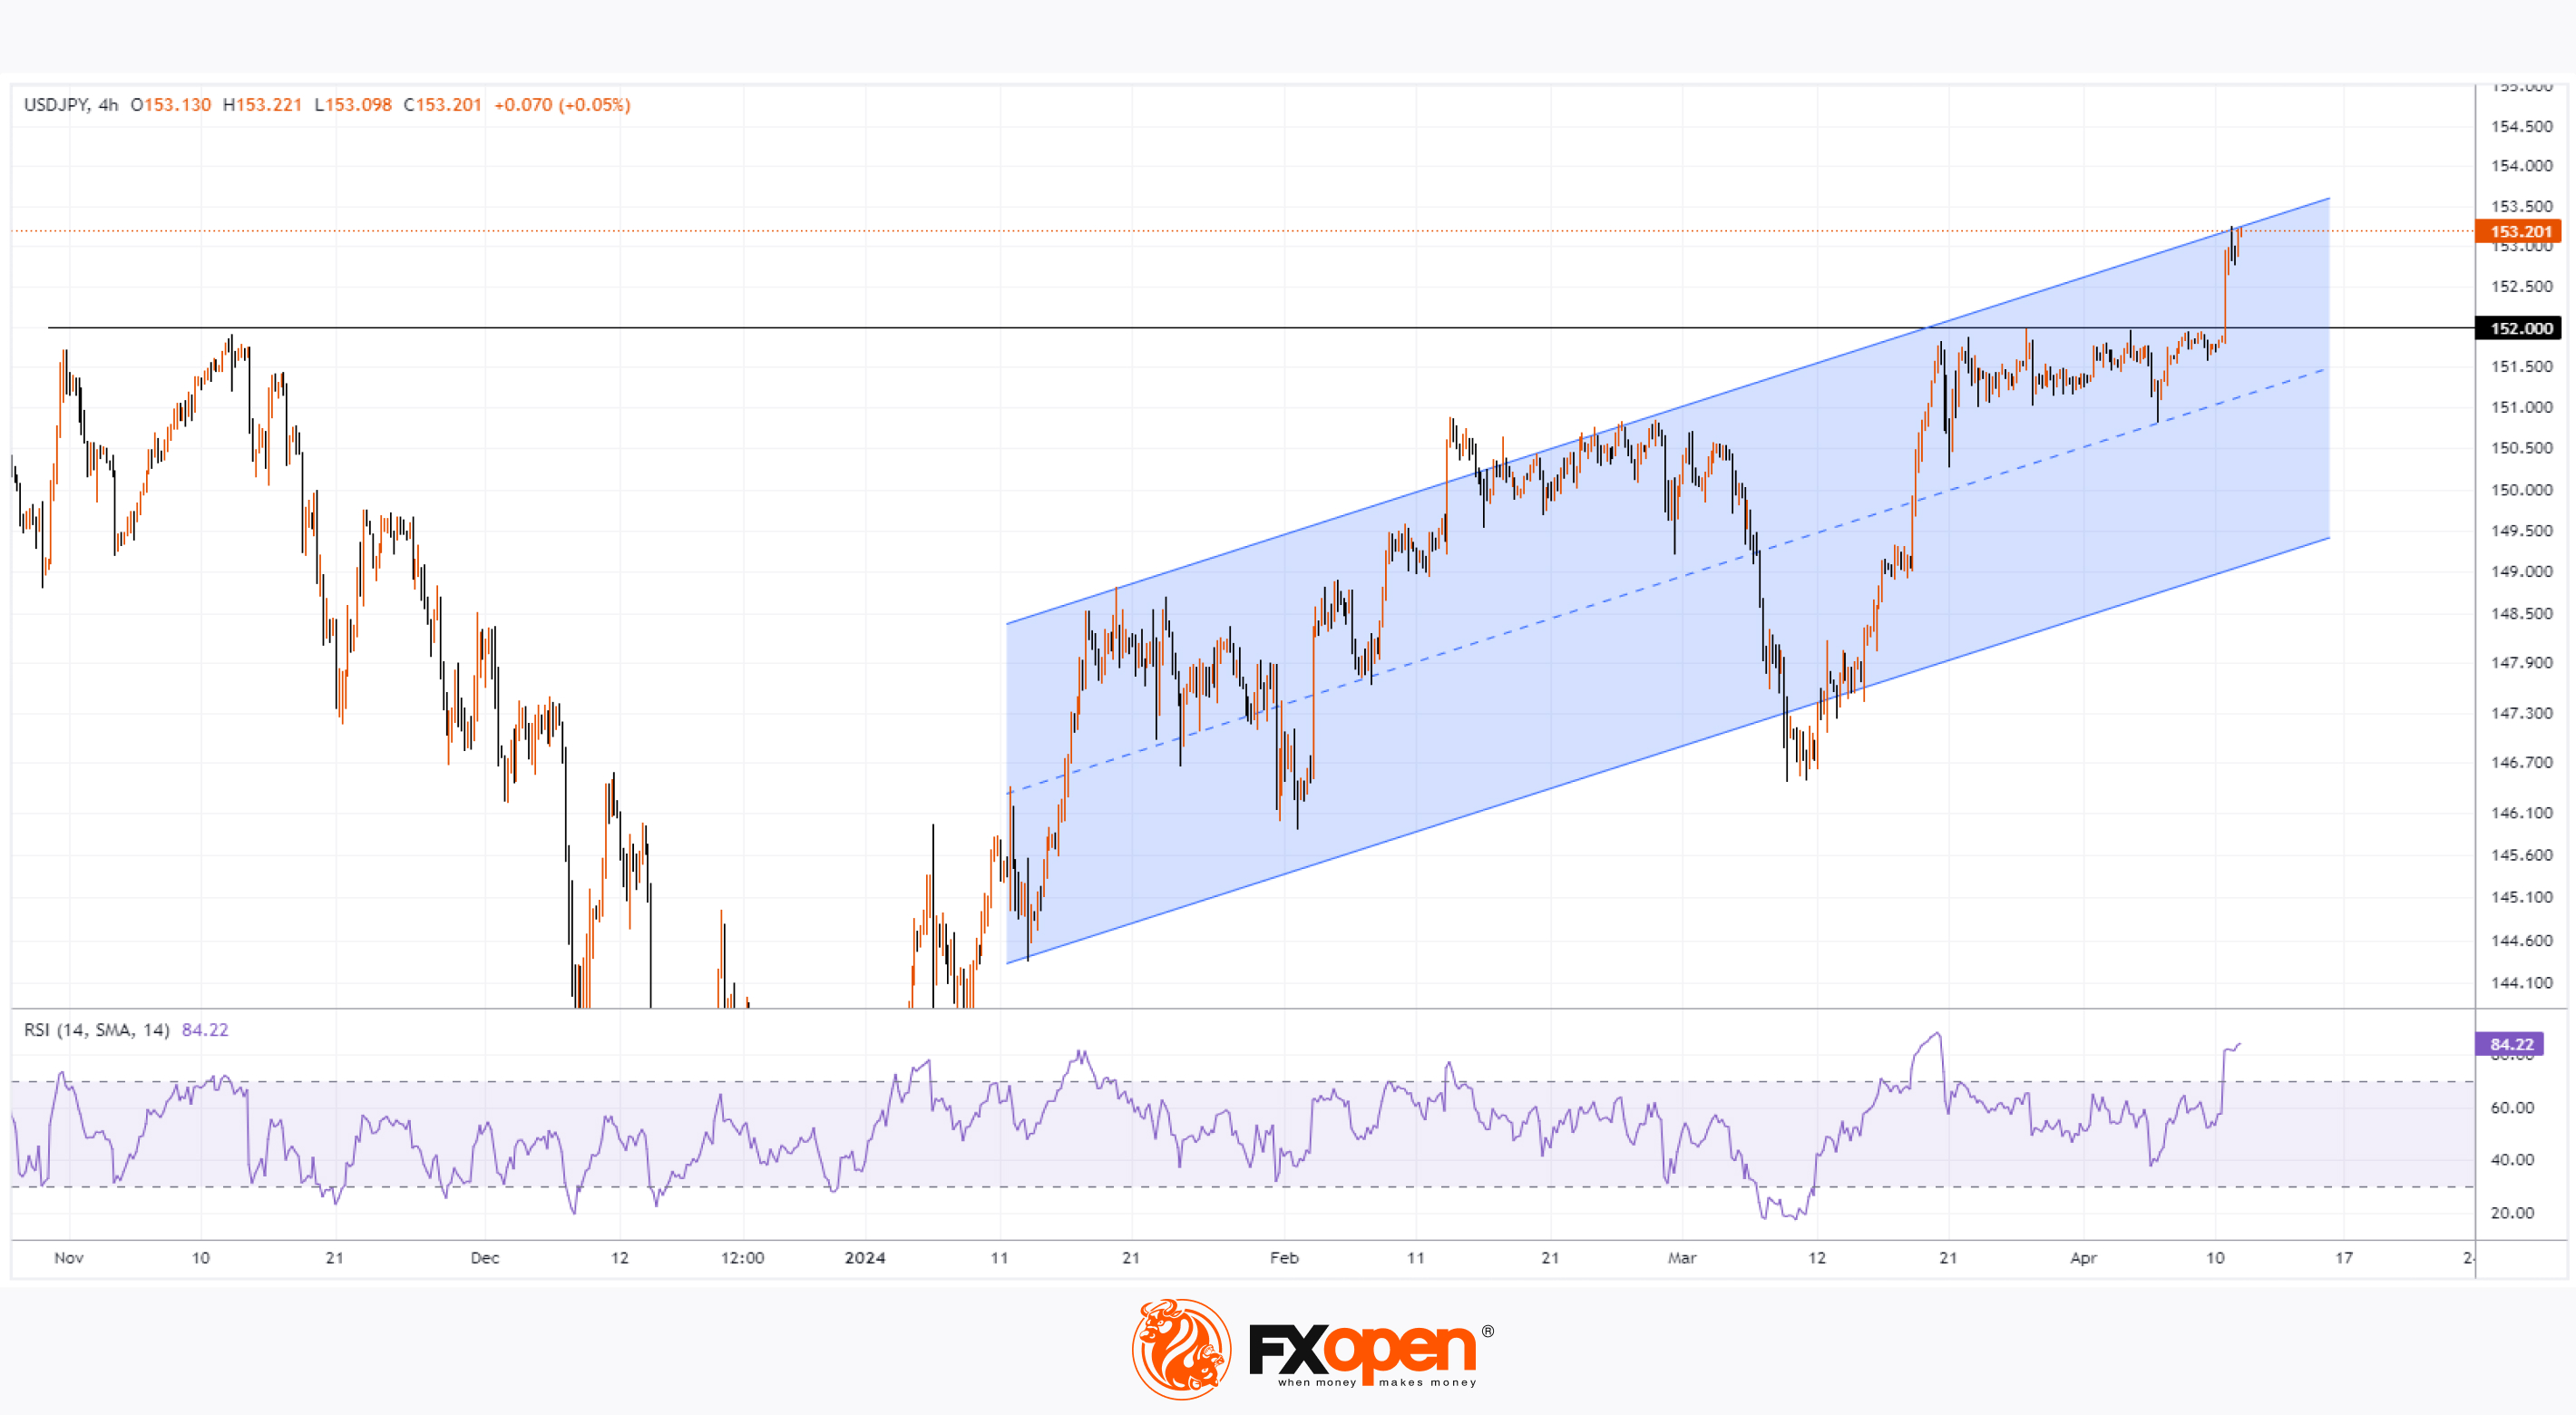
At the same time, an important event occurred — a bullish breakdown of the level of 152 yen per US dollar. This level is special due to the fact that in 2022, the weakening of the exchange rate to 152 yen per US dollar forced the Bank of Japan and the Ministry of Finance to intervene three times, as Reuters writes, to support the yen.
In 2023, it also acted as a barrier to growth. It also held back the market during March 2024 and early April.
But yesterday the level of 152 yen per US dollar did not survive.
At the same time, technical analysis of the USD/JPY chart today shows that:
→ the price has reached the upper boundary of the ascending channel (shown in blue), now it demonstrates its role as resistance;
→ the RSI indicator indicates that the market is strongly overbought.
At the same time, it can be assumed that the likelihood of interventions has increased, since the Japanese authorities, as stated earlier, do not rule out any steps to combat excessive fluctuations.
Considering what was written above, it is possible to assume that the USD/JPY rate may form a pullback after a strong bullish impulse, and the level of 152 looks like new support.
Trade over 50 forex markets 24 hours a day with FXOpen. Take advantage of low commissions, deep liquidity, and spreads from 0.0 pips. Open your FXOpen account now or learn more about trading forex with FXOpen.
CFDs are complex instruments and come with a high risk of losing your money.
This article represents the opinion of the Companies operating under the FXOpen brand only. It is not to be construed as an offer, solicitation, or recommendation with respect to products and services provided by the Companies operating under the FXOpen brand, nor is it to be considered financial advice.
USD/JPY Rises to Highest Since 1990
This morning the USD/JPY rate is around 153.20 yen per US dollar, which was facilitated by a sharp strengthening of the dollar against the backdrop of news about inflation in the United States. Thus, the yen weakened to levels last seen in mid-1990.
At the same time, an important event occurred — a bullish breakdown of the level of 152 yen per US dollar. This level is special due to the fact that in 2022, the weakening of the exchange rate to 152 yen per US dollar forced the Bank of Japan and the Ministry of Finance to intervene three times, as Reuters writes, to support the yen.
In 2023, it also acted as a barrier to growth. It also held back the market during March 2024 and early April.
But yesterday the level of 152 yen per US dollar did not survive.
At the same time, technical analysis of the USD/JPY chart today shows that:
→ the price has reached the upper boundary of the ascending channel (shown in blue), now it demonstrates its role as resistance;
→ the RSI indicator indicates that the market is strongly overbought.
At the same time, it can be assumed that the likelihood of interventions has increased, since the Japanese authorities, as stated earlier, do not rule out any steps to combat excessive fluctuations.
Considering what was written above, it is possible to assume that the USD/JPY rate may form a pullback after a strong bullish impulse, and the level of 152 looks like new support.
Trade over 50 forex markets 24 hours a day with FXOpen. Take advantage of low commissions, deep liquidity, and spreads from 0.0 pips. Open your FXOpen account now or learn more about trading forex with FXOpen.
CFDs are complex instruments and come with a high risk of losing your money.
This article represents the opinion of the Companies operating under the FXOpen brand only. It is not to be construed as an offer, solicitation, or recommendation with respect to products and services provided by the Companies operating under the FXOpen brand, nor is it to be considered financial advice.
👍3
#sp500 #stockmarket #stocktrading #MarketNews
S&P 500 Price Consolidates ahead of Earnings Season
On April 4, we wrote that the S&P 500 is showing signs of weakness around the 5,250 level. How is the situation on the stock market developing by today, which is the start of the reporting season for the first quarter?
The S&P 500 fell sharply on Wednesday amid higher-than-expected inflation data.
But the S&P 500 rose yesterday after data showed producer prices rose only slightly in March.
According to Forexfactory:
→ Producer Price Index (PPI) in monthly terms: actual = 0.2%, forecast = 0.3%, a month ago = 0.6%;
→ Core PPI in monthly terms: actual = 0.2%, forecast = 0.2%, a month ago = 0.3%.
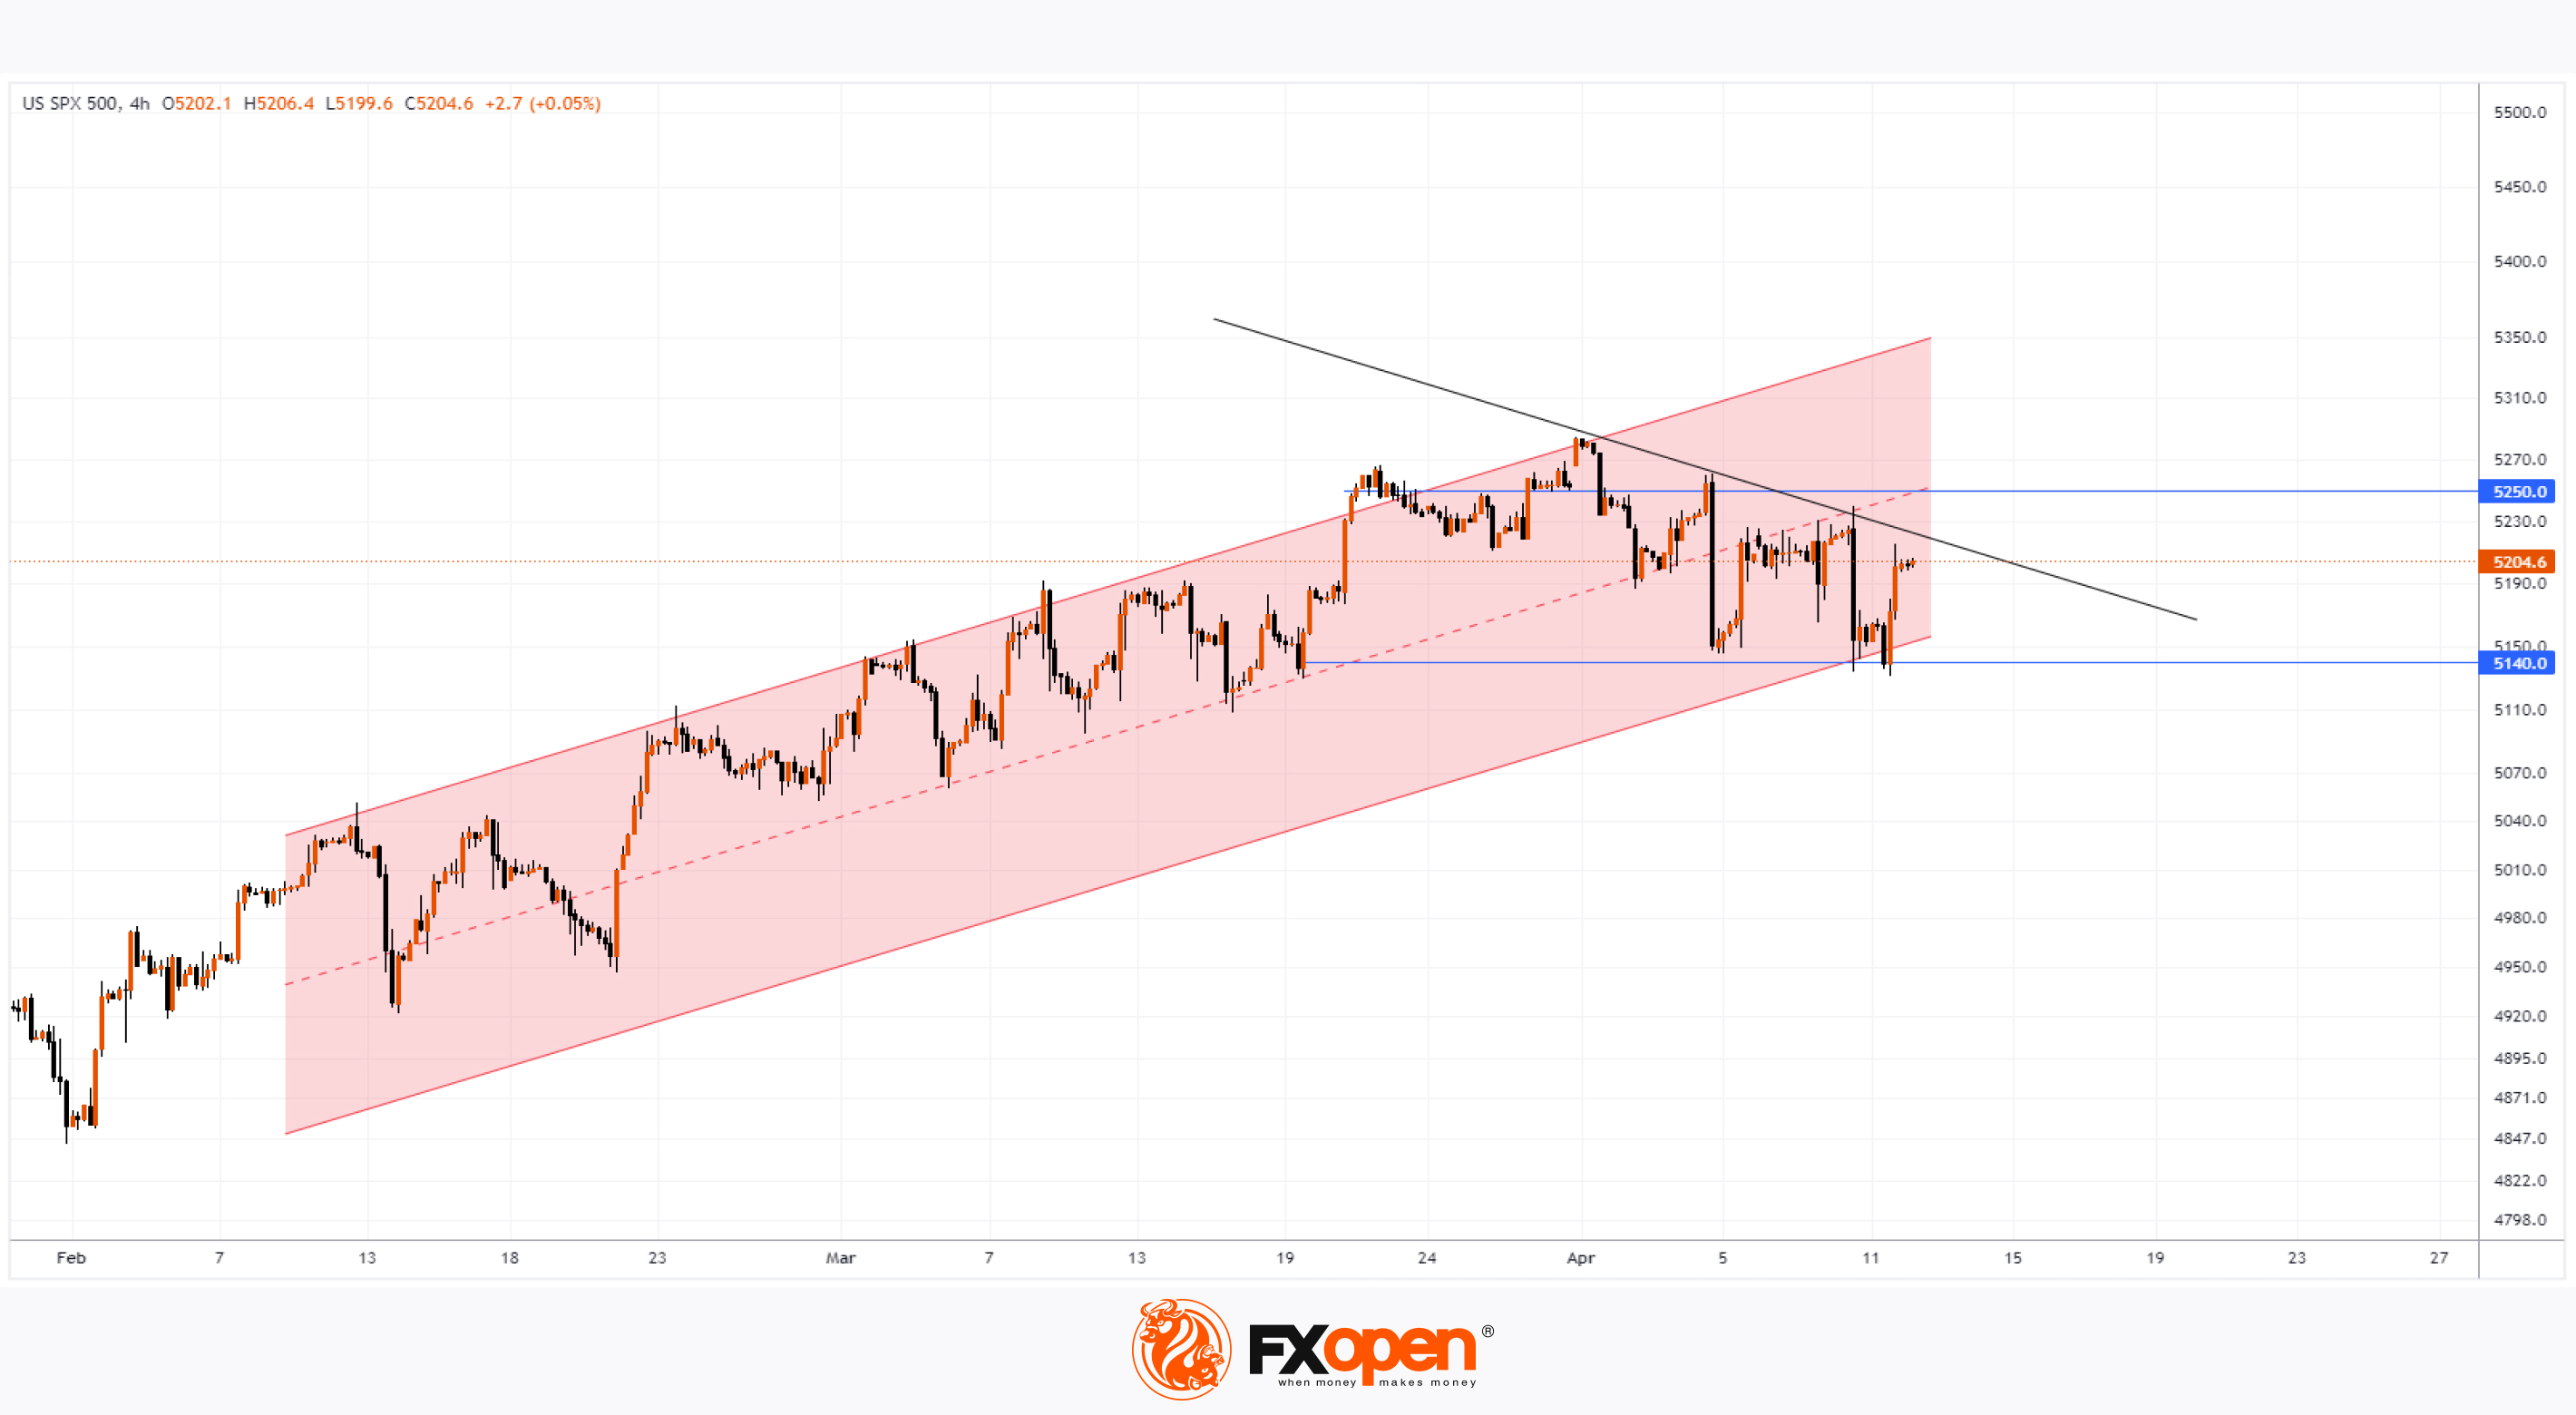
At the same time, a bottom-up reversal has formed on the S&P 500 chart, which:
→ reflects changing moods. Since the publication of the PPI has allayed some concerns about persistently high price pressures in the economy;
→ corrected the location of the lower border of the ascending channel (shown in blue), confirming its action as support.
After news-filled days related to inflation and expectations of a change in Fed monetary policy, investors' focus turns to earnings season. Today after the close of the trading session about JPMorgan Chase & Co
(JPM), Citigroup Inc (C), and Wells Fargo & Co (WFC).
According to technical analysis of the S&P-500 chart:
→ the median line of the ascending channel works as resistance, “not letting” the price into the upper half of the channel. This strengthens the mentioned resistance level of 5250.
→ if the bulls fail to build on Thursday’s momentum, the price may enter consolidation between the levels of 5140 and 5250. The closest test for the sustainability of demand is the trend line (shown in black).
Trade global index CFDs with zero commission and tight spreads. Open your FXOpen account now or learn more about trading index CFDs with FXOpen.
CFDs are complex instruments and come with a high risk of losing your money.
This article represents the opinion of the Companies operating under the FXOpen brand only. It is not to be construed as an offer, solicitation, or recommendation with respect to products and services provided by the Companies operating under the FXOpen brand, nor is it to be considered financial advice.
S&P 500 Price Consolidates ahead of Earnings Season
On April 4, we wrote that the S&P 500 is showing signs of weakness around the 5,250 level. How is the situation on the stock market developing by today, which is the start of the reporting season for the first quarter?
The S&P 500 fell sharply on Wednesday amid higher-than-expected inflation data.
But the S&P 500 rose yesterday after data showed producer prices rose only slightly in March.
According to Forexfactory:
→ Producer Price Index (PPI) in monthly terms: actual = 0.2%, forecast = 0.3%, a month ago = 0.6%;
→ Core PPI in monthly terms: actual = 0.2%, forecast = 0.2%, a month ago = 0.3%.
At the same time, a bottom-up reversal has formed on the S&P 500 chart, which:
→ reflects changing moods. Since the publication of the PPI has allayed some concerns about persistently high price pressures in the economy;
→ corrected the location of the lower border of the ascending channel (shown in blue), confirming its action as support.
After news-filled days related to inflation and expectations of a change in Fed monetary policy, investors' focus turns to earnings season. Today after the close of the trading session about JPMorgan Chase & Co
(JPM), Citigroup Inc (C), and Wells Fargo & Co (WFC).
According to technical analysis of the S&P-500 chart:
→ the median line of the ascending channel works as resistance, “not letting” the price into the upper half of the channel. This strengthens the mentioned resistance level of 5250.
→ if the bulls fail to build on Thursday’s momentum, the price may enter consolidation between the levels of 5140 and 5250. The closest test for the sustainability of demand is the trend line (shown in black).
Trade global index CFDs with zero commission and tight spreads. Open your FXOpen account now or learn more about trading index CFDs with FXOpen.
CFDs are complex instruments and come with a high risk of losing your money.
This article represents the opinion of the Companies operating under the FXOpen brand only. It is not to be construed as an offer, solicitation, or recommendation with respect to products and services provided by the Companies operating under the FXOpen brand, nor is it to be considered financial advice.
👍2
#EURUSD #marketanalysis #forextrading #forex
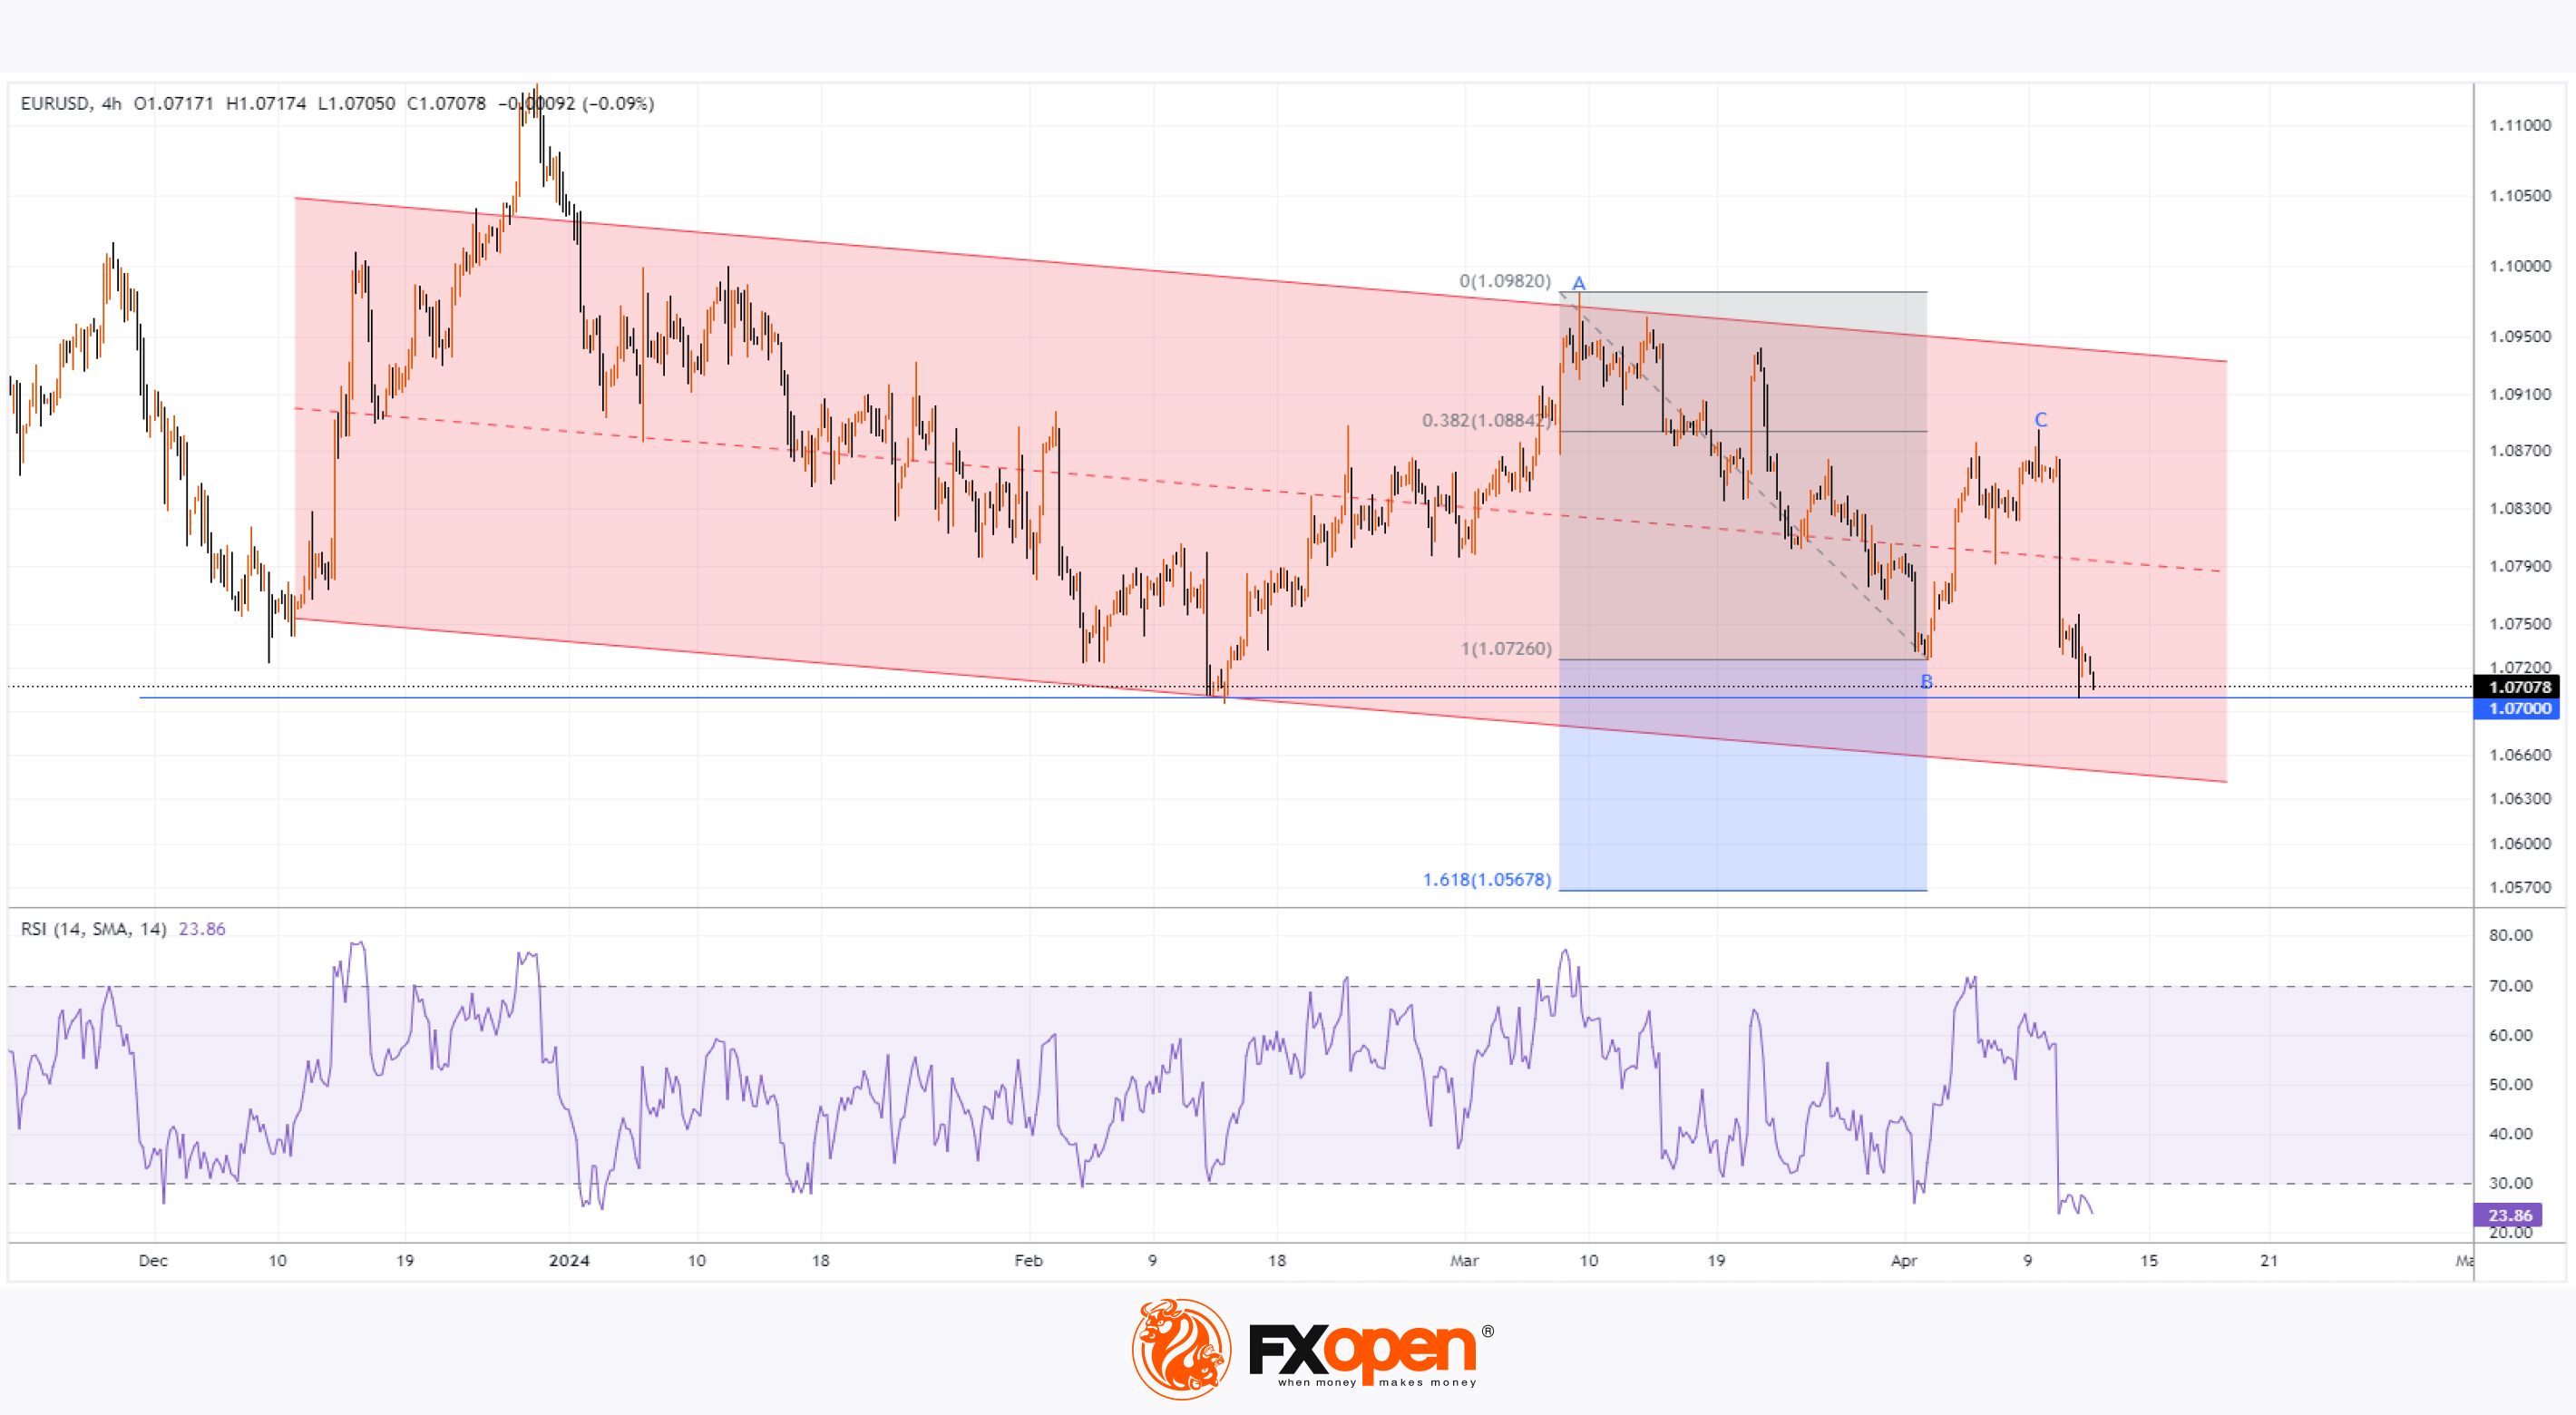
Analysis: EUR/USD Close to Year’s Low after ECB Decision
As predicted by analysts, the European Central Bank did not change the interest rate yesterday, keeping it at = 4.50%. This morning the EUR/USD rate is near the psychological level of 1.0700, which approximately corresponds to the 2024 low.
The key driver of the euro's decline is the prospect that the ECB will take the path of easing monetary policy earlier than the Fed:
→ ECB President Christine Lagarde said yesterday that the decision “depends on the data, not on the Fed.”
→ As reported by Reuters, Max Stainton, senior global macro strategist at Fidelity International, believes that “the ECB will be the first central bank to start cutting rates this year.”
Technical analysis shows that:
→ the EUR/USD rate shows downward dynamics in 2024 (shown by the red channel);
→ the price is close to the lower border of the channel, but the downward impulse from top C (-1.6% since April 9) is holding back the level of 1.0700;
If we apply the Fibonacci proportions, then it is acceptable to assume that:
→ the upward movement B→C is an intermediate recovery after the downward impulse A→B (recovery completed at the level of 0.382);
→ the bears' target may be the Fibo level of 1.618, which corresponds to the rate of 1.05678 euros per dollar.
This goal can hardly be considered achievable in the near future, given that:
→ the market is oversold, as evidenced by RSI;
→ on the path of the bears there is support at 1.0700 and the lower border of the channel.
Trade over 50 forex markets 24 hours a day with FXOpen. Take advantage of low commissions, deep liquidity, and spreads from 0.0 pips. Open your FXOpen account now or learn more about trading forex with FXOpen.
CFDs are complex instruments and come with a high risk of losing your money.
This article represents the opinion of the Companies operating under the FXOpen brand only. It is not to be construed as an offer, solicitation, or recommendation with respect to products and services provided by the Companies operating under the FXOpen brand, nor is it to be considered financial advice.
Analysis: EUR/USD Close to Year’s Low after ECB Decision
As predicted by analysts, the European Central Bank did not change the interest rate yesterday, keeping it at = 4.50%. This morning the EUR/USD rate is near the psychological level of 1.0700, which approximately corresponds to the 2024 low.
The key driver of the euro's decline is the prospect that the ECB will take the path of easing monetary policy earlier than the Fed:
→ ECB President Christine Lagarde said yesterday that the decision “depends on the data, not on the Fed.”
→ As reported by Reuters, Max Stainton, senior global macro strategist at Fidelity International, believes that “the ECB will be the first central bank to start cutting rates this year.”
Technical analysis shows that:
→ the EUR/USD rate shows downward dynamics in 2024 (shown by the red channel);
→ the price is close to the lower border of the channel, but the downward impulse from top C (-1.6% since April 9) is holding back the level of 1.0700;
If we apply the Fibonacci proportions, then it is acceptable to assume that:
→ the upward movement B→C is an intermediate recovery after the downward impulse A→B (recovery completed at the level of 0.382);
→ the bears' target may be the Fibo level of 1.618, which corresponds to the rate of 1.05678 euros per dollar.
This goal can hardly be considered achievable in the near future, given that:
→ the market is oversold, as evidenced by RSI;
→ on the path of the bears there is support at 1.0700 and the lower border of the channel.
Trade over 50 forex markets 24 hours a day with FXOpen. Take advantage of low commissions, deep liquidity, and spreads from 0.0 pips. Open your FXOpen account now or learn more about trading forex with FXOpen.
CFDs are complex instruments and come with a high risk of losing your money.
This article represents the opinion of the Companies operating under the FXOpen brand only. It is not to be construed as an offer, solicitation, or recommendation with respect to products and services provided by the Companies operating under the FXOpen brand, nor is it to be considered financial advice.
👍2
#ftse #NZDUSD #usdollar #USDJPY #forextrading #MarketNews
Weekly Market Wrap With Gary Thomson: FTSE. NZD/USD, USD, USD/JPY
Get the latest scoop on the week's hottest headlines, all in one convenient video. Join Gary Thomson, the COO of FXOpen UK, as he breaks down the most significant news reports and shares his expert insights.
🔸 FTSE 100's Holy Grail of 8,000 Continues to Be a Pipe Dream
🔸 NZD/USD Rate Increases after the Decision of the Reserve Bank of New Zealand
🔸 Inflation Data Sharply Strengthens the US Dollar
🔸 USD/JPY Rises to Highest Since 1990
Stay in the know and empower yourself with our short, yet power-packed video. Watch it now and stay updated with FXOpen. Don't miss out on this invaluable opportunity to sharpen your trading skills and make informed decisions.
https://cutt.ly/pw7uD3pq
To take advantage of price fluctuations in the foreign exchange markets, consider enlisting the services of a reliable broker like FXOpen.
⚠️
This forecast represents FXOpen Companies opinion only, it should not be construed as an offer, invitation or recommendation in respect to FXOpen Companies products and services or as financial advice.
Weekly Market Wrap With Gary Thomson: FTSE. NZD/USD, USD, USD/JPY
Get the latest scoop on the week's hottest headlines, all in one convenient video. Join Gary Thomson, the COO of FXOpen UK, as he breaks down the most significant news reports and shares his expert insights.
🔸 FTSE 100's Holy Grail of 8,000 Continues to Be a Pipe Dream
🔸 NZD/USD Rate Increases after the Decision of the Reserve Bank of New Zealand
🔸 Inflation Data Sharply Strengthens the US Dollar
🔸 USD/JPY Rises to Highest Since 1990
Stay in the know and empower yourself with our short, yet power-packed video. Watch it now and stay updated with FXOpen. Don't miss out on this invaluable opportunity to sharpen your trading skills and make informed decisions.
https://cutt.ly/pw7uD3pq
To take advantage of price fluctuations in the foreign exchange markets, consider enlisting the services of a reliable broker like FXOpen.
⚠️
This forecast represents FXOpen Companies opinion only, it should not be construed as an offer, invitation or recommendation in respect to FXOpen Companies products and services or as financial advice.
YouTube
Weekly Market Wrap With Gary Thomson: FTSE, NZD/USD, USD, USD/JPY
Get the latest scoop on the week's hottest headlines, all in one convenient video. Join Gary Thomson, the COO of FXOpen UK, as he breaks down the most significant news reports and shares his expert insights.
00:49 FTSE 100's Holy Grail of 8,000 Continues…
00:49 FTSE 100's Holy Grail of 8,000 Continues…
👍2
#marketanalysis #brentoil #oilprices #MarketNews
Brent Oil Price Did Not Rise Despite Iran's Attack on Israel
As you know, Iran launched a missile attack on Israel over the weekend. This could greatly increase the price of Brent oil, given that Iran is one of the top 10 oil producing countries, and the fact of the strike could provoke further escalation in the region.
However, at the beginning of the trading week, the price of Brent oil is below the levels at which they were at the end of last week. How so?
It is acceptable to assume the impact that the price reflects market risks and the expectations of its participants:
→ As the media wrote last week, the blow was expected after Israel’s attack on the Iranian mission.
→ The risk of escalation is not as high as it could be. According to the Washington Post, Biden advises Netanyahu to “slow down” after the Iranian attack. Administration officials said the United States would not join in any response to Tehran's attack and suggested Israel avoid escalation.
How might the situation develop further on the oil market?
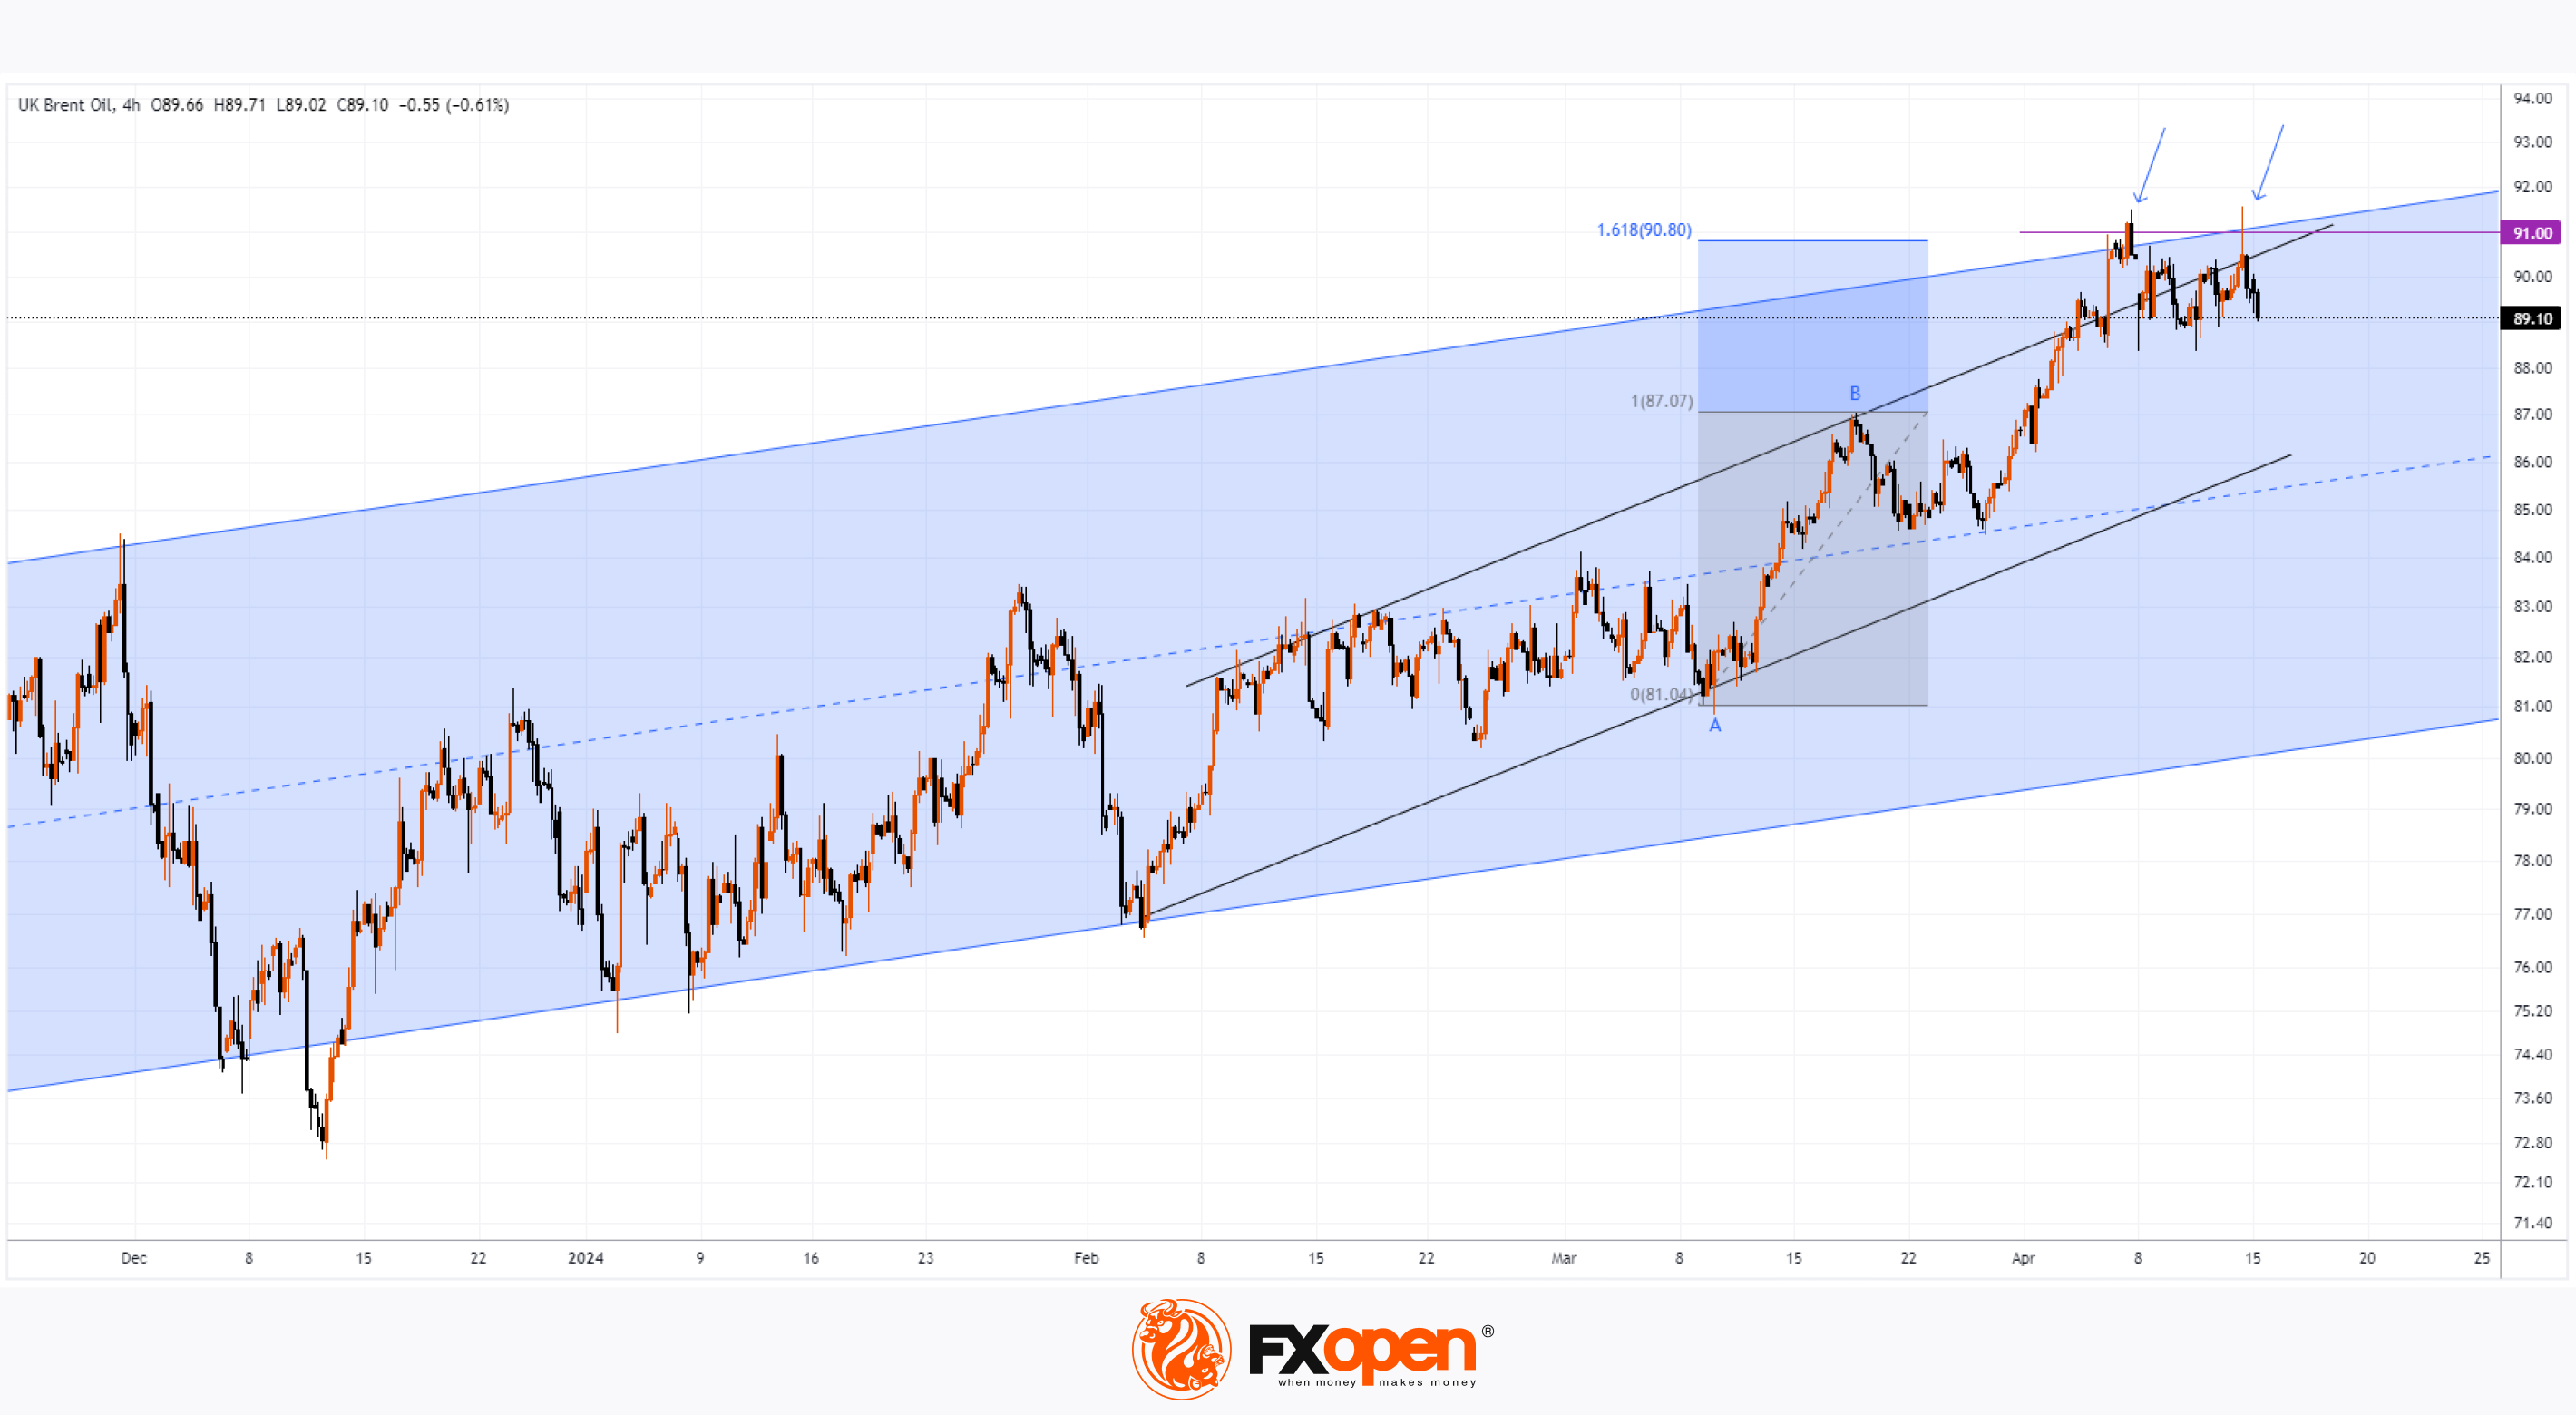
From the point of view of technical analysis of the price of Brent oil, as we wrote on April 4, the upper limit of the blue channel is around USD 92 per barrel of Brent.
→ Fears of escalation pushed the price beyond the USD 91 level, but it failed to gain a foothold there.
→ The price quickly returned below the USD 91 level (as shown by the arrows) — a sign of bearish activity.
→ Resistance to price growth is provided by both the upper border of the blue channel and the upper border of the intermediate ascending channel (shown by black lines).
Please note that if we take the A→B impulse as a 100% basis, then at the price level of USD 90.80 per barrel of Brent there is a Fibonacci resistance level of 1.618.
Therefore, there is reason to assume that the price of oil may form a correction to the lower black support line if there are no signs of escalation (then the price of oil may rise closer to USD 100, as CNBC writes). And for the current US authorities, it is believed that rising oil prices are unprofitable due to the upcoming elections.
Start trading commodity CFDs with tight spreads. Open your trading account now or learn more about trading commodity CFDs with FXOpen.
CFDs are complex instruments and come with a high risk of losing your money.
This article represents the opinion of the Companies operating under the FXOpen brand only. It is not to be construed as an offer, solicitation, or recommendation with respect to products and services provided by the Companies operating under the FXOpen brand, nor is it to be considered financial advice.
Brent Oil Price Did Not Rise Despite Iran's Attack on Israel
As you know, Iran launched a missile attack on Israel over the weekend. This could greatly increase the price of Brent oil, given that Iran is one of the top 10 oil producing countries, and the fact of the strike could provoke further escalation in the region.
However, at the beginning of the trading week, the price of Brent oil is below the levels at which they were at the end of last week. How so?
It is acceptable to assume the impact that the price reflects market risks and the expectations of its participants:
→ As the media wrote last week, the blow was expected after Israel’s attack on the Iranian mission.
→ The risk of escalation is not as high as it could be. According to the Washington Post, Biden advises Netanyahu to “slow down” after the Iranian attack. Administration officials said the United States would not join in any response to Tehran's attack and suggested Israel avoid escalation.
How might the situation develop further on the oil market?
From the point of view of technical analysis of the price of Brent oil, as we wrote on April 4, the upper limit of the blue channel is around USD 92 per barrel of Brent.
→ Fears of escalation pushed the price beyond the USD 91 level, but it failed to gain a foothold there.
→ The price quickly returned below the USD 91 level (as shown by the arrows) — a sign of bearish activity.
→ Resistance to price growth is provided by both the upper border of the blue channel and the upper border of the intermediate ascending channel (shown by black lines).
Please note that if we take the A→B impulse as a 100% basis, then at the price level of USD 90.80 per barrel of Brent there is a Fibonacci resistance level of 1.618.
Therefore, there is reason to assume that the price of oil may form a correction to the lower black support line if there are no signs of escalation (then the price of oil may rise closer to USD 100, as CNBC writes). And for the current US authorities, it is believed that rising oil prices are unprofitable due to the upcoming elections.
Start trading commodity CFDs with tight spreads. Open your trading account now or learn more about trading commodity CFDs with FXOpen.
CFDs are complex instruments and come with a high risk of losing your money.
This article represents the opinion of the Companies operating under the FXOpen brand only. It is not to be construed as an offer, solicitation, or recommendation with respect to products and services provided by the Companies operating under the FXOpen brand, nor is it to be considered financial advice.
👍2
#XAUUSD #goldprice #MarketNews
XAU/USD Gold Price Reaches an Important Resistance Zone
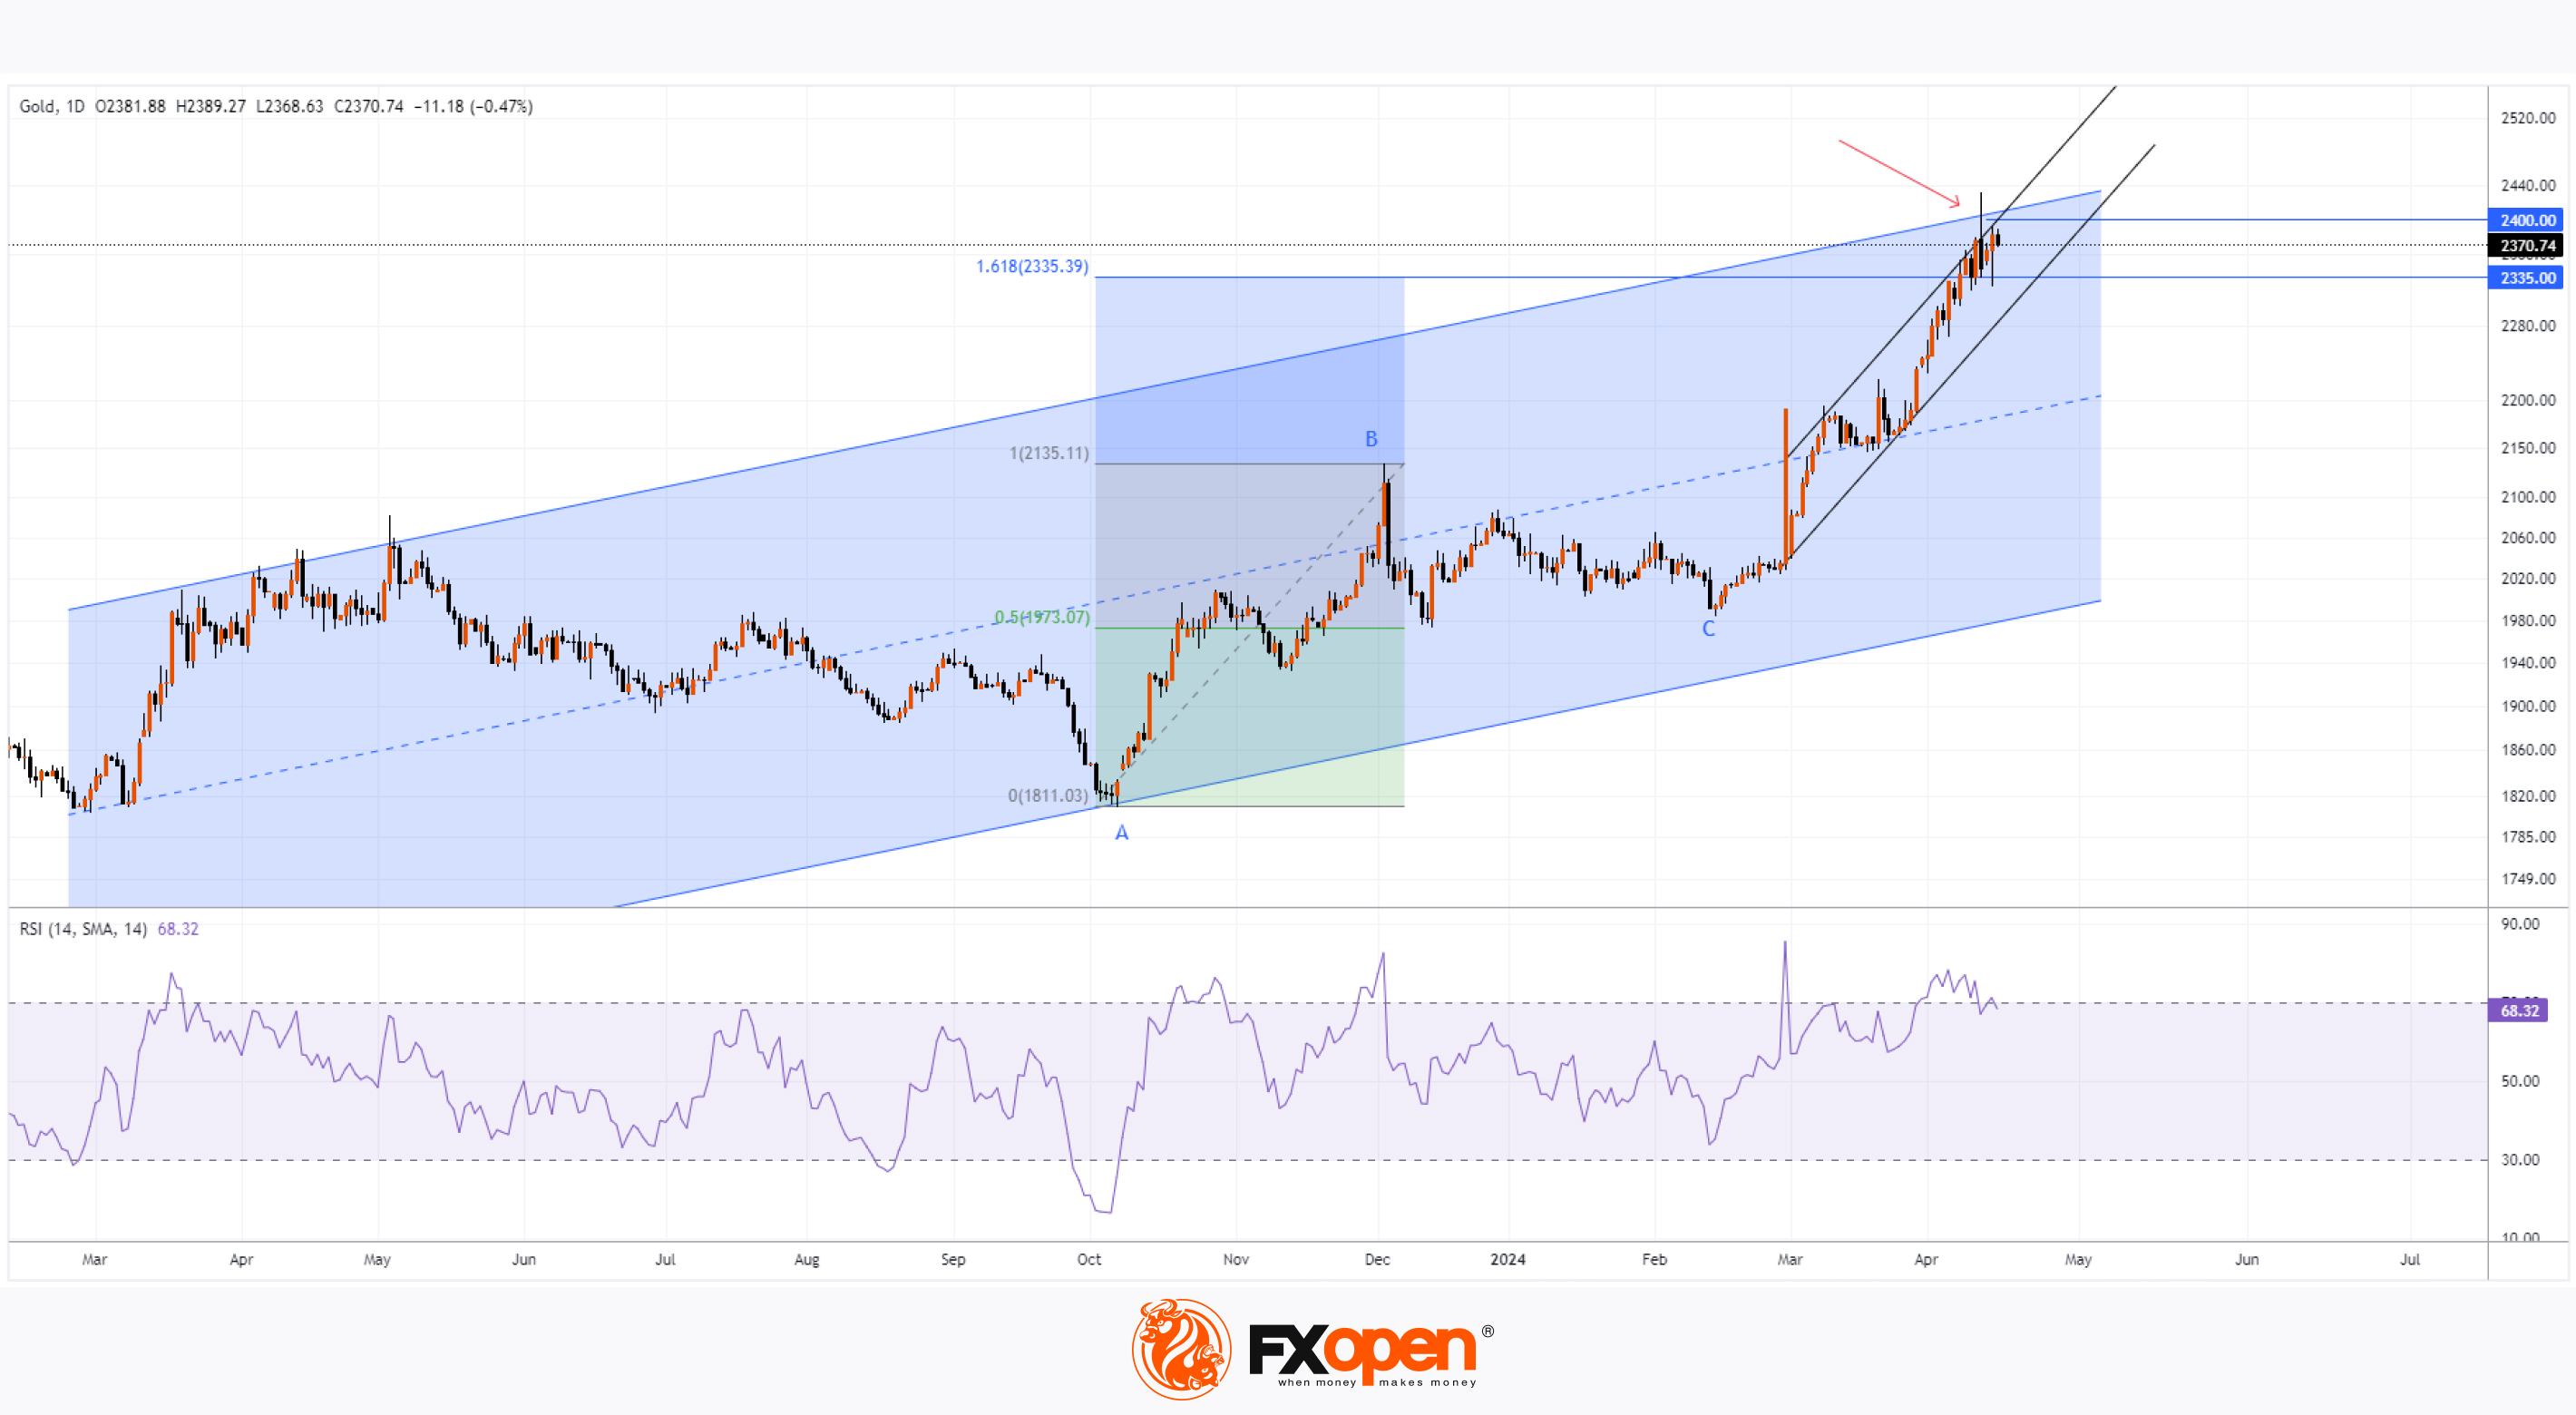
The XAU/USD gold chart today indicates that the historical record price of the metal is above USD 2,400 per ounce.
In addition to fears of a new round of inflation due to rising commodity prices, geopolitical tensions are seen as the most important reason for the growth. At the moment, there are both active military conflicts on the planet (Ukraine, Israel-Iran), and there is a threat of creating new ones (Taiwan, for example). The US national debt and upcoming elections may also act as a destabilizing factor.
Therefore, gold acts as a traditional safe-haven asset. According to Goldman Sachs analysts, gold is in an “unshakable bull market”, so they raised their gold price forecast from USD 2,300 to USD 2,700.
Since the beginning of 2024, the price of XAU/USD has risen 15%, setting a new all-time high of USD 2,425. Could the bull run continue further?
Although the fundamental backdrop remains tense, from a technical analysis perspective on gold prices, there are 4 important headwinds to consider:
→ the ascending channel (shown in blue). Today XAU/USD is near its upper line. As the arrow shows, the price of gold reacts to this line as resistance.
→ Psychological round level 2,400. Having exceeded it, the price quickly returned back.
→ The RSI indicator indicates that the market is overbought.
→ Fibonacci proportions. If we take impulse A→B as 100%, then the impulse price growth from point C has already exceeded the level = 1.618 (around 2,335), which could be the target.
On April 3, we wrote that the price of gold could rise to the level of 2,380. Now, in addition to the listed factors, it is worth taking into account the motive of some traders to take profits after a period of rising prices, which may contribute to the formation of a correction in the market - for example, to the lower intermediate channel lines (shown in black).
Start trading commodity CFDs with tight spreads. Open your trading account now or learn more about trading commodity CFDs with FXOpen.
CFDs are complex instruments and come with a high risk of losing your money.
This article represents the opinion of the Companies operating under the FXOpen brand only. It is not to be construed as an offer, solicitation, or recommendation with respect to products and services provided by the Companies operating under the FXOpen brand, nor is it to be considered financial advice.
XAU/USD Gold Price Reaches an Important Resistance Zone
The XAU/USD gold chart today indicates that the historical record price of the metal is above USD 2,400 per ounce.
In addition to fears of a new round of inflation due to rising commodity prices, geopolitical tensions are seen as the most important reason for the growth. At the moment, there are both active military conflicts on the planet (Ukraine, Israel-Iran), and there is a threat of creating new ones (Taiwan, for example). The US national debt and upcoming elections may also act as a destabilizing factor.
Therefore, gold acts as a traditional safe-haven asset. According to Goldman Sachs analysts, gold is in an “unshakable bull market”, so they raised their gold price forecast from USD 2,300 to USD 2,700.
Since the beginning of 2024, the price of XAU/USD has risen 15%, setting a new all-time high of USD 2,425. Could the bull run continue further?
Although the fundamental backdrop remains tense, from a technical analysis perspective on gold prices, there are 4 important headwinds to consider:
→ the ascending channel (shown in blue). Today XAU/USD is near its upper line. As the arrow shows, the price of gold reacts to this line as resistance.
→ Psychological round level 2,400. Having exceeded it, the price quickly returned back.
→ The RSI indicator indicates that the market is overbought.
→ Fibonacci proportions. If we take impulse A→B as 100%, then the impulse price growth from point C has already exceeded the level = 1.618 (around 2,335), which could be the target.
On April 3, we wrote that the price of gold could rise to the level of 2,380. Now, in addition to the listed factors, it is worth taking into account the motive of some traders to take profits after a period of rising prices, which may contribute to the formation of a correction in the market - for example, to the lower intermediate channel lines (shown in black).
Start trading commodity CFDs with tight spreads. Open your trading account now or learn more about trading commodity CFDs with FXOpen.
CFDs are complex instruments and come with a high risk of losing your money.
This article represents the opinion of the Companies operating under the FXOpen brand only. It is not to be construed as an offer, solicitation, or recommendation with respect to products and services provided by the Companies operating under the FXOpen brand, nor is it to be considered financial advice.
👍3
#USDJPY #MarketNews #marketanalysis #forextrading
USD/JPY Analysis: Prospect of a Breakout of the Level of 155 Yen per Dollar
The USD/JPY rate has consistently reached new highs since 1990, approaching the psychological level of 155 yen per US dollar. The Japanese currency has already fallen about 9% against the dollar this year.
This is supported by Jerome Powell, who suggested yesterday that US interest rates are likely to remain high for longer. He refused to give any guidance on when interest rates might be cut, greatly dimming investors' hopes for significant easing this year.
Market participants now expect a 40 basis point rate cut in 2024, significantly lower than the 160 basis point easing they were counting on at the start of the year, according to FedWatch.
At the same time, traders are focused on whether Japanese monetary authorities will intervene to support the currency as it deteriorates rapidly. Officials have stepped up warnings of possible intervention, although analysts also say fighting the dollar's strong bullish trend will be difficult and costly. Japanese Finance Minister Shunichi Suzuki said on Tuesday he was closely monitoring the yen's exchange rate against the US dollar today and would take "strengthened response measures if necessary."
“Today, intervention can only help slow or contain the pace of depreciation, but cannot reverse the trend,” Kenneth Broux, head of exchange rate research at Societe Generale, told Reuters. Japan last intervened in the foreign exchange market in 2022, spending an estimated USD 60 billion to defend the yen.
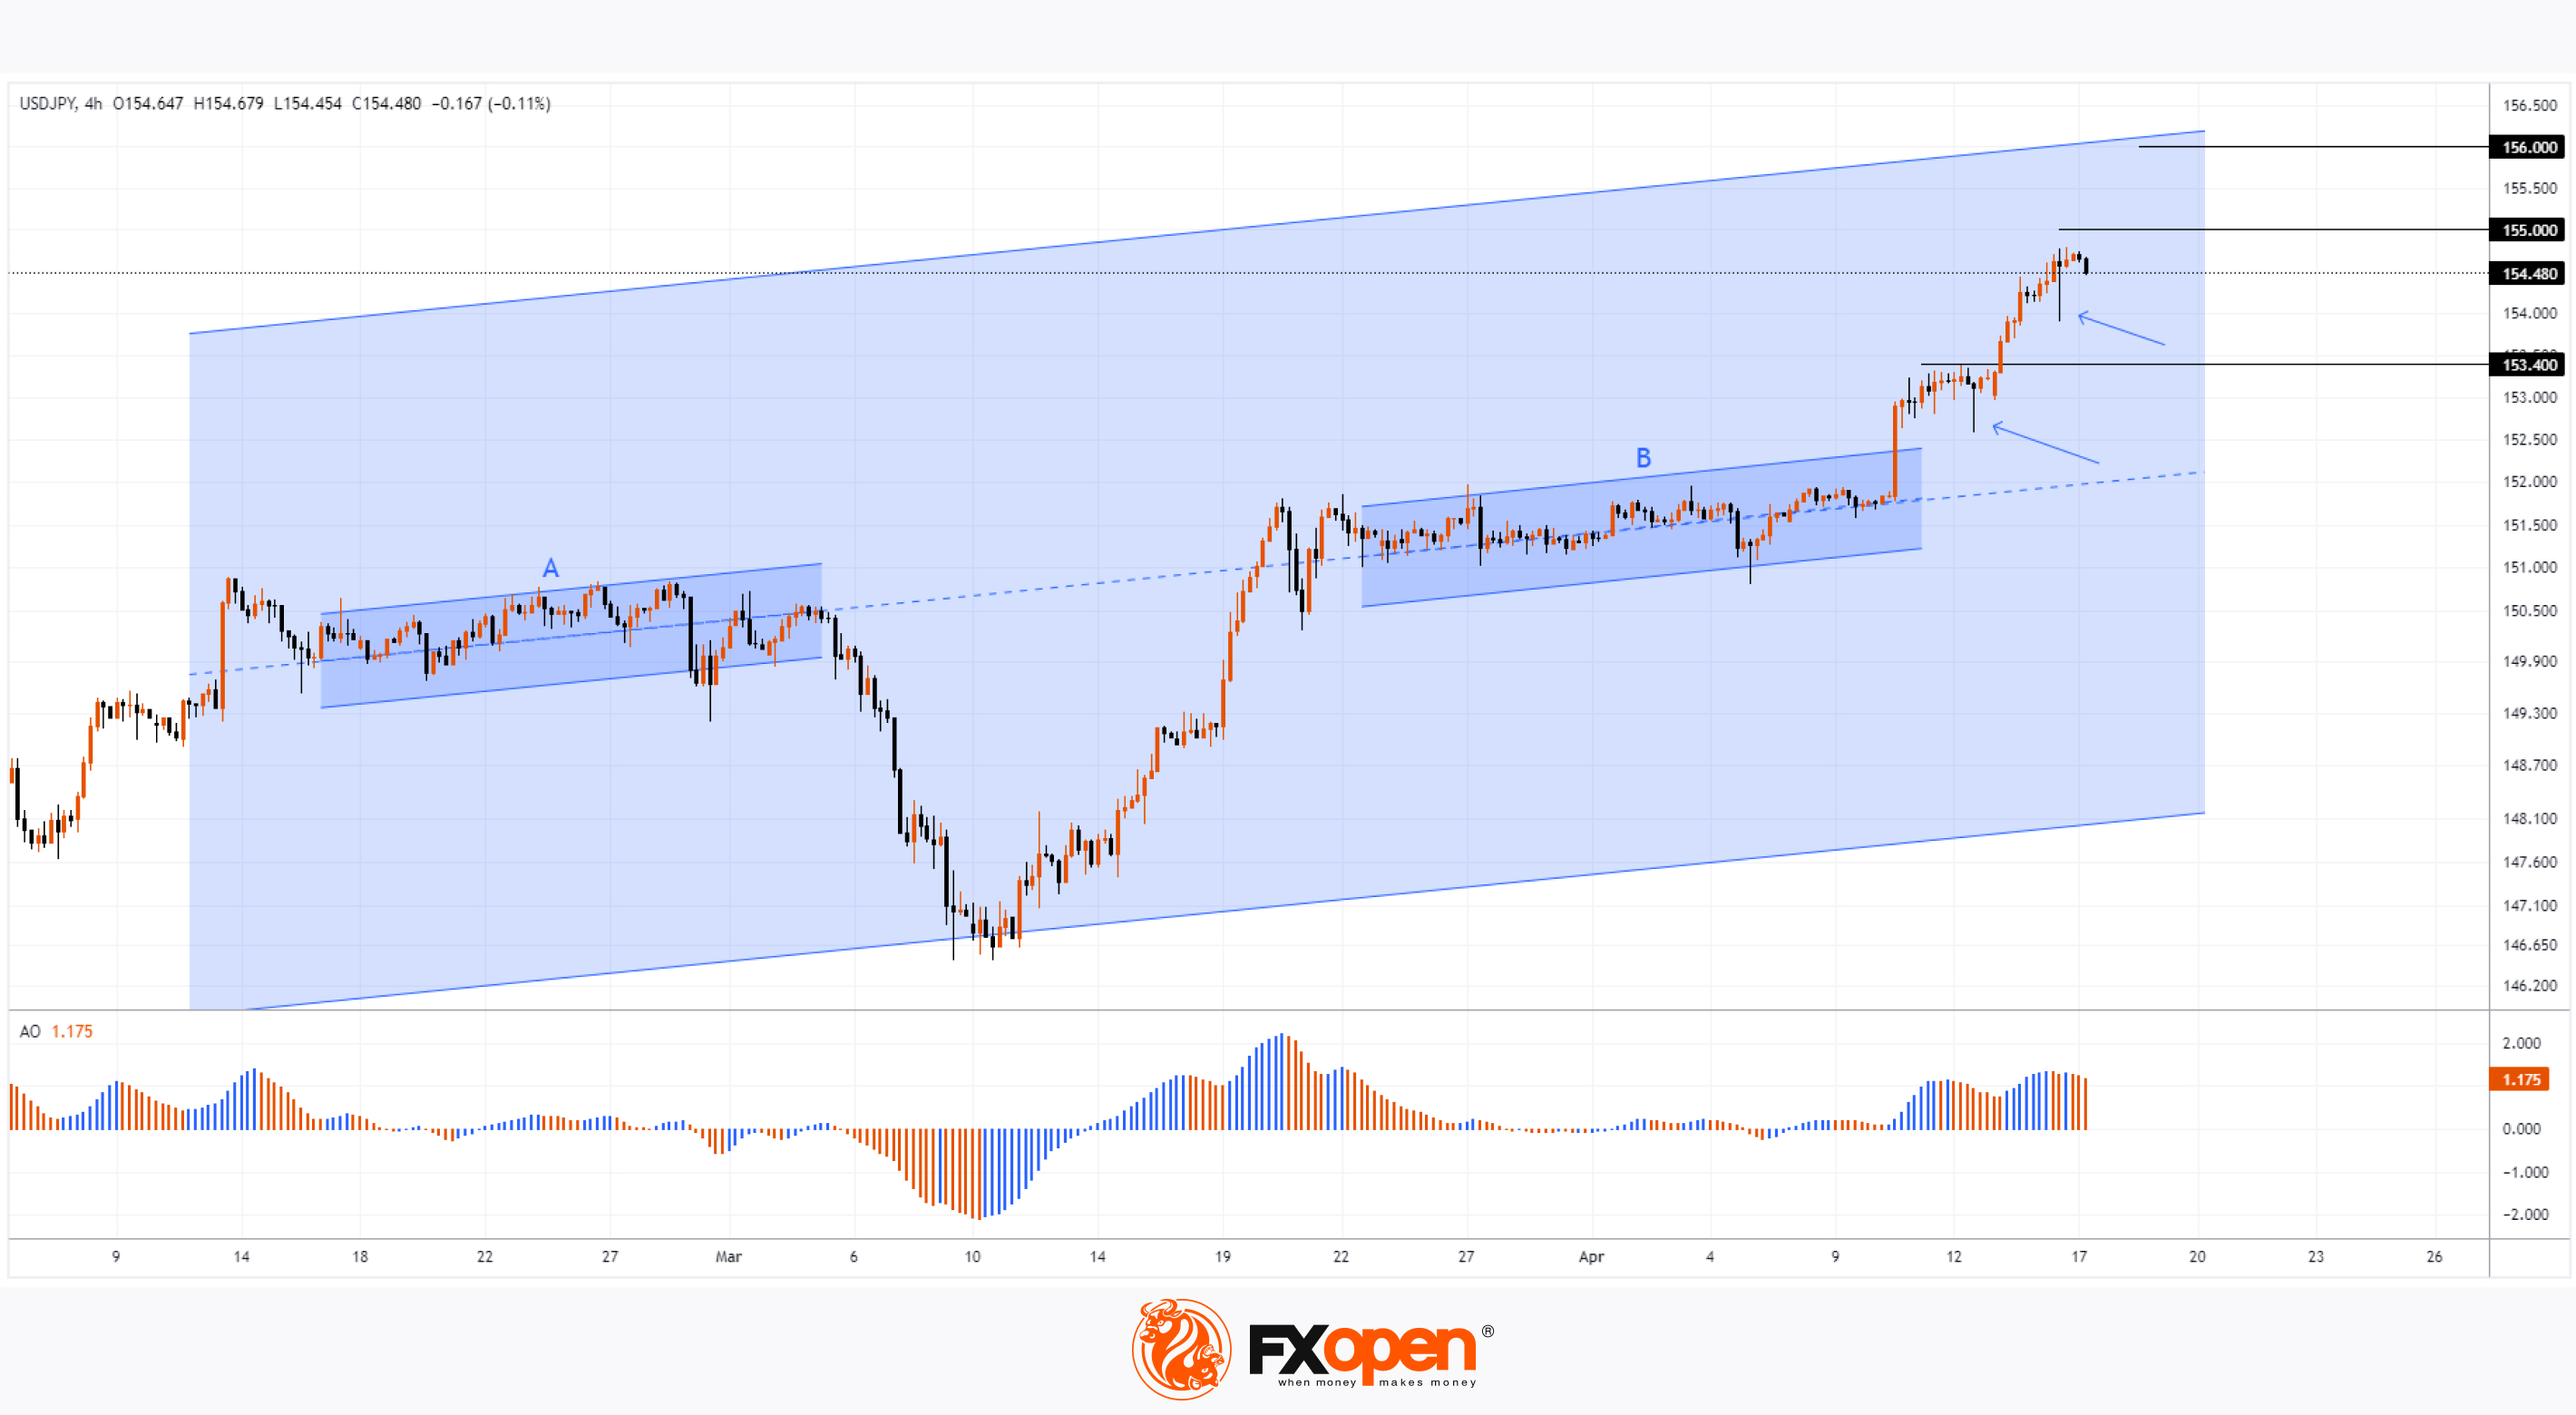
Technical analysis of the USD/JPY chart shows that the market is moving in an uptrend, judging by the fact that the Awesome indicator is above the zero line.
Wherein:
→ long lower shadows on the candles (shown by arrows) indicate the strength of demand;
→ if we take consolidation zones A and B as the basis for constructing the median of the ascending trend channel, and the March minimum as the basis for constructing its lower border, then the target of the unfolding growth may be the level of 156 yen per US dollar, where the upper border of the channel lies;
→ in case of a rollback, the USD/JPY price may be supported by the former resistance at 153.400.
Trade over 50 forex markets 24 hours a day with FXOpen. Take advantage of low commissions, deep liquidity, and spreads from 0.0 pips. Open your FXOpen account now or learn more about trading forex with FXOpen.
CFDs are complex instruments and come with a high risk of losing your money.
This article represents the opinion of the Companies operating under the FXOpen brand only. It is not to be construed as an offer, solicitation, or recommendation with respect to products and services provided by the Companies operating under the FXOpen brand, nor is it to be considered financial advice.
USD/JPY Analysis: Prospect of a Breakout of the Level of 155 Yen per Dollar
The USD/JPY rate has consistently reached new highs since 1990, approaching the psychological level of 155 yen per US dollar. The Japanese currency has already fallen about 9% against the dollar this year.
This is supported by Jerome Powell, who suggested yesterday that US interest rates are likely to remain high for longer. He refused to give any guidance on when interest rates might be cut, greatly dimming investors' hopes for significant easing this year.
Market participants now expect a 40 basis point rate cut in 2024, significantly lower than the 160 basis point easing they were counting on at the start of the year, according to FedWatch.
At the same time, traders are focused on whether Japanese monetary authorities will intervene to support the currency as it deteriorates rapidly. Officials have stepped up warnings of possible intervention, although analysts also say fighting the dollar's strong bullish trend will be difficult and costly. Japanese Finance Minister Shunichi Suzuki said on Tuesday he was closely monitoring the yen's exchange rate against the US dollar today and would take "strengthened response measures if necessary."
“Today, intervention can only help slow or contain the pace of depreciation, but cannot reverse the trend,” Kenneth Broux, head of exchange rate research at Societe Generale, told Reuters. Japan last intervened in the foreign exchange market in 2022, spending an estimated USD 60 billion to defend the yen.
Technical analysis of the USD/JPY chart shows that the market is moving in an uptrend, judging by the fact that the Awesome indicator is above the zero line.
Wherein:
→ long lower shadows on the candles (shown by arrows) indicate the strength of demand;
→ if we take consolidation zones A and B as the basis for constructing the median of the ascending trend channel, and the March minimum as the basis for constructing its lower border, then the target of the unfolding growth may be the level of 156 yen per US dollar, where the upper border of the channel lies;
→ in case of a rollback, the USD/JPY price may be supported by the former resistance at 153.400.
Trade over 50 forex markets 24 hours a day with FXOpen. Take advantage of low commissions, deep liquidity, and spreads from 0.0 pips. Open your FXOpen account now or learn more about trading forex with FXOpen.
CFDs are complex instruments and come with a high risk of losing your money.
This article represents the opinion of the Companies operating under the FXOpen brand only. It is not to be construed as an offer, solicitation, or recommendation with respect to products and services provided by the Companies operating under the FXOpen brand, nor is it to be considered financial advice.
👍2
#stockmarket #stocktrading #MarketNews #marketanalysis
UnitedHealth (UNH) Share Price Surges after Strong Report
UnitedHealth shares surged Tuesday, rising more than 5% after the health care giant delivered stronger-than-expected first-quarter 2024 results:
→ earnings per share: actual = USD 6.91, expected = USD 6.61, last quarter = USD 6.16;
→ gross income: actual = USD 94.4 billion, expected = USD 92.1 billion.
UnitedHealth CEO Andrew Whitty said health care costs rose sharply last year, and he attributed much of the rise to the effects of the Covid-19 pandemic.
Also adding positive news to investors was UnitedHealth Group's handling of the Feb. 21 cyberattack on its Change Healthcare subsidiary, which disrupted hospital and pharmacy operations for more than a week and cost an estimated USD 872 million.
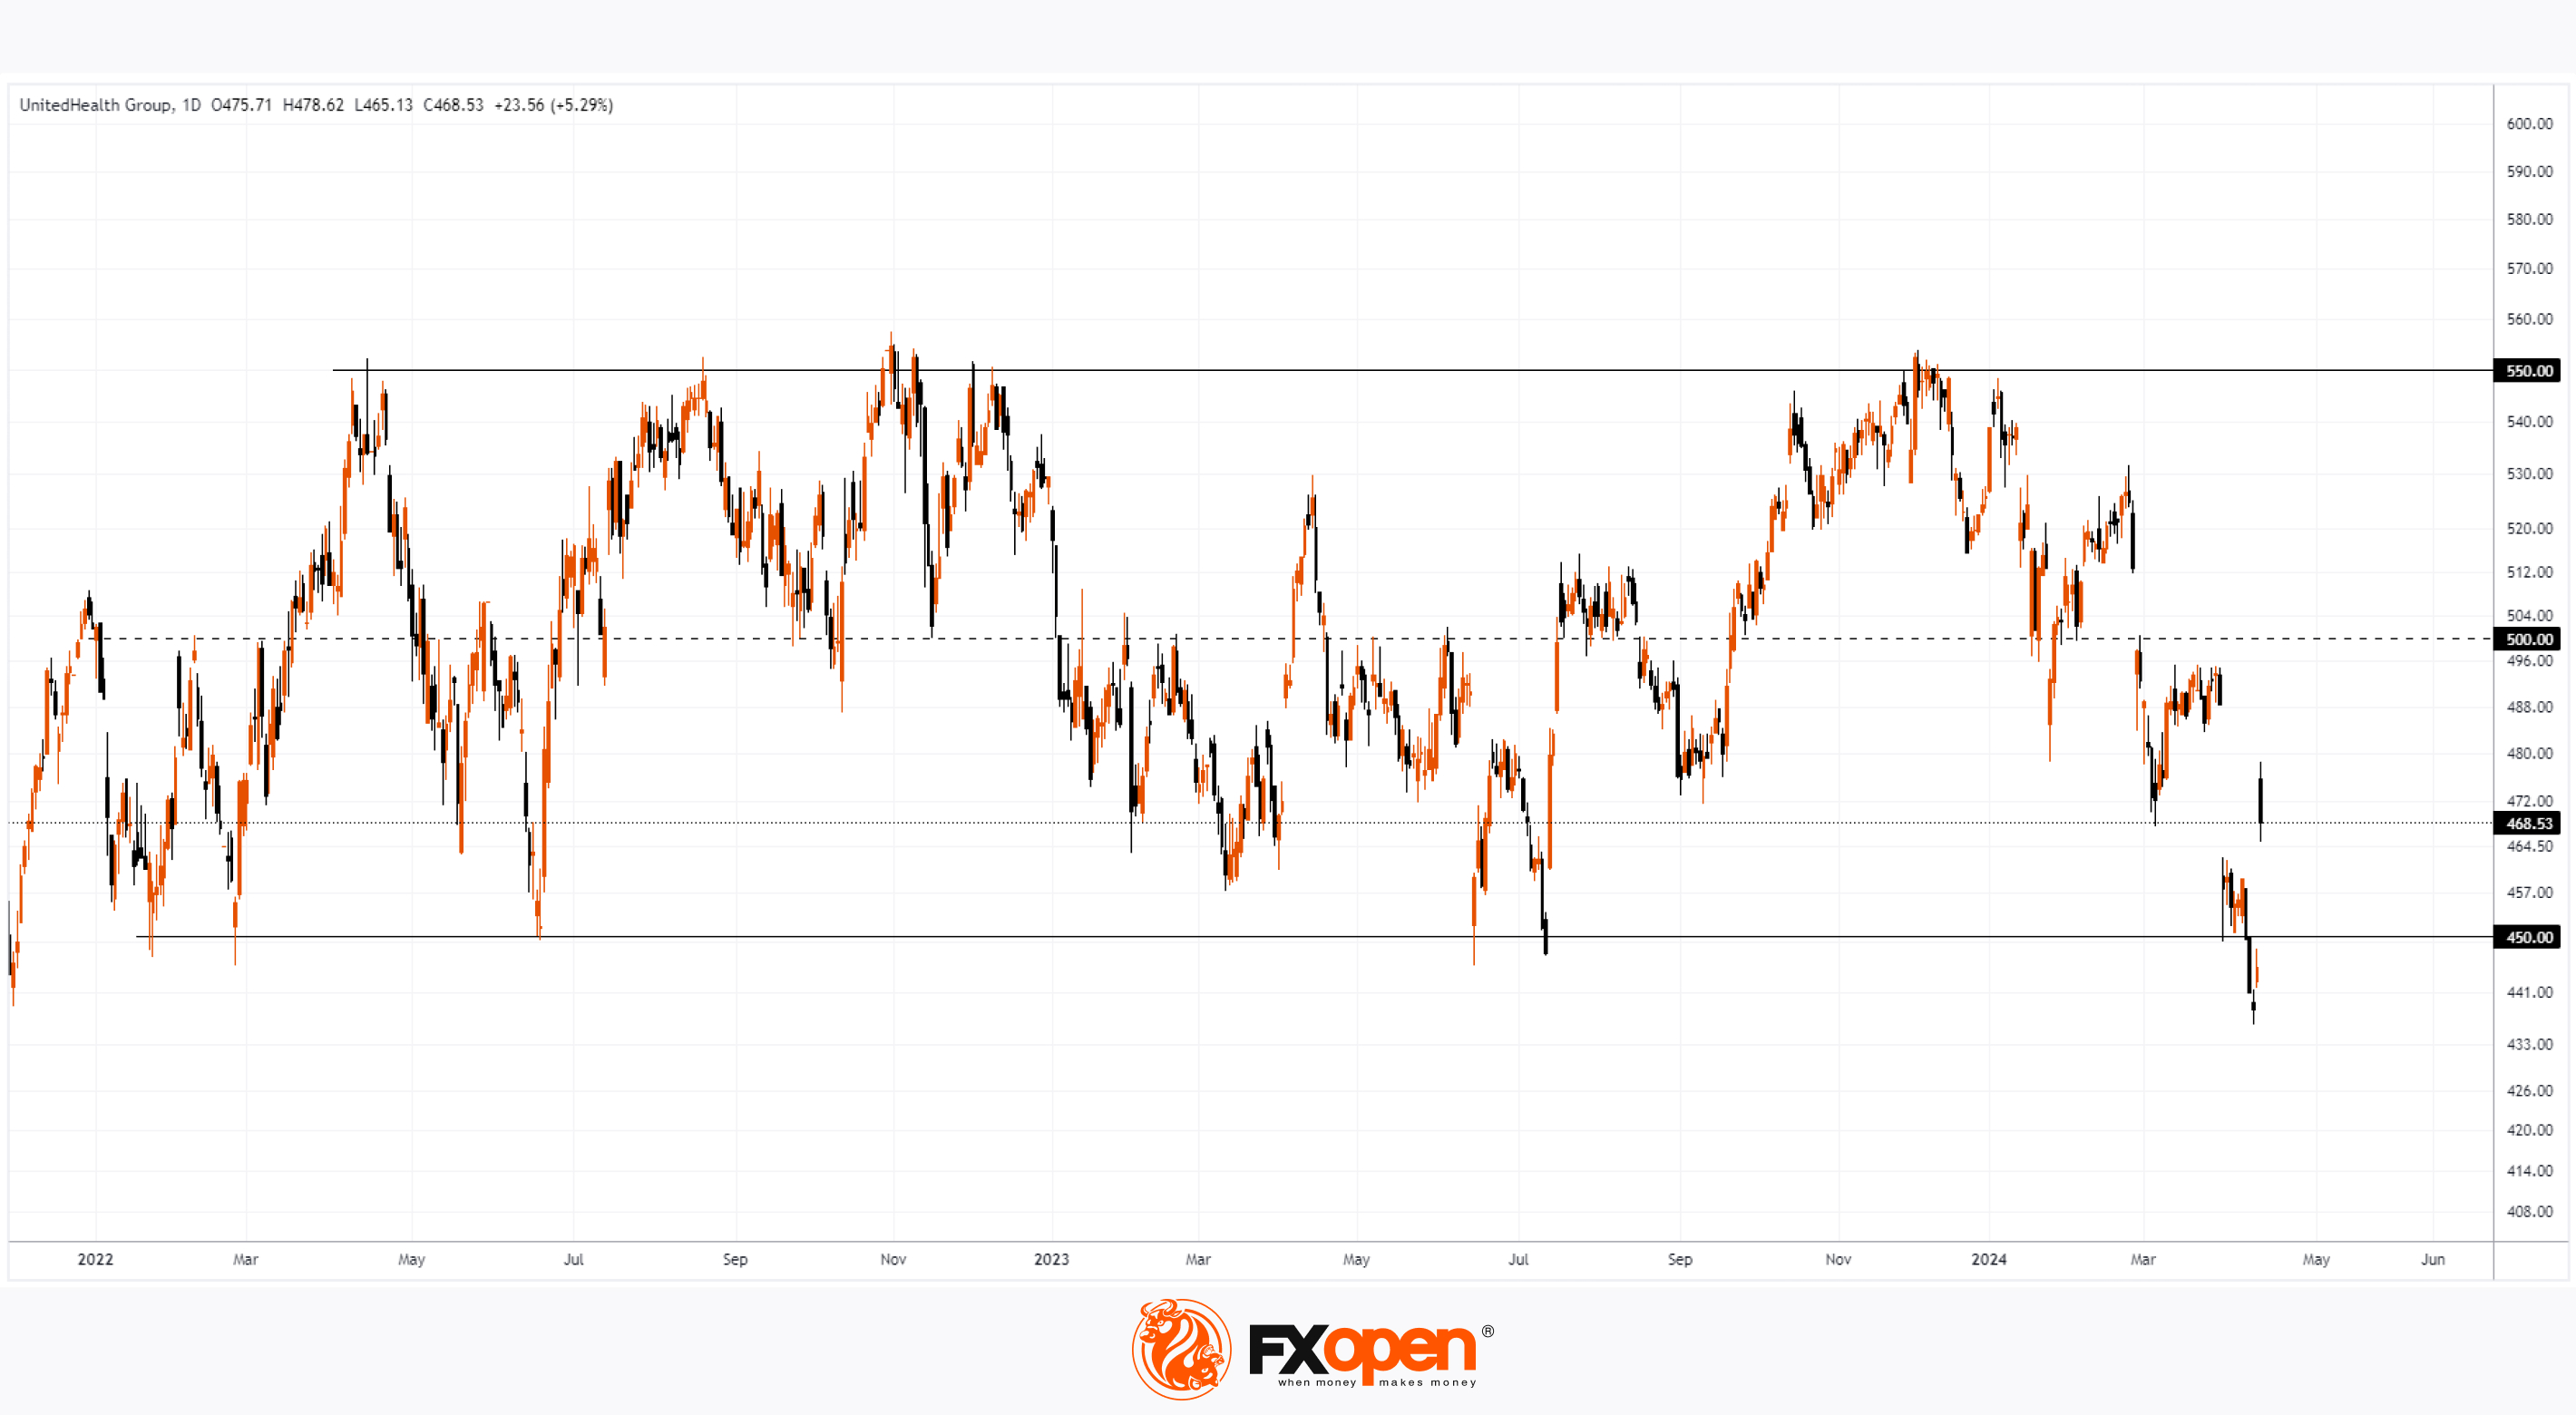
Technical analysis of the UNH stock chart shows that:
→ starting in 2022, the price moves within the range between support at USD 450 and resistance at USD 550 per share;
→ false breakouts of the indicated levels occurred repeatedly;
→ as a result of the publication of the report, another false breakdown of support was formed at USD 450 per UNH share;
→ growth after the report occurred with a gap in the area of USD 450-465, which can serve as support;
→ it is possible that a test of the gap will form on the chart and growth will at least reach the mid-channel level of USD 500 per share.
According to analysts surveyed by TipRank, the average price forecast for UMH shares is USD 591.29 in 12 months (more than +25% from the current price).
Buy and sell stocks of the world's biggest publicly-listed companies with CFDs on FXOpen’s trading platform. Open your FXOpen account now or learn more about trading share CFDs with FXOpen.
CFDs are complex instruments and come with a high risk of losing your money.
This article represents the opinion of the Companies operating under the FXOpen brand only. It is not to be construed as an offer, solicitation, or recommendation with respect to products and services provided by the Companies operating under the FXOpen brand, nor is it to be considered financial advice.
UnitedHealth (UNH) Share Price Surges after Strong Report
UnitedHealth shares surged Tuesday, rising more than 5% after the health care giant delivered stronger-than-expected first-quarter 2024 results:
→ earnings per share: actual = USD 6.91, expected = USD 6.61, last quarter = USD 6.16;
→ gross income: actual = USD 94.4 billion, expected = USD 92.1 billion.
UnitedHealth CEO Andrew Whitty said health care costs rose sharply last year, and he attributed much of the rise to the effects of the Covid-19 pandemic.
Also adding positive news to investors was UnitedHealth Group's handling of the Feb. 21 cyberattack on its Change Healthcare subsidiary, which disrupted hospital and pharmacy operations for more than a week and cost an estimated USD 872 million.
Technical analysis of the UNH stock chart shows that:
→ starting in 2022, the price moves within the range between support at USD 450 and resistance at USD 550 per share;
→ false breakouts of the indicated levels occurred repeatedly;
→ as a result of the publication of the report, another false breakdown of support was formed at USD 450 per UNH share;
→ growth after the report occurred with a gap in the area of USD 450-465, which can serve as support;
→ it is possible that a test of the gap will form on the chart and growth will at least reach the mid-channel level of USD 500 per share.
According to analysts surveyed by TipRank, the average price forecast for UMH shares is USD 591.29 in 12 months (more than +25% from the current price).
Buy and sell stocks of the world's biggest publicly-listed companies with CFDs on FXOpen’s trading platform. Open your FXOpen account now or learn more about trading share CFDs with FXOpen.
CFDs are complex instruments and come with a high risk of losing your money.
This article represents the opinion of the Companies operating under the FXOpen brand only. It is not to be construed as an offer, solicitation, or recommendation with respect to products and services provided by the Companies operating under the FXOpen brand, nor is it to be considered financial advice.
👍2
#marketanalysis #MarketNews #inflation #stockmarket
UK100 Share Index Rises as UK Inflation Slows
Yesterday, the UK Office for National Statistics (ONS) reported that the CPI stood at 3.2% in March. According to ForexFactory, analysts expected 3.1%, and a month ago the index was 3.4%.
Grant Fitzner, chief economist at the ONS, said: “Once again, food prices were the main reason for the fall, with prices rising by less than we saw a year ago. Similarly to last month, we saw a partial offset from rising fuel prices.”
Thus, actual inflation in the UK fell to its lowest level in two and a half years. According to Yahoo Finance, this weakening of inflation could influence the Bank of England to start cutting interest rates from the current level of 5.25% in June.
In anticipation of an easing of monetary policy, the values of the UK stock index UK100 increased yesterday. Today it is above the 7,900 level.
Technical analysis of the UK100 chart today shows that:
→ the price forms an ascending channel (shown in blue);
→ the rise in the price of UK100 from the current week’s low forms a rebound from the support block, which is formed by the lower border of this channel and the former resistance 7,800.
At the same time, the bearish arguments remain powerful:
→ pay attention to the sharp rate of decline in A→B;
→ the UK100 price has broken down the intermediate trend line (shown in black).
Will the market be able to resume the rally indicated by the blue channel? Important information about the seriousness of bullish sentiment in the UK stock market can be provided by the behavior of the UK100 price, namely its ability to rise above the median line of the channel and above the level of 50% of the decline (A→B).
Trade global index CFDs with zero commission and tight spreads. Open your FXOpen account now or learn more about trading index CFDs with FXOpen.
CFDs are complex instruments and come with a high risk of losing your money.
This article represents the opinion of the Companies operating under the FXOpen brand only. It is not to be construed as an offer, solicitation, or recommendation with respect to products and services provided by the Companies operating under the FXOpen brand, nor is it to be considered financial advice.
UK100 Share Index Rises as UK Inflation Slows
Yesterday, the UK Office for National Statistics (ONS) reported that the CPI stood at 3.2% in March. According to ForexFactory, analysts expected 3.1%, and a month ago the index was 3.4%.
Grant Fitzner, chief economist at the ONS, said: “Once again, food prices were the main reason for the fall, with prices rising by less than we saw a year ago. Similarly to last month, we saw a partial offset from rising fuel prices.”
Thus, actual inflation in the UK fell to its lowest level in two and a half years. According to Yahoo Finance, this weakening of inflation could influence the Bank of England to start cutting interest rates from the current level of 5.25% in June.
In anticipation of an easing of monetary policy, the values of the UK stock index UK100 increased yesterday. Today it is above the 7,900 level.
Technical analysis of the UK100 chart today shows that:
→ the price forms an ascending channel (shown in blue);
→ the rise in the price of UK100 from the current week’s low forms a rebound from the support block, which is formed by the lower border of this channel and the former resistance 7,800.
At the same time, the bearish arguments remain powerful:
→ pay attention to the sharp rate of decline in A→B;
→ the UK100 price has broken down the intermediate trend line (shown in black).
Will the market be able to resume the rally indicated by the blue channel? Important information about the seriousness of bullish sentiment in the UK stock market can be provided by the behavior of the UK100 price, namely its ability to rise above the median line of the channel and above the level of 50% of the decline (A→B).
Trade global index CFDs with zero commission and tight spreads. Open your FXOpen account now or learn more about trading index CFDs with FXOpen.
CFDs are complex instruments and come with a high risk of losing your money.
This article represents the opinion of the Companies operating under the FXOpen brand only. It is not to be construed as an offer, solicitation, or recommendation with respect to products and services provided by the Companies operating under the FXOpen brand, nor is it to be considered financial advice.
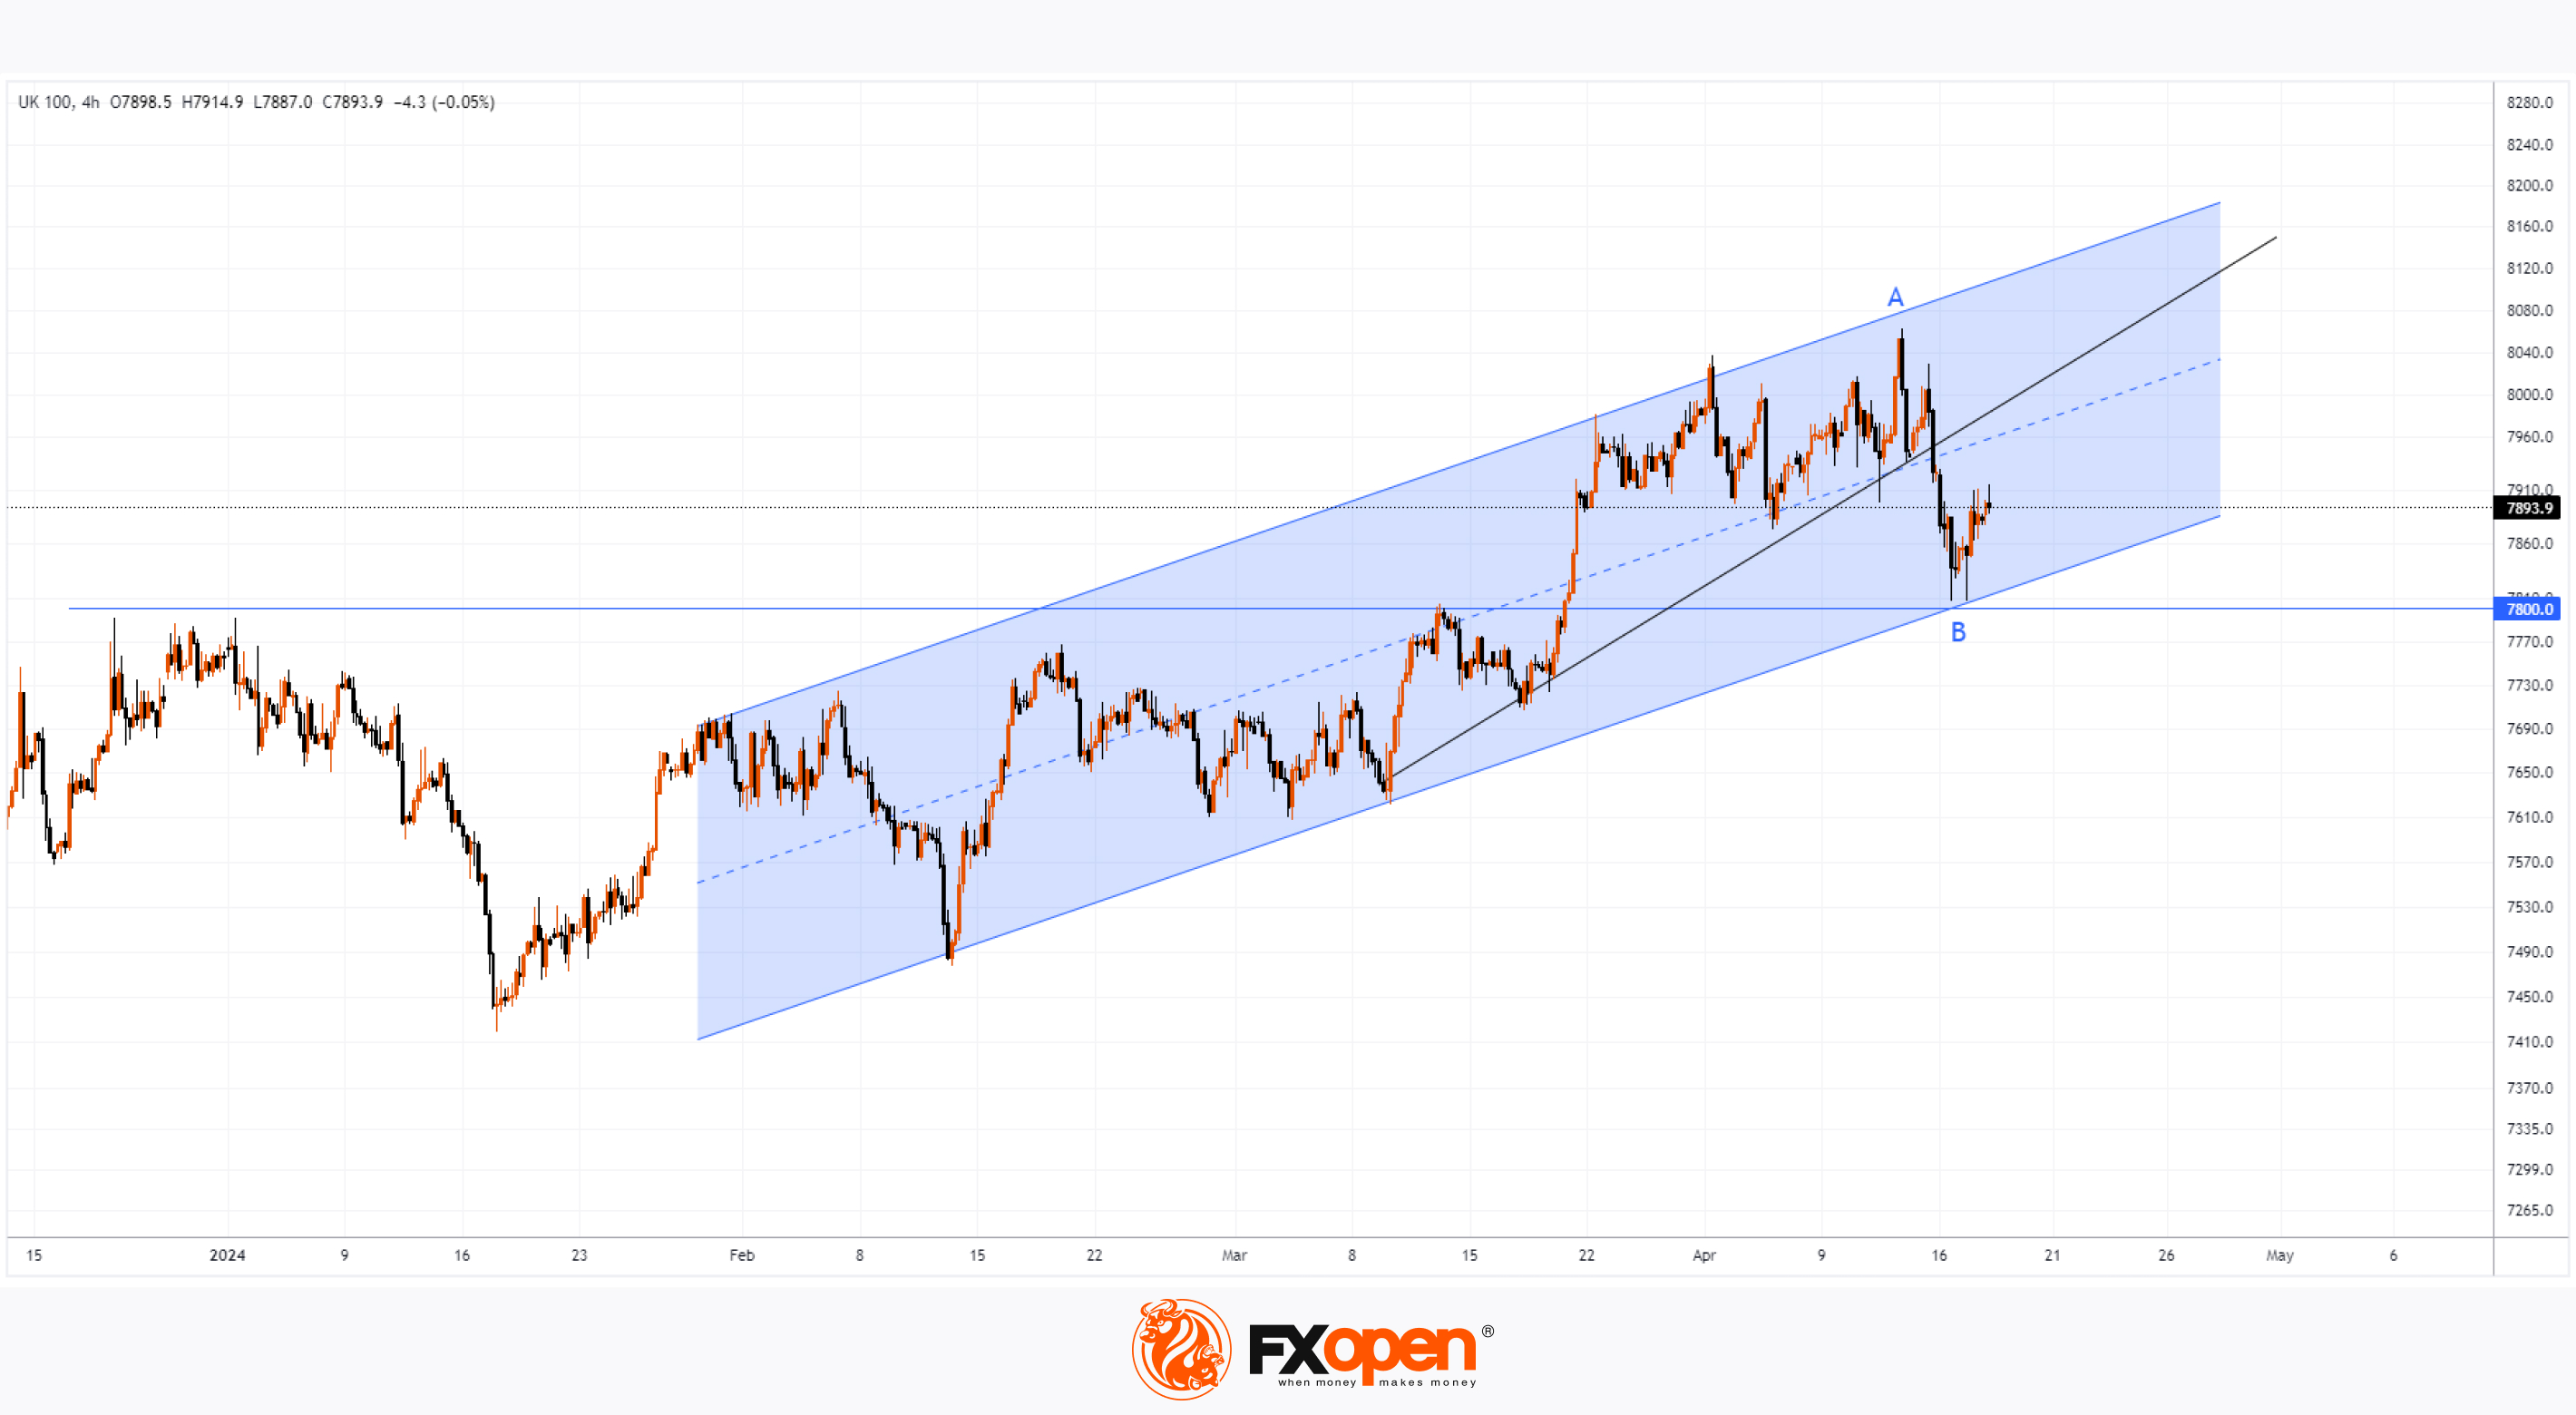
👍2
#marketanalysis #MarketNews #oilprices #oilindustry
Since the Beginning of the Week, the Price of Brent Oil Has Fallen by More than 4%
At the beginning of the week, March 15, we wrote that the price of Brent oil could form a correction from the resistance level of USD 91 per barrel. Since then, the price has decreased by more than 4% due to a number of factors:
→ easing concerns about the escalation of the conflict between Israel and Iran. Iran is the third-largest producer in the Organization of Petroleum Exporting Countries, according to Reuters, and easing its conflict with Israel reduces the likelihood of supply disruptions in the Middle East.
→ reduction in oil consumption. JP Morgan analysts noted this week that global oil consumption in April stood at 101 million barrels per day, 200,000 barrels below forecast.
→ growth in oil reserves in the USA. Crude oil inventories rose 2.7 million barrels last week, the EIA reported.
Technical analysis of the Brent oil chart shows that the price has declined to the lower boundary of the intermediate ascending channel (shown by black lines), as expected. This means that the market may experience a rebound from the level of $86, where the support zone is located, which is formed by:
→ median line of the long-term blue channel;
→ lower border of the intermediate black channel.
We note that the development of bearish sentiment will be hampered by the so-called risk premium associated with geopolitical factors.
Start trading commodity CFDs with tight spreads. Open your trading account now or learn more about trading commodity CFDs with FXOpen.
CFDs are complex instruments and come with a high risk of losing your money.
This article represents the opinion of the Companies operating under the FXOpen brand only. It is not to be construed as an offer, solicitation, or recommendation with respect to products and services provided by the Companies operating under the FXOpen brand, nor is it to be considered financial advice.
Since the Beginning of the Week, the Price of Brent Oil Has Fallen by More than 4%
At the beginning of the week, March 15, we wrote that the price of Brent oil could form a correction from the resistance level of USD 91 per barrel. Since then, the price has decreased by more than 4% due to a number of factors:
→ easing concerns about the escalation of the conflict between Israel and Iran. Iran is the third-largest producer in the Organization of Petroleum Exporting Countries, according to Reuters, and easing its conflict with Israel reduces the likelihood of supply disruptions in the Middle East.
→ reduction in oil consumption. JP Morgan analysts noted this week that global oil consumption in April stood at 101 million barrels per day, 200,000 barrels below forecast.
→ growth in oil reserves in the USA. Crude oil inventories rose 2.7 million barrels last week, the EIA reported.
Technical analysis of the Brent oil chart shows that the price has declined to the lower boundary of the intermediate ascending channel (shown by black lines), as expected. This means that the market may experience a rebound from the level of $86, where the support zone is located, which is formed by:
→ median line of the long-term blue channel;
→ lower border of the intermediate black channel.
We note that the development of bearish sentiment will be hampered by the so-called risk premium associated with geopolitical factors.
Start trading commodity CFDs with tight spreads. Open your trading account now or learn more about trading commodity CFDs with FXOpen.
CFDs are complex instruments and come with a high risk of losing your money.
This article represents the opinion of the Companies operating under the FXOpen brand only. It is not to be construed as an offer, solicitation, or recommendation with respect to products and services provided by the Companies operating under the FXOpen brand, nor is it to be considered financial advice.
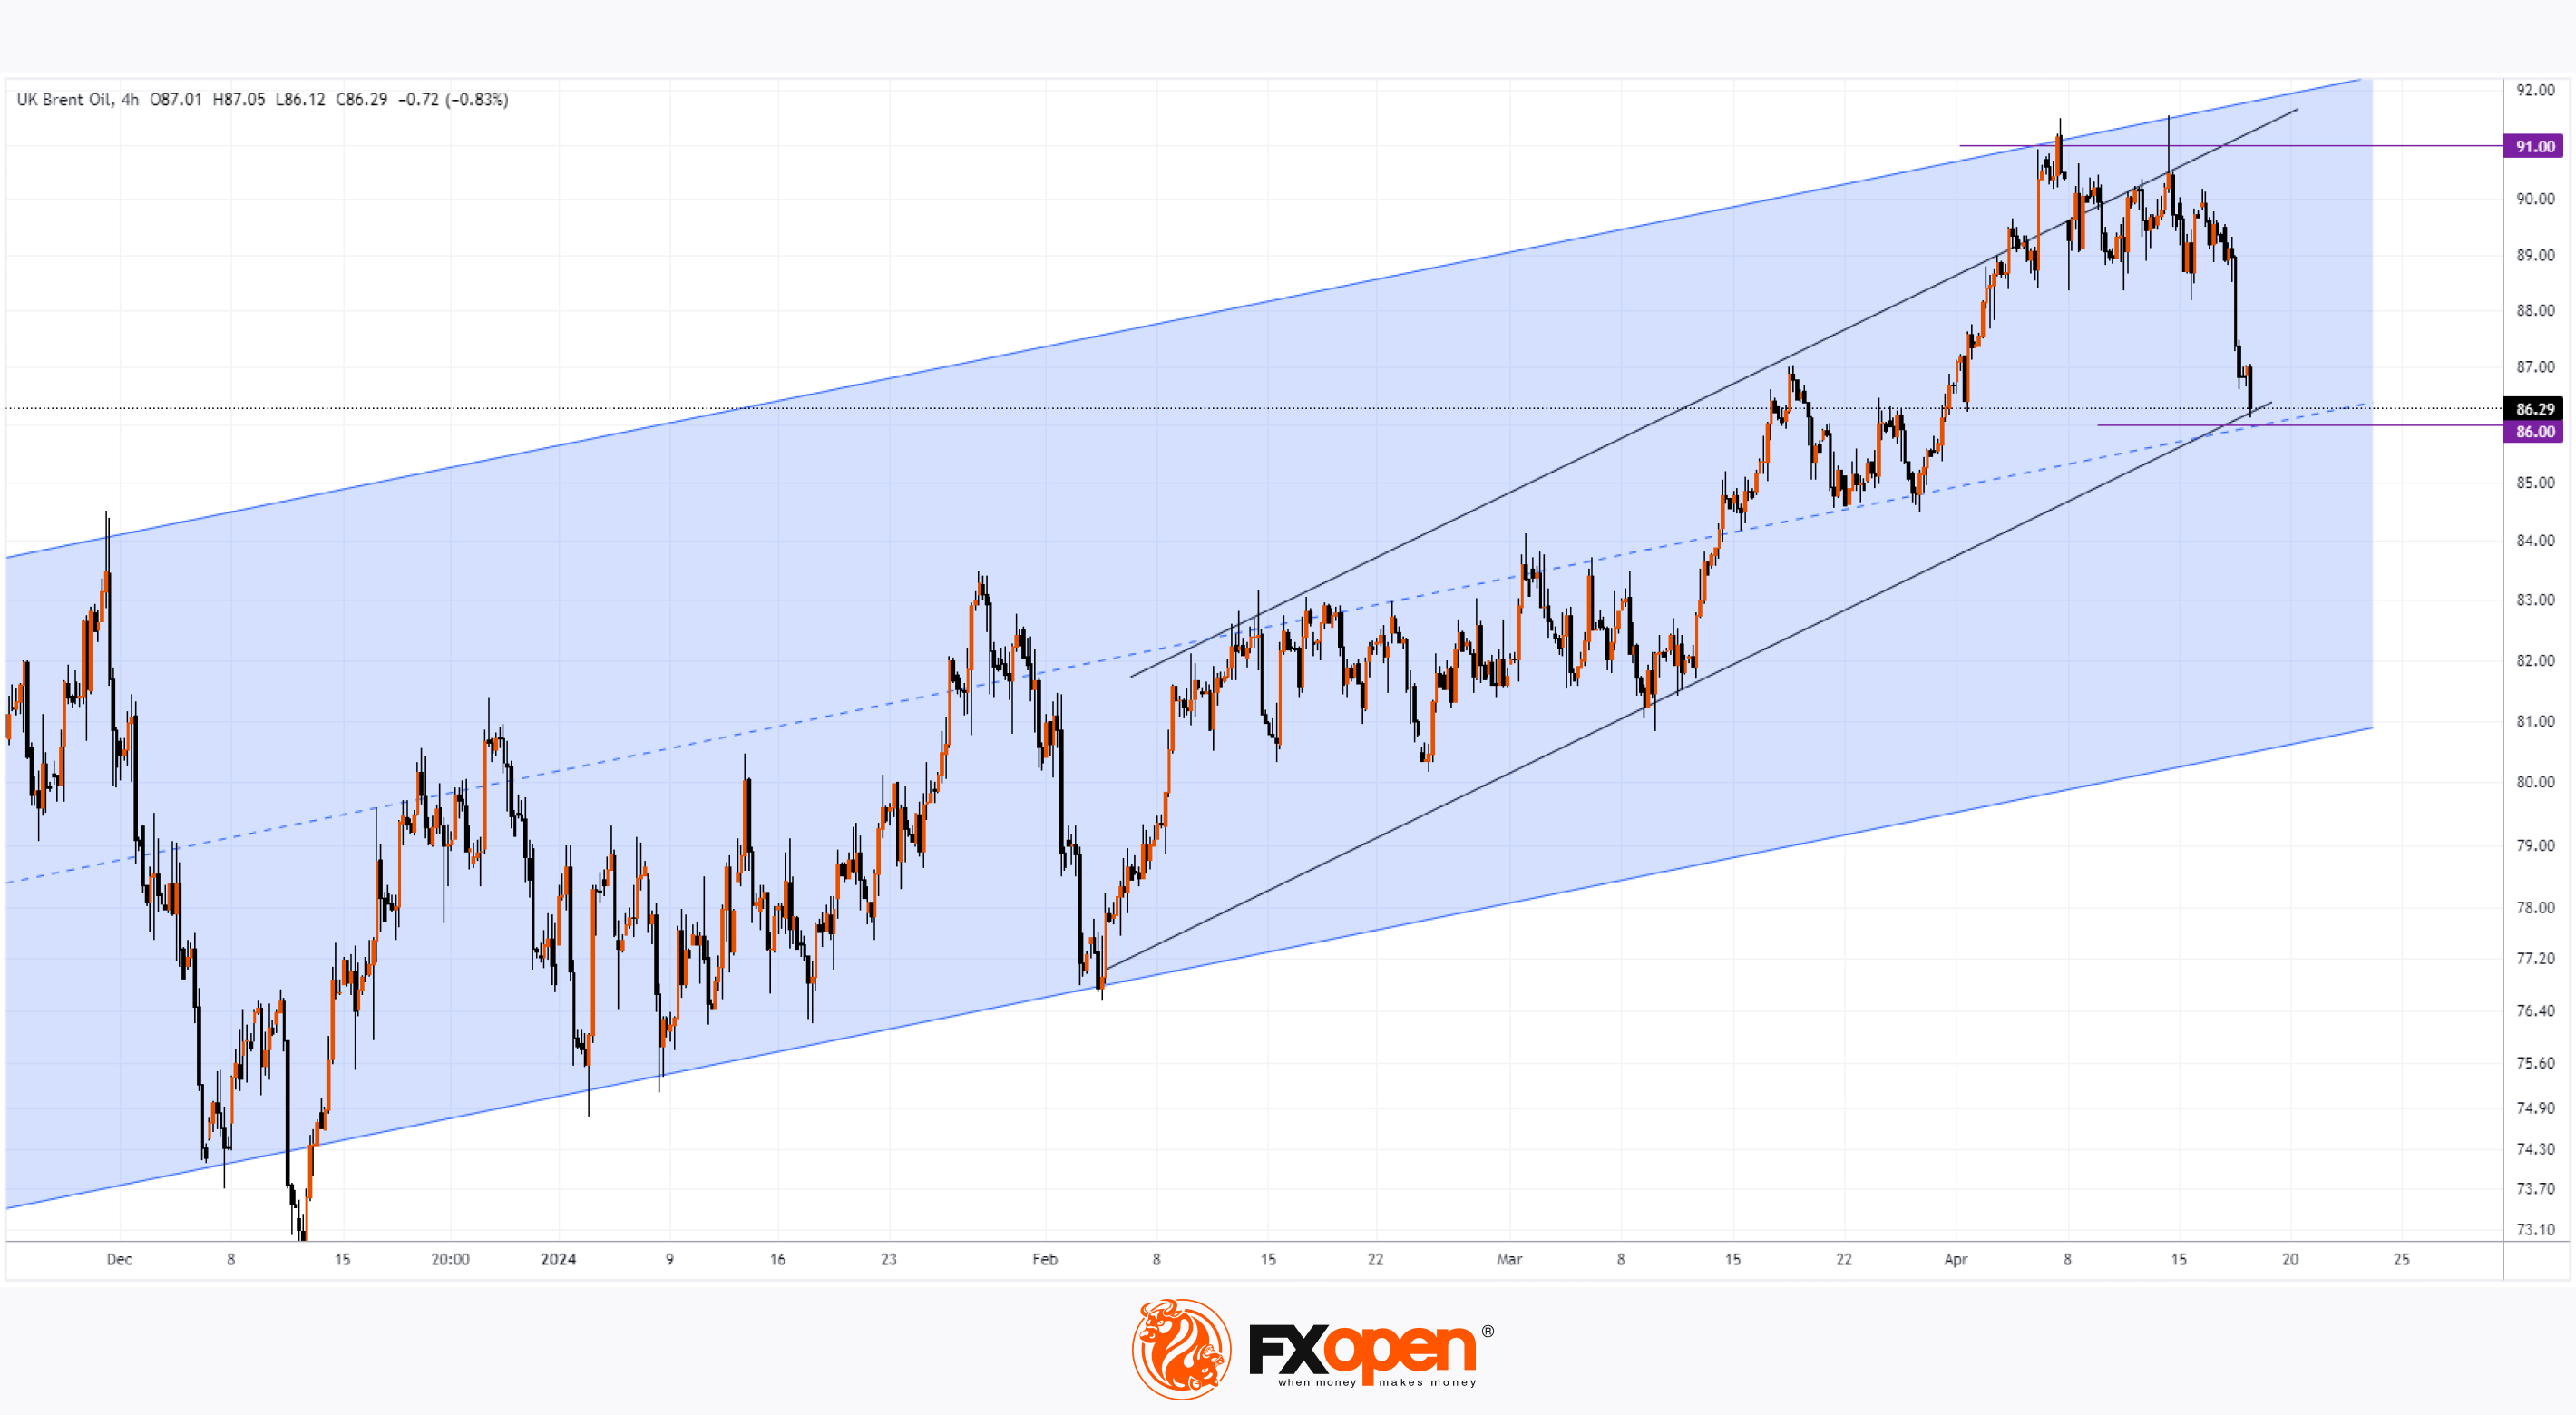
👍2
#oilprices #brentoil #MarketNews #IranIsrael
Escalation Between Iran and Israel: How the Price of Brent Oil Reacts
On the night of Thursday into Friday, reports emerged that Israel had attacked Iran following Iran's attack on Israel over the weekend.
Let's remember that we wrote on Monday that after a 300 drone and missile attack on Israel over the weekend, the price of Brent oil did not rise. Perhaps this happened because Iran's attack was then expected after the attack on its diplomatic mission, and warnings were published in the media.
And the initial reaction of financial markets to the escalation tonight looked more dramatic - there was a jump in prices for protective assets:
→ gold rose in price to USD 2,410 and above;
→ the Swiss franc and the Japanese yen have risen in price;
→ oil and US Treasury bonds rose in price.
There was also a sale of risky assets — Bitcoin, for example, fell below the USD 60k level. Moh Siong Sim, currency strategist at the Bank of Singapore, told Reuters: "It's pretty obvious the market is nervous. I think markets are at this stage in a flight-to-safety mode.”
As the morning approached, new information began to appear in Europe:
→ An Iranian official told Reuters that there was no missile attack;
→ CNN writes that Iranian air defenses intercepted three drones, and the United States did not approve of the Israeli attack;
→ According to the IAEA, there was no damage to Iran’s nuclear facilities after the Israeli strike.
→ According to ABC News, air traffic has resumed in Iran.
As a result, prices moved towards the closing levels of yesterday's trading — V-like patterns formed on the charts of the mentioned instruments.
The oil market can be considered the most susceptible to the influence of nightly news, since Iran is one of the top 10 countries in oil production.
Technical analysis of the Brent oil chart shows that:
→ the price rebounded from the level of the lower border of the ascending black channel (as we wrote yesterday);
→ however, supply forces intensified and returned the price closer to the lower border;
→ at the same time, a bearish inverted V pattern has formed on the Brent price chart today, and the median line of the channel shows signs of resistance;
→ it is also acceptable to expect that the former support at USD 88.50 will provide resistance when the price attempts to rise.
If a further round of escalation between Iran and Israel does not occur, it is possible that the Brent price will break down the current black ascending channel. And this may be welcomed by the US administration, where presidential elections are getting closer and closer.
Start trading commodity CFDs with tight spreads. Open your trading account now or learn more about trading commodity CFDs with FXOpen.
CFDs are complex instruments and come with a high risk of losing your money.
This article represents the opinion of the Companies operating under the FXOpen brand only. It is not to be construed as an offer, solicitation, or recommendation with respect to products and services provided by the Companies operating under the FXOpen brand, nor is it to be considered financial advice.
Escalation Between Iran and Israel: How the Price of Brent Oil Reacts
On the night of Thursday into Friday, reports emerged that Israel had attacked Iran following Iran's attack on Israel over the weekend.
Let's remember that we wrote on Monday that after a 300 drone and missile attack on Israel over the weekend, the price of Brent oil did not rise. Perhaps this happened because Iran's attack was then expected after the attack on its diplomatic mission, and warnings were published in the media.
And the initial reaction of financial markets to the escalation tonight looked more dramatic - there was a jump in prices for protective assets:
→ gold rose in price to USD 2,410 and above;
→ the Swiss franc and the Japanese yen have risen in price;
→ oil and US Treasury bonds rose in price.
There was also a sale of risky assets — Bitcoin, for example, fell below the USD 60k level. Moh Siong Sim, currency strategist at the Bank of Singapore, told Reuters: "It's pretty obvious the market is nervous. I think markets are at this stage in a flight-to-safety mode.”
As the morning approached, new information began to appear in Europe:
→ An Iranian official told Reuters that there was no missile attack;
→ CNN writes that Iranian air defenses intercepted three drones, and the United States did not approve of the Israeli attack;
→ According to the IAEA, there was no damage to Iran’s nuclear facilities after the Israeli strike.
→ According to ABC News, air traffic has resumed in Iran.
As a result, prices moved towards the closing levels of yesterday's trading — V-like patterns formed on the charts of the mentioned instruments.
The oil market can be considered the most susceptible to the influence of nightly news, since Iran is one of the top 10 countries in oil production.
Technical analysis of the Brent oil chart shows that:
→ the price rebounded from the level of the lower border of the ascending black channel (as we wrote yesterday);
→ however, supply forces intensified and returned the price closer to the lower border;
→ at the same time, a bearish inverted V pattern has formed on the Brent price chart today, and the median line of the channel shows signs of resistance;
→ it is also acceptable to expect that the former support at USD 88.50 will provide resistance when the price attempts to rise.
If a further round of escalation between Iran and Israel does not occur, it is possible that the Brent price will break down the current black ascending channel. And this may be welcomed by the US administration, where presidential elections are getting closer and closer.
Start trading commodity CFDs with tight spreads. Open your trading account now or learn more about trading commodity CFDs with FXOpen.
CFDs are complex instruments and come with a high risk of losing your money.
This article represents the opinion of the Companies operating under the FXOpen brand only. It is not to be construed as an offer, solicitation, or recommendation with respect to products and services provided by the Companies operating under the FXOpen brand, nor is it to be considered financial advice.
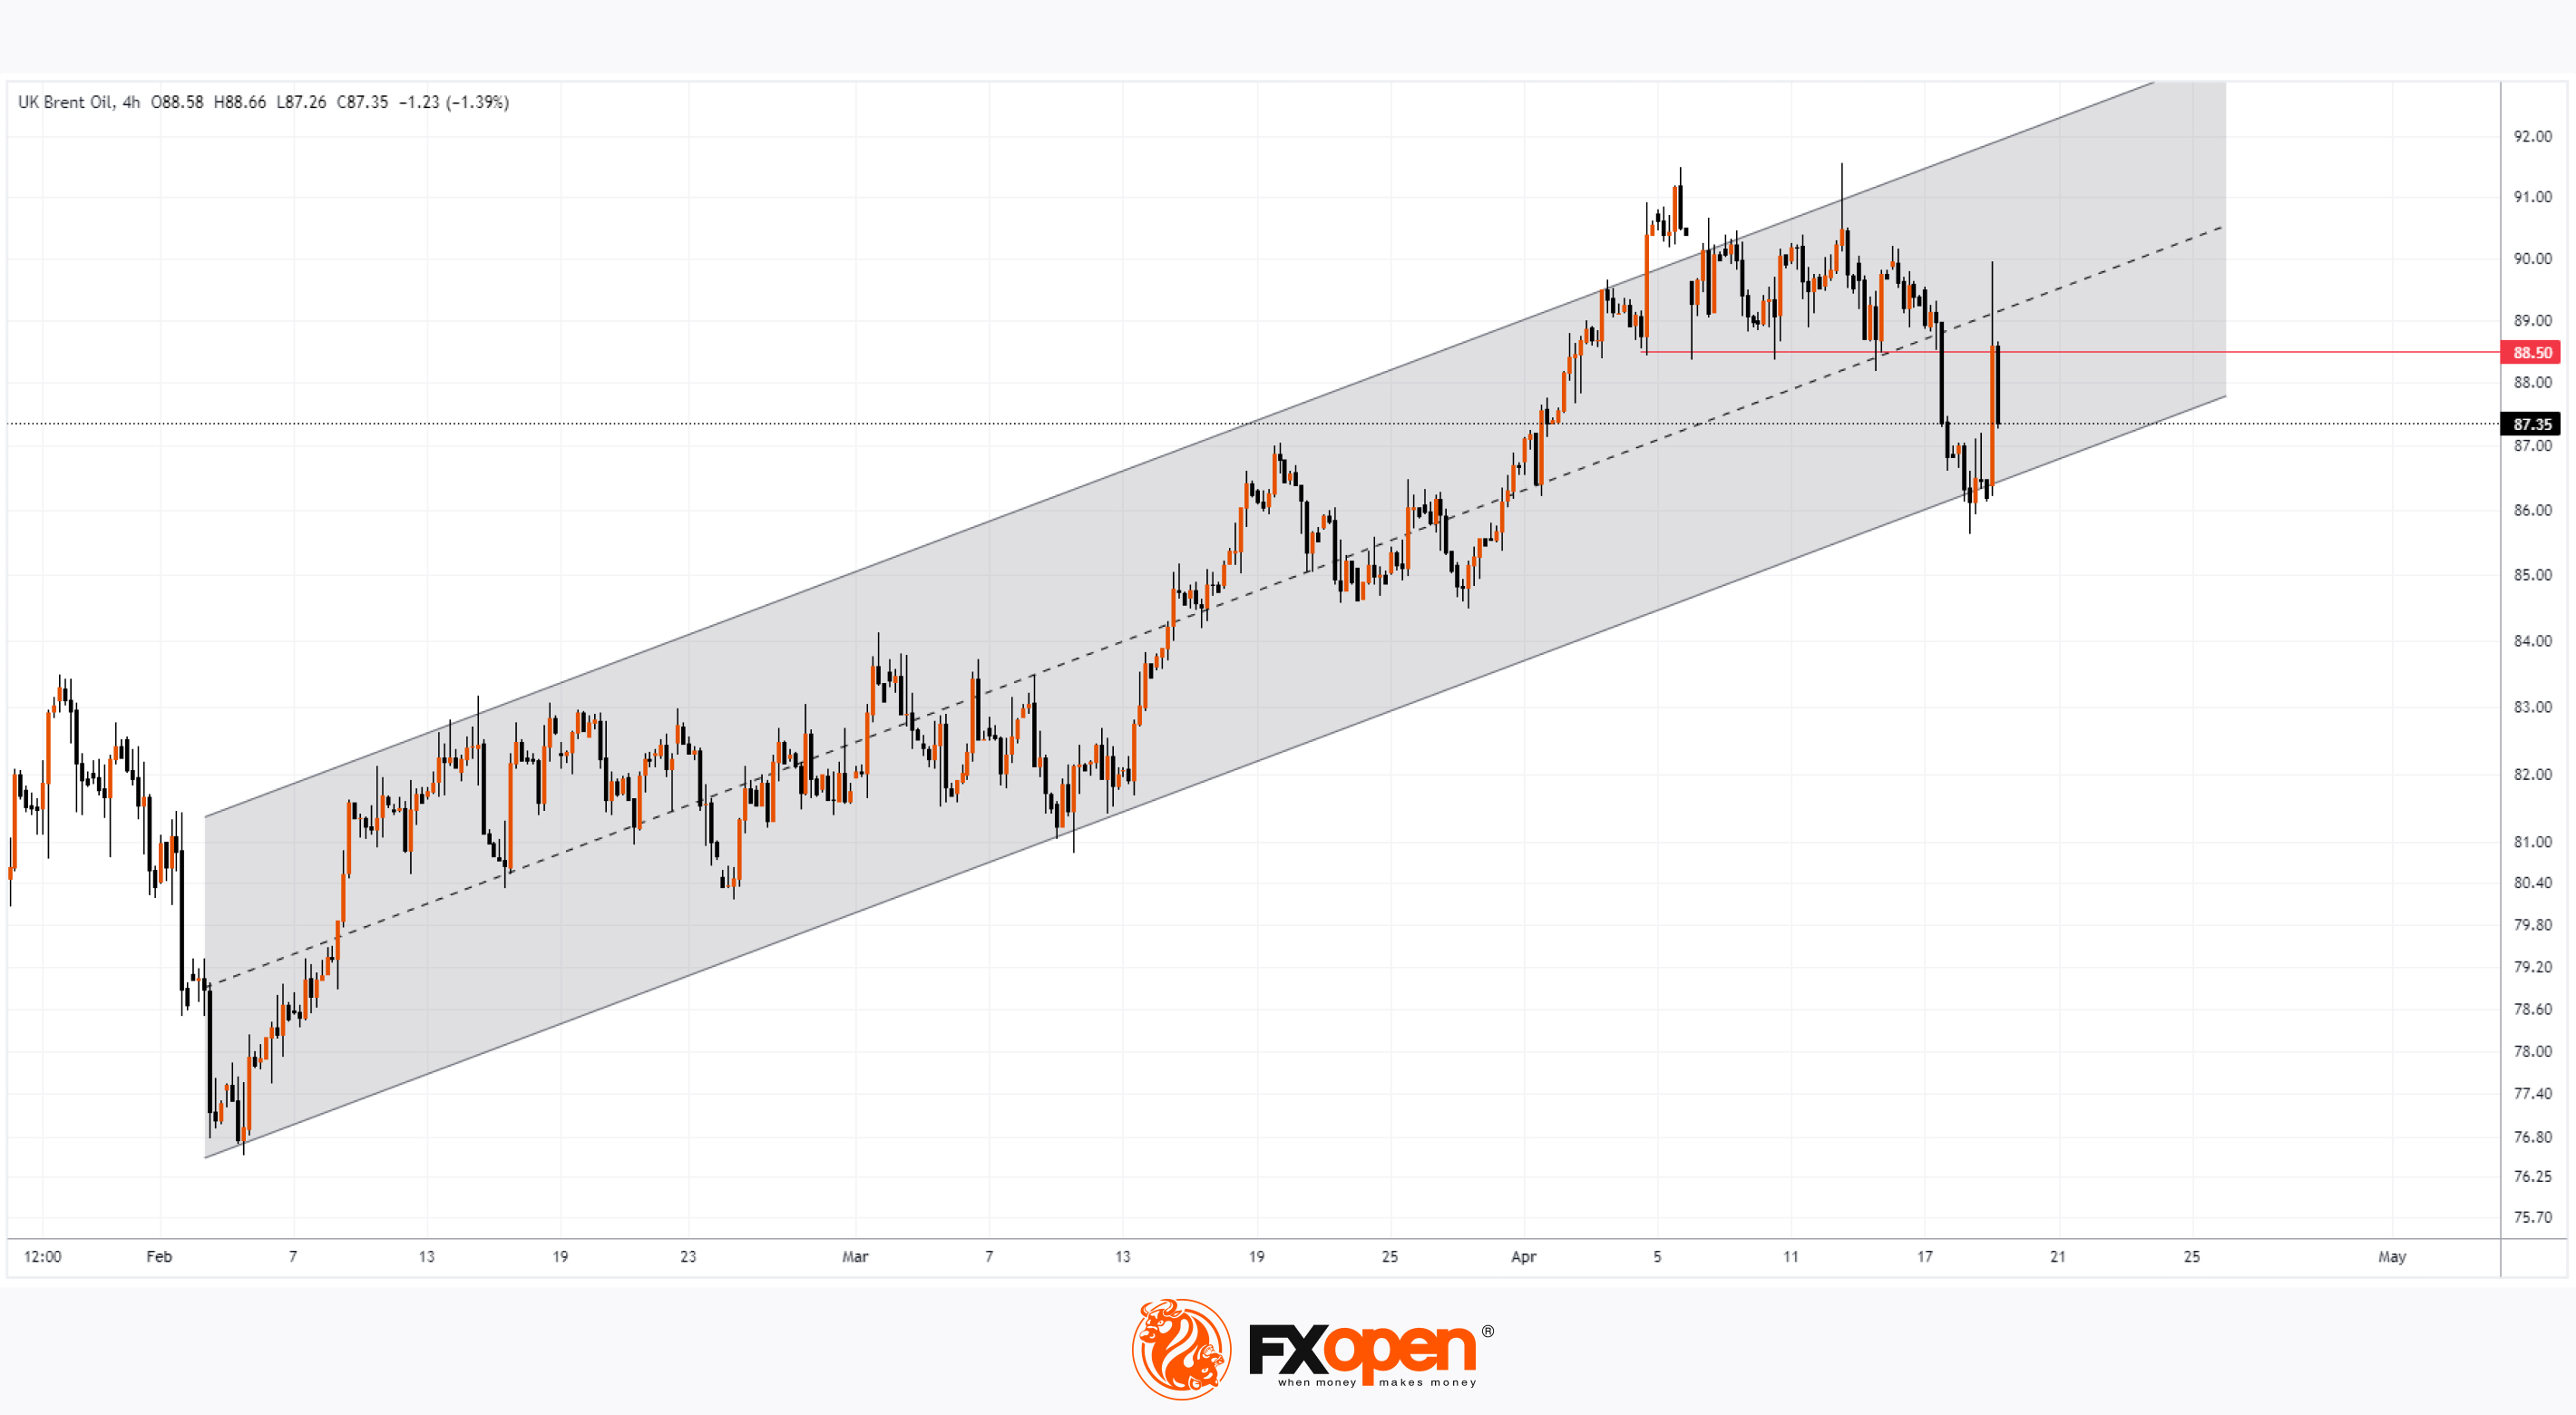
👍2
#stockmarket #NFLX #MarketNews
NFLX Stock Price Falls Despite Subscriber Growth
Yesterday, after the close of the main trading session on the stock market, Netflix reported to investors for the 1st quarter of 2024.
The report turned out better than expected:
→ earnings per share: actual = USD 5.28, forecast = USD 4.52;
→ gross income: actual = USD 9.40 billion, forecast = USD 9.27.
→ The number of subscribers increased by 9.3 million (expected +4.8 million).
However, NFLX's pre-market share price today is hovering around USD 580, about 6% below yesterday's closing price.
Negativity manifested itself in:
→ disappointing forecasts for the 2nd quarter;
→ investors also did not like the decision to stop providing quarterly reports on changes in the number of subscribers next year.
If NFLX stock opens today around the USD 580 level, then it would indicate that the market has moved down to the lower boundary of the parallel channel (shown in blue).
According to the technical analysis of NFLX stock:
→ a bearish gap may form on the chart, which is usually assessed as an obstacle to price growth;
→ the psychological level of USD 600 per NFLX share may act as resistance;
→ rounding pattern (shown by a red arc) – a sign of depletion of demand.
Even if the NFLX stock price forms a bounce from the lower boundary of the channel, bulls will have to contend with the technical hurdles outlined above. And also negative fundamental factors associated with the fact that the Fed will hold interest rates for a longer time.
According to the average consensus of analysts surveyed by TipRanks, the projected 12-month stock price for NFLX stock is USD 637.29.
Buy and sell stocks of the world's biggest publicly-listed companies with CFDs on FXOpen’s trading platform. Open your FXOpen account now or learn more about trading share CFDs with FXOpen.
CFDs are complex instruments and come with a high risk of losing your money.
This article represents the opinion of the Companies operating under the FXOpen brand only. It is not to be construed as an offer, solicitation, or recommendation with respect to products and services provided by the Companies operating under the FXOpen brand, nor is it to be considered financial advice.
NFLX Stock Price Falls Despite Subscriber Growth
Yesterday, after the close of the main trading session on the stock market, Netflix reported to investors for the 1st quarter of 2024.
The report turned out better than expected:
→ earnings per share: actual = USD 5.28, forecast = USD 4.52;
→ gross income: actual = USD 9.40 billion, forecast = USD 9.27.
→ The number of subscribers increased by 9.3 million (expected +4.8 million).
However, NFLX's pre-market share price today is hovering around USD 580, about 6% below yesterday's closing price.
Negativity manifested itself in:
→ disappointing forecasts for the 2nd quarter;
→ investors also did not like the decision to stop providing quarterly reports on changes in the number of subscribers next year.
If NFLX stock opens today around the USD 580 level, then it would indicate that the market has moved down to the lower boundary of the parallel channel (shown in blue).
According to the technical analysis of NFLX stock:
→ a bearish gap may form on the chart, which is usually assessed as an obstacle to price growth;
→ the psychological level of USD 600 per NFLX share may act as resistance;
→ rounding pattern (shown by a red arc) – a sign of depletion of demand.
Even if the NFLX stock price forms a bounce from the lower boundary of the channel, bulls will have to contend with the technical hurdles outlined above. And also negative fundamental factors associated with the fact that the Fed will hold interest rates for a longer time.
According to the average consensus of analysts surveyed by TipRanks, the projected 12-month stock price for NFLX stock is USD 637.29.
Buy and sell stocks of the world's biggest publicly-listed companies with CFDs on FXOpen’s trading platform. Open your FXOpen account now or learn more about trading share CFDs with FXOpen.
CFDs are complex instruments and come with a high risk of losing your money.
This article represents the opinion of the Companies operating under the FXOpen brand only. It is not to be construed as an offer, solicitation, or recommendation with respect to products and services provided by the Companies operating under the FXOpen brand, nor is it to be considered financial advice.
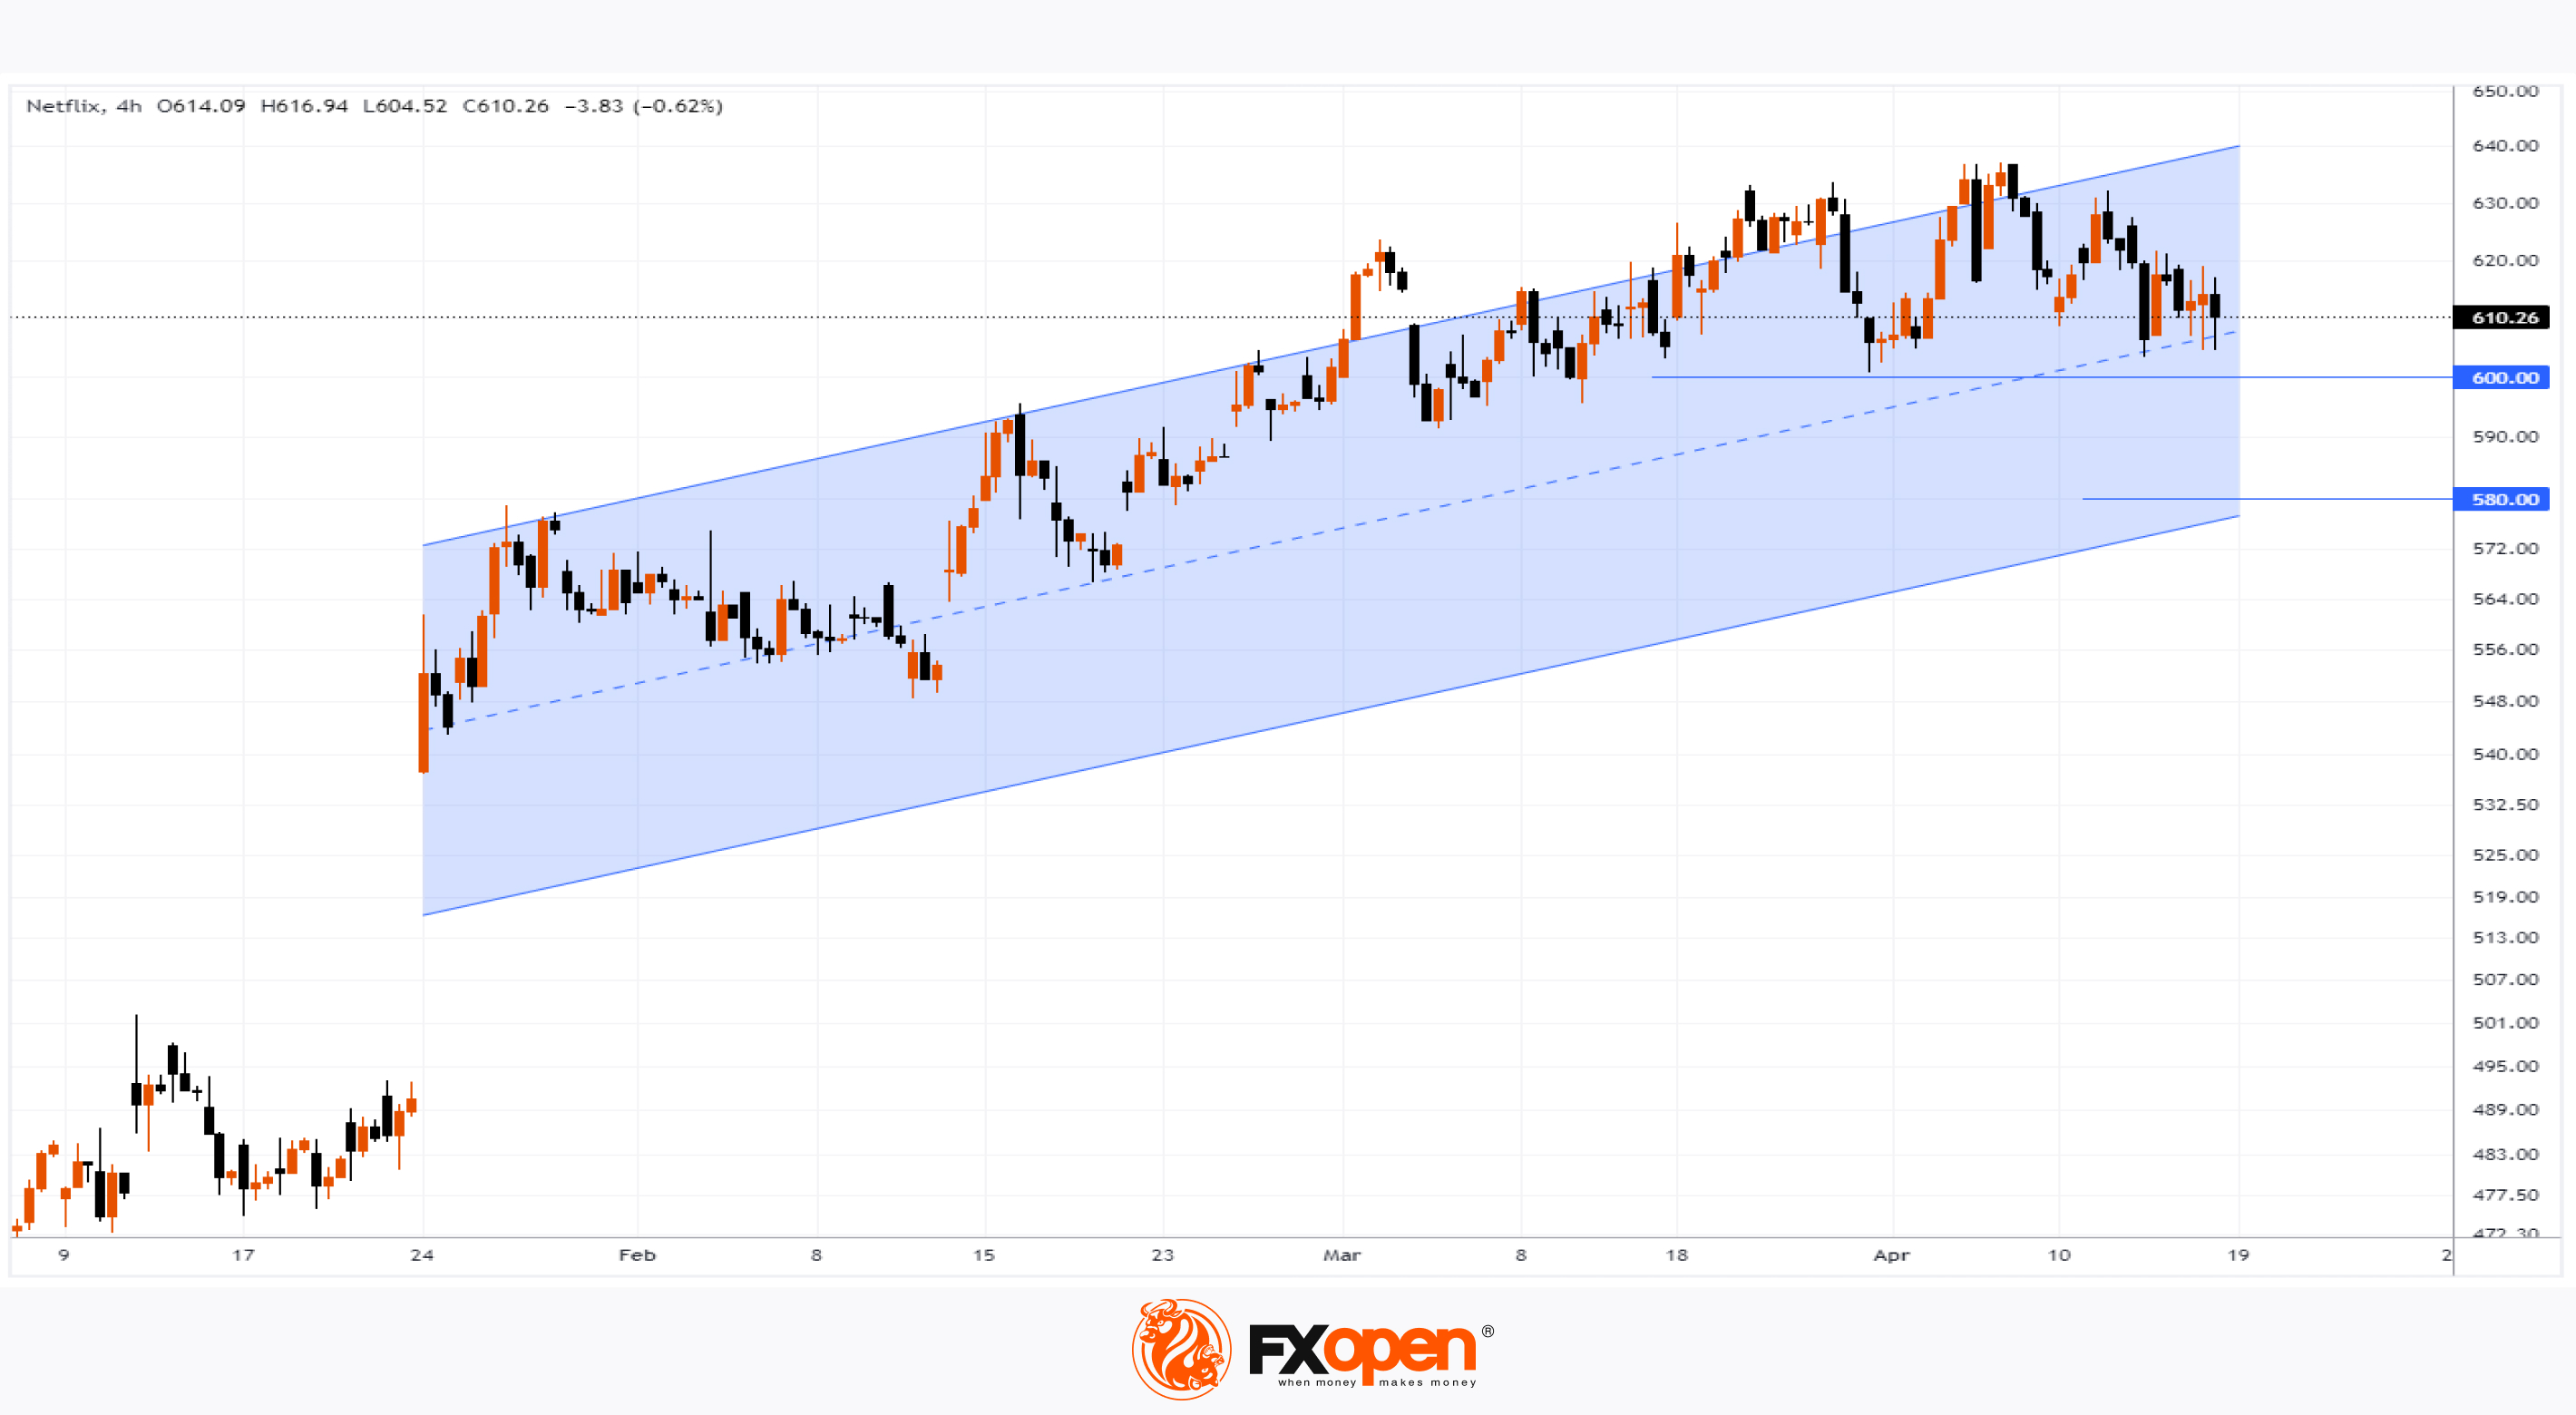
👍2