Hi, traders! Here's what you need to know to start trading today!
The Fed held a much-awaited meeting yesterday. The bank hasn’t made any policy changes and said that although the US economy is making progress, it’s not enough to taper yet. As a result, the USD weakened and EUR/USD rocketed.
China’s government eased its pressure on the country’s companies and allowed local firms to go public in the US. The Hang Seng Index (HK50) surged after that report!
Biden’s $1 trillion infrastructure plan was approved by the Senate. It is good news for electric vehicles producers such as Tesla, Ford, and General Motors as $7.5 billion will be spent on electric vehicle charging stations.
Oil surged due to the declining crude oil inventories as it showed the increasing oil demand. Bitcoin is moving sideways around $40,000, holding this week’s recovery.
Facebook reported better-than-expected earnings results for the second quarter. However, it cautioned investors with a risk of slower growth because of Apple’s advertising regulatory changes. Pfizer rocketed after strong earnings data. PayPal posted mixed results but still closed in green.
Trade ideas for EUR/USD and Gold https://bit.ly/378bvys
The Fed held a much-awaited meeting yesterday. The bank hasn’t made any policy changes and said that although the US economy is making progress, it’s not enough to taper yet. As a result, the USD weakened and EUR/USD rocketed.
China’s government eased its pressure on the country’s companies and allowed local firms to go public in the US. The Hang Seng Index (HK50) surged after that report!
Biden’s $1 trillion infrastructure plan was approved by the Senate. It is good news for electric vehicles producers such as Tesla, Ford, and General Motors as $7.5 billion will be spent on electric vehicle charging stations.
Oil surged due to the declining crude oil inventories as it showed the increasing oil demand. Bitcoin is moving sideways around $40,000, holding this week’s recovery.
Facebook reported better-than-expected earnings results for the second quarter. However, it cautioned investors with a risk of slower growth because of Apple’s advertising regulatory changes. Pfizer rocketed after strong earnings data. PayPal posted mixed results but still closed in green.
Trade ideas for EUR/USD and Gold https://bit.ly/378bvys
FBS
Weak USD, Gold and China's Stocks Recover
The Fed held a much-awaited meeting yesterday. The bank hasn’t made any policy changes. As a result, the USD weakened and EUR/USD rocketed. Jump in to know all the latest news!
#MarketAnalysis
🎬 The daily video is also here. Watch to get trade ideas for the day! What do you plan to trade?
➡ https://bit.ly/3fraBBR
🎬 The daily video is also here. Watch to get trade ideas for the day! What do you plan to trade?
➡ https://bit.ly/3fraBBR

💥Live Trading Update
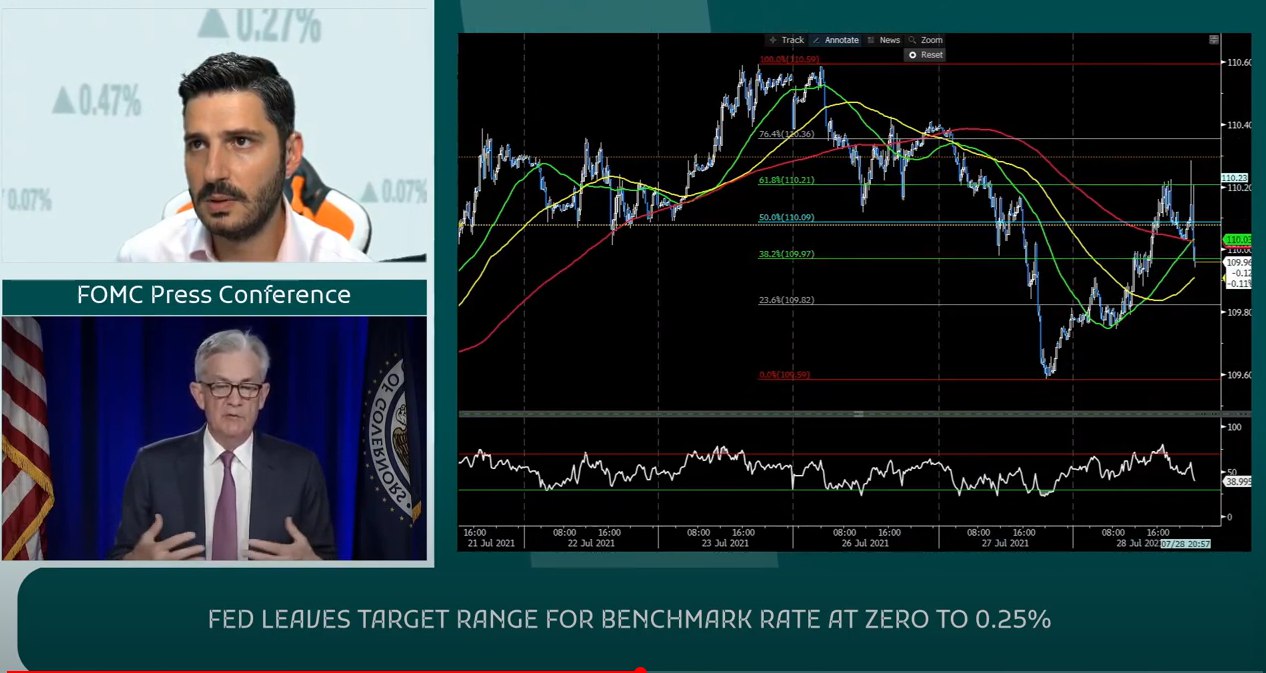
During yesterday's live stream at our YouTube channel (https://youtu.be/8-ebzBo2tJ8), FBS analyst Nour Eldeen Al-Hammoury opened a sell trade in USD/JPY.
Here's what he says now: "I decided to short USD/JPY not just because I want to, but after reading the Federal Reserve statement, which showed NO change and no new information about tapering.'
➡ What happened with the trade? Click to find out: https://bit.ly/378a6I4
During yesterday's live stream at our YouTube channel (https://youtu.be/8-ebzBo2tJ8), FBS analyst Nour Eldeen Al-Hammoury opened a sell trade in USD/JPY.
Here's what he says now: "I decided to short USD/JPY not just because I want to, but after reading the Federal Reserve statement, which showed NO change and no new information about tapering.'
➡ What happened with the trade? Click to find out: https://bit.ly/378a6I4
#TradingNews
💥US Advance GDP will be out today!
What will happen?
The US Q2 Gross Domestic Product will be announced at 15:30 MT time (GMT+3). It is the broadest measure of economic activity and the primary gauge of the economy's health. There are three versions of GDP released a month apart – Advance, Preliminary, and Final. The Advance release is the earliest and thus tends to have the most impact.
In the first quarter, the US GDP growth equaled 6.4%, which was lower than anticipated. Investors took this news in a positive way though as they paid more attention to the difference with the Q4 2020 result, which was 4.3%, and 6.4% in Q1, 2021.
💰How to trade on the US GPD statement?
Traders will want to see whether the actual numbers exceed market expectations or not as this will have the greatest impact on the USD.
⬆ If the actual GDP data is higher than was expected, the USD will strengthen.
⬇ If the actual GDP data is lower than it was expected, the USD will weaken.
Instruments to trade: AUD/USD, USD/CAD, NZD/USD
💥US Advance GDP will be out today!
What will happen?
The US Q2 Gross Domestic Product will be announced at 15:30 MT time (GMT+3). It is the broadest measure of economic activity and the primary gauge of the economy's health. There are three versions of GDP released a month apart – Advance, Preliminary, and Final. The Advance release is the earliest and thus tends to have the most impact.
In the first quarter, the US GDP growth equaled 6.4%, which was lower than anticipated. Investors took this news in a positive way though as they paid more attention to the difference with the Q4 2020 result, which was 4.3%, and 6.4% in Q1, 2021.
💰How to trade on the US GPD statement?
Traders will want to see whether the actual numbers exceed market expectations or not as this will have the greatest impact on the USD.
⬆ If the actual GDP data is higher than was expected, the USD will strengthen.
⬇ If the actual GDP data is lower than it was expected, the USD will weaken.
Instruments to trade: AUD/USD, USD/CAD, NZD/USD
#Education #TradingStrategy
🔥Meet Ultra-fast Scalping Strategy🔥
Here's a trading strategy that will allow you to open trades on the M1 timeframe! Entry and exit rules are straightforward. Sounds great, right?
➡ Check the link to learn more: https://bit.ly/3BPICFk
🔥Meet Ultra-fast Scalping Strategy🔥
Here's a trading strategy that will allow you to open trades on the M1 timeframe! Entry and exit rules are straightforward. Sounds great, right?
➡ Check the link to learn more: https://bit.ly/3BPICFk

#EconomicCalendar
📣 US Advance GDP q/q is out!
😔 Actual: 6.5%
Forecast: 8.5%
Previous: 6.4%
📈 What does it mean for the market?
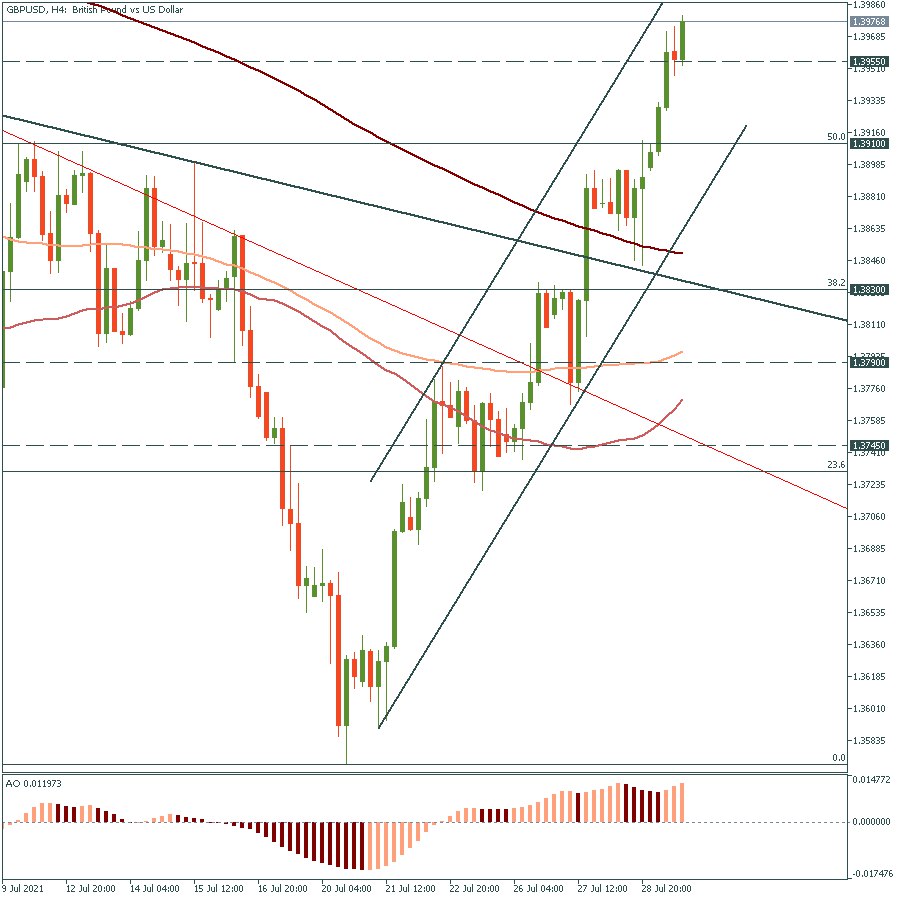
⬇ The USD is weakening in all pairs. If USD/CHF slides below 0.9070, it may fall to 0.9000. GBP/USD is moving towards 1.3990. USD/CAD may slide to 1.2430.
📣 US Advance GDP q/q is out!
😔 Actual: 6.5%
Forecast: 8.5%
Previous: 6.4%
📈 What does it mean for the market?
⬇ The USD is weakening in all pairs. If USD/CHF slides below 0.9070, it may fall to 0.9000. GBP/USD is moving towards 1.3990. USD/CAD may slide to 1.2430.
Hi, guys! How are doing? Let's trade EUR/USD and Gold! Before that, we recommend reading the key market news:
The US has published the poor Advance GDP report. The Advance release is the most impactful. US jobless claims and pending home sales fell short of analysts’ forecasts too. The USD dropped yesterday, but today started reversing up.
Nasdaq 100 dropped more than 1% as Amazon released less than expected sales and revenue. It signaled that Amazon’s rapid growth through the pandemic waned, that’s why investors started selling the stock. However, Amazon is well-positioned in the long term, that’s why wait for the stock to slide a bit more and consider buying the dips.
Stock prices are volatile this week amid China’s pressures on its big-cap companies and earning season. The Fed’s expansive monetary policy continues to support broad market sentiment after Jerome Powell claimed the central bank will pare back stimulus gradually and if the US economy makes enough progress.
Watch the video to get trade ideas on EUR/USD and gold
Read the article with a trading plan for today
The US has published the poor Advance GDP report. The Advance release is the most impactful. US jobless claims and pending home sales fell short of analysts’ forecasts too. The USD dropped yesterday, but today started reversing up.
Nasdaq 100 dropped more than 1% as Amazon released less than expected sales and revenue. It signaled that Amazon’s rapid growth through the pandemic waned, that’s why investors started selling the stock. However, Amazon is well-positioned in the long term, that’s why wait for the stock to slide a bit more and consider buying the dips.
Stock prices are volatile this week amid China’s pressures on its big-cap companies and earning season. The Fed’s expansive monetary policy continues to support broad market sentiment after Jerome Powell claimed the central bank will pare back stimulus gradually and if the US economy makes enough progress.
Watch the video to get trade ideas on EUR/USD and gold
Read the article with a trading plan for today
YouTube
Trading EUR/USD & Gold, and Amazon on Friday
Watch the video to know how to trade EUR/USD, gold, and oil now! Besides, our analyst will discuss Amazon's earnings results.
Retracement in trading: https://bit.ly/3iVS55a
Join us in Telegram: https://t.me/fbsanalytics
00:00 - Intro
00:30 - US reveals…
Retracement in trading: https://bit.ly/3iVS55a
Join us in Telegram: https://t.me/fbsanalytics
00:00 - Intro
00:30 - US reveals…
#MarketAnalysis
🙃What awaits AUD/USD? It seems like there's an interesting trade opportunity in this currency pair ahead of the Reserve Bank of Australia's meeting on Tuesday.
➡ Check the article to know more: https://bit.ly/3fcvFvM
🙃What awaits AUD/USD? It seems like there's an interesting trade opportunity in this currency pair ahead of the Reserve Bank of Australia's meeting on Tuesday.
➡ Check the article to know more: https://bit.ly/3fcvFvM
All eyes are on Amazon! 🔥
The world’s biggest e-commerce retailer reported sales worse than expected. As a result, the stock has opened with a huge gap down. Just look at the picture below.
However, Amazon is going to rise in the long term with a high probability. Thus, the current drop is great for most investors as they will have an opportunity to buy the dips!
Read more https://bit.ly/3fdn2kh
The world’s biggest e-commerce retailer reported sales worse than expected. As a result, the stock has opened with a huge gap down. Just look at the picture below.
However, Amazon is going to rise in the long term with a high probability. Thus, the current drop is great for most investors as they will have an opportunity to buy the dips!
Read more https://bit.ly/3fdn2kh

#Education
Pivot Points: Can You Predict the Future?
📈What is the purpose of Pivot Points?
Traders use pivot points to set support and resistance levels. These levels are calculated based on a previous trading period’s open, close, high, and low prices. The period might be 4 hours, day, week, or even month, depending on a trading strategy.
There are several methods of calculating pivot points. We have already mentioned some of them in the article which was devoted to pivot points indicator (https://bit.ly/3l9Azxj).
As a result, a trader gets several horizontal lines on the chart, which are significant support and resistance levels. The number of the lines depends on a chosen calculation method and varies from 5 to 11 lines.
There is always one original pivot point and an equal number of support and resistance lines above and below it. While the pivot point levels are labeled as R1, R2, and so forth, the reality is that each level is considered support or resistance based on where the stock is trading in relation to the level.
👆When the price is above the line, it acts as support. When the price is located below the line, it acts as resistance. Pivot points are stable during the chosen period.
👦For example, if trader calculates pivot levels according to the daily data, they will be available during the next day. In case, trader decided to hold a position for several days or even weeks the best option would be to use monthly data.
How to use pivot points?
Pivot points are extremely helpful at the moments of strong trend movement when the price is far away from moving averages and other lines. The indicator can help a trader to set targets and define the trend’s ending.
Let’s look at Bitcoin’s M5 chart and figure out how pivot points work.
Bitcoin has closed its trading session on July 28 with next parameters:
• Open – 38030
• High- 40944
• Low- 37948
• Close- 39946
Using formulas:
Resistance 3 = High + 2*(Pivot - Low)
Resistance 2 = Pivot + (R1 - S1)
Resistance 1 = 2 * Pivot - Low
Pivot Point = (High + Close + Low)/3
Support 1 = 2 * Pivot - High
Support 2 = Pivot - (R1 - S1)
Support 3 = Low - 2*(High - Pivot)
We have calculated pivot points:
R3 = $44273
R2= $42608
R1= $41277
PP= $39613
S1= $38282
S2= $36617
S3= $35286
As soon as the price broke through moving averages, it dropped exactly to pivot point and started to consolidate above it. It is a perfect example of how traders can find extra support and resistance. In addition, a combination of pivot points with other technical indicators gives a massive advantage to day traders.
🙌 How to install pivot points indicator to MT5?
1. Download the file from this webpage (https://www.mql5.com/en/code/95).
2. In MT5 click “File” -> “Open data folder”.
3. Go to MQL5 -> Indicators -> Examples.
4. Copy the “pivot points” file inside the folder.
5. Restart your MT5.
6. Open “Navigator” -> “Indicators” -> “Examples”.
7. Choose pivot points indicator.
8. If pivot points did not appear, try to switch the timeframe several times.
😉 We hope that this post was useful. Would you like to have more posts like this? Write '+' in the comments if you do!
Pivot Points: Can You Predict the Future?
📈What is the purpose of Pivot Points?
Traders use pivot points to set support and resistance levels. These levels are calculated based on a previous trading period’s open, close, high, and low prices. The period might be 4 hours, day, week, or even month, depending on a trading strategy.
There are several methods of calculating pivot points. We have already mentioned some of them in the article which was devoted to pivot points indicator (https://bit.ly/3l9Azxj).
As a result, a trader gets several horizontal lines on the chart, which are significant support and resistance levels. The number of the lines depends on a chosen calculation method and varies from 5 to 11 lines.
There is always one original pivot point and an equal number of support and resistance lines above and below it. While the pivot point levels are labeled as R1, R2, and so forth, the reality is that each level is considered support or resistance based on where the stock is trading in relation to the level.
👆When the price is above the line, it acts as support. When the price is located below the line, it acts as resistance. Pivot points are stable during the chosen period.
👦For example, if trader calculates pivot levels according to the daily data, they will be available during the next day. In case, trader decided to hold a position for several days or even weeks the best option would be to use monthly data.
How to use pivot points?
Pivot points are extremely helpful at the moments of strong trend movement when the price is far away from moving averages and other lines. The indicator can help a trader to set targets and define the trend’s ending.
Let’s look at Bitcoin’s M5 chart and figure out how pivot points work.
Bitcoin has closed its trading session on July 28 with next parameters:
• Open – 38030
• High- 40944
• Low- 37948
• Close- 39946
Using formulas:
Resistance 3 = High + 2*(Pivot - Low)
Resistance 2 = Pivot + (R1 - S1)
Resistance 1 = 2 * Pivot - Low
Pivot Point = (High + Close + Low)/3
Support 1 = 2 * Pivot - High
Support 2 = Pivot - (R1 - S1)
Support 3 = Low - 2*(High - Pivot)
We have calculated pivot points:
R3 = $44273
R2= $42608
R1= $41277
PP= $39613
S1= $38282
S2= $36617
S3= $35286
As soon as the price broke through moving averages, it dropped exactly to pivot point and started to consolidate above it. It is a perfect example of how traders can find extra support and resistance. In addition, a combination of pivot points with other technical indicators gives a massive advantage to day traders.
🙌 How to install pivot points indicator to MT5?
1. Download the file from this webpage (https://www.mql5.com/en/code/95).
2. In MT5 click “File” -> “Open data folder”.
3. Go to MQL5 -> Indicators -> Examples.
4. Copy the “pivot points” file inside the folder.
5. Restart your MT5.
6. Open “Navigator” -> “Indicators” -> “Examples”.
7. Choose pivot points indicator.
8. If pivot points did not appear, try to switch the timeframe several times.
😉 We hope that this post was useful. Would you like to have more posts like this? Write '+' in the comments if you do!

Hi, everyone! Hope you're having a great weekend😉 To be ready for an upcoming week, check this article. There are trade ideas for EUR/USD, gold, oil, and stocks! https://bit.ly/3C05lhQ
FBS
Trade ideas for August 2-6
What events to follow and how to trade during the week of July 2-6?
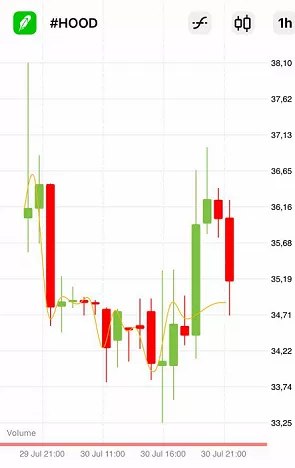
🤩Have you heard about Robinhood?
This is one of the world's most talked about financial companies. Last week it had an IPO and now you can trade the HOOD stock in the FBS Trader App.
➡ Are you eager to learn more? Check this: https://bit.ly/3jg70Ya
This is one of the world's most talked about financial companies. Last week it had an IPO and now you can trade the HOOD stock in the FBS Trader App.
➡ Are you eager to learn more? Check this: https://bit.ly/3jg70Ya
#TradingNews
🔔Will the RBA Add Strength to the Aussie?
What will happen?
The Reserve Bank of Australia (RBA) will hold a meeting and announce changes to the monetary policy on August 3, at 07:30 MT time (GMT+3). While we don’t expect any changes to the interest rate that is currently held at 0.1%, the statement itself may be interesting. The main focus will be on the yearly outlook by the bank given surging inflation (3.8% in the 2nd quarter) and the coronavirus situation in Australia.
How to trade on the RBA Interest Rate Decision?
It’s highly important to follow the statement that may contain changes to the bank’s monetary policy.
⬆ If the bank improves outlook and hints at rate hikes, the AUD will go up.
⬇ If the regulator is cautious, the AUD will slide.
Instruments to trade: AUD/USD, AUD/JPY, AUD/NZD
🔔Will the RBA Add Strength to the Aussie?
What will happen?
The Reserve Bank of Australia (RBA) will hold a meeting and announce changes to the monetary policy on August 3, at 07:30 MT time (GMT+3). While we don’t expect any changes to the interest rate that is currently held at 0.1%, the statement itself may be interesting. The main focus will be on the yearly outlook by the bank given surging inflation (3.8% in the 2nd quarter) and the coronavirus situation in Australia.
How to trade on the RBA Interest Rate Decision?
It’s highly important to follow the statement that may contain changes to the bank’s monetary policy.
⬆ If the bank improves outlook and hints at rate hikes, the AUD will go up.
⬇ If the regulator is cautious, the AUD will slide.
Instruments to trade: AUD/USD, AUD/JPY, AUD/NZD
Morning, guys!
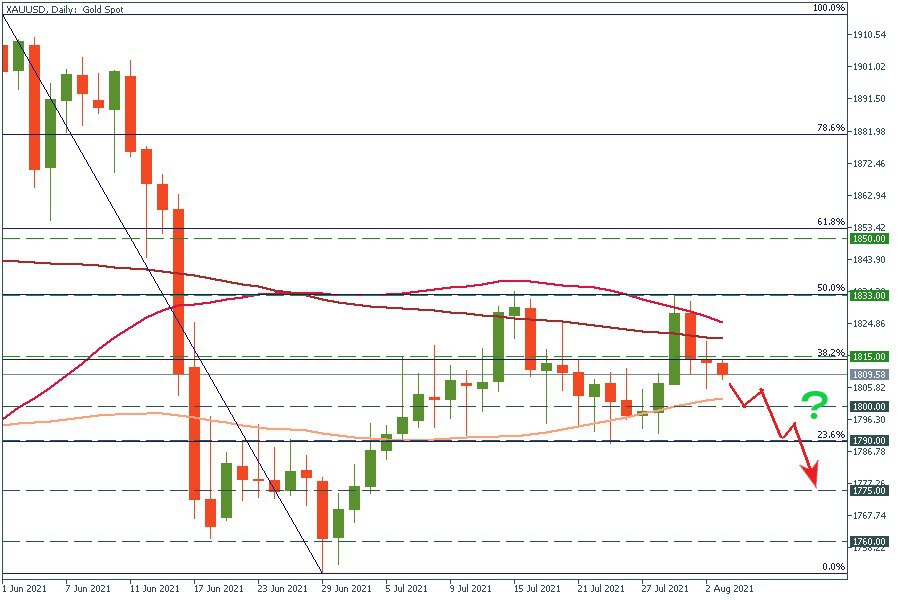
⚡ Pay attention to gold today as it's exposed to drop to the support zone of $1790-1800, which will confirm the Double Top pattern.
💫 S&P 500 is moving sideways. Check out the special strategy for trading the flat market.
😏 Australia's central bank has left the policy unchanged and surprised investors with its readiness to keep the September tapering plan on the table! It helped the AUD to recover some losses caused by the latest local lockdowns in Australia.
😬 US Manufacturing PMI came out worse than analysts expected: 59.5 vs the expected 60.8. The combination of the rapid spread of the Covid-19 strain and the signs of strong but slower US manufacturing growth pushed the S&P 500 lower.
🤔 China’s Manufacturing PMI was worse than expected as well. After that, oil dropped as China is one of the largest oil importers.
😉 Alibaba will reveal its earnings results today at 14:30 GMT+3.
Check out trade ideas on gold, EUR/USD, and S&P 500 in this article https://bit.ly/3yzfFM1
⚡ Pay attention to gold today as it's exposed to drop to the support zone of $1790-1800, which will confirm the Double Top pattern.
💫 S&P 500 is moving sideways. Check out the special strategy for trading the flat market.
😏 Australia's central bank has left the policy unchanged and surprised investors with its readiness to keep the September tapering plan on the table! It helped the AUD to recover some losses caused by the latest local lockdowns in Australia.
😬 US Manufacturing PMI came out worse than analysts expected: 59.5 vs the expected 60.8. The combination of the rapid spread of the Covid-19 strain and the signs of strong but slower US manufacturing growth pushed the S&P 500 lower.
🤔 China’s Manufacturing PMI was worse than expected as well. After that, oil dropped as China is one of the largest oil importers.
😉 Alibaba will reveal its earnings results today at 14:30 GMT+3.
Check out trade ideas on gold, EUR/USD, and S&P 500 in this article https://bit.ly/3yzfFM1
#MarketAnalysis
📈 How about some fresh thoughts on currencies? We have some!
AUD/USD: https://bit.ly/3A8NlQD
GBP/USD and EUR/GBP: https://bit.ly/3ymCiD8
📈 How about some fresh thoughts on currencies? We have some!
AUD/USD: https://bit.ly/3A8NlQD
GBP/USD and EUR/GBP: https://bit.ly/3ymCiD8
Hello everyone, how’s your Wednesday?
Watch the video with the opinion of our analyst Nour Eldeen Al-Hammoury!
Here are the main topics:
💰USD Downside Retracement Continues, Trading Below 92 Support area. What’s Next?
🌿RBA to proceed with bond Purchases Tapering despite Delta concerns.
🇬🇧Eyes on BOE Decision this week while GBP broke above 1.39 Resistance.
🚀NFP Set to Add 900K New Jobs in July, Will it Change the Fed’s Tone?
➡ https://youtu.be/jRAWzajk54
Watch the video with the opinion of our analyst Nour Eldeen Al-Hammoury!
Here are the main topics:
💰USD Downside Retracement Continues, Trading Below 92 Support area. What’s Next?
🌿RBA to proceed with bond Purchases Tapering despite Delta concerns.
🇬🇧Eyes on BOE Decision this week while GBP broke above 1.39 Resistance.
🚀NFP Set to Add 900K New Jobs in July, Will it Change the Fed’s Tone?
➡ https://youtu.be/jRAWzajk54
Latest news
👍 New Zealand reported strong labor data. As a result, the New Zealand dollar surged! NZD/USD rocketed to 0.7050.
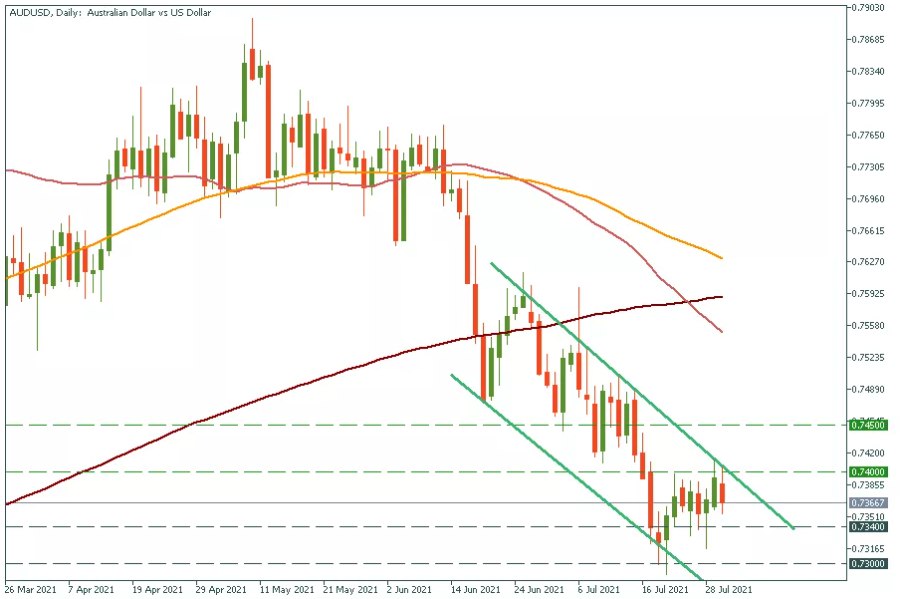
😐 Australia’s retail sales met the expectations: they dropped by 1.8%. The Australian dollar has modestly reacted. AUD/USD rose but failed to cross the psychological mark of 0.7400.
⚡ Investors keep assessing regulatory risks in China on tech giants. Alibaba’s revenue missed estimates for the first time in 2 years – the negative effect of China’s crackdown.
😏 Follow the ADP report today at 15:30 GMT+3. It will give an early look at the US employment ahead of the Nonfarm payrolls on Friday (NFP).
Trade ideas on NZD/USD, EUR/USD, and S&P 500! https://bit.ly/37jHbB0
And daily video - https://www.youtube.com/watch?v=wNPJDkorAww
Enjoy!
👍 New Zealand reported strong labor data. As a result, the New Zealand dollar surged! NZD/USD rocketed to 0.7050.
😐 Australia’s retail sales met the expectations: they dropped by 1.8%. The Australian dollar has modestly reacted. AUD/USD rose but failed to cross the psychological mark of 0.7400.
⚡ Investors keep assessing regulatory risks in China on tech giants. Alibaba’s revenue missed estimates for the first time in 2 years – the negative effect of China’s crackdown.
😏 Follow the ADP report today at 15:30 GMT+3. It will give an early look at the US employment ahead of the Nonfarm payrolls on Friday (NFP).
Trade ideas on NZD/USD, EUR/USD, and S&P 500! https://bit.ly/37jHbB0
And daily video - https://www.youtube.com/watch?v=wNPJDkorAww
Enjoy!
FBS
NZD Rises on Strong Job Data and Other News
Read a short market wrap before trading today!
https://t.me/fbsanalyticschat?voicechat
🎙 On Thursday, at 12:00 GMT+3 we’ll do a voice chat!
❔Write your questions to FBS analysts in the comments!
🎙 On Thursday, at 12:00 GMT+3 we’ll do a voice chat!
❔Write your questions to FBS analysts in the comments!
Telegram
FBS Analytics Chat
Chat for those who trade currencies, stocks & commodities with FBS
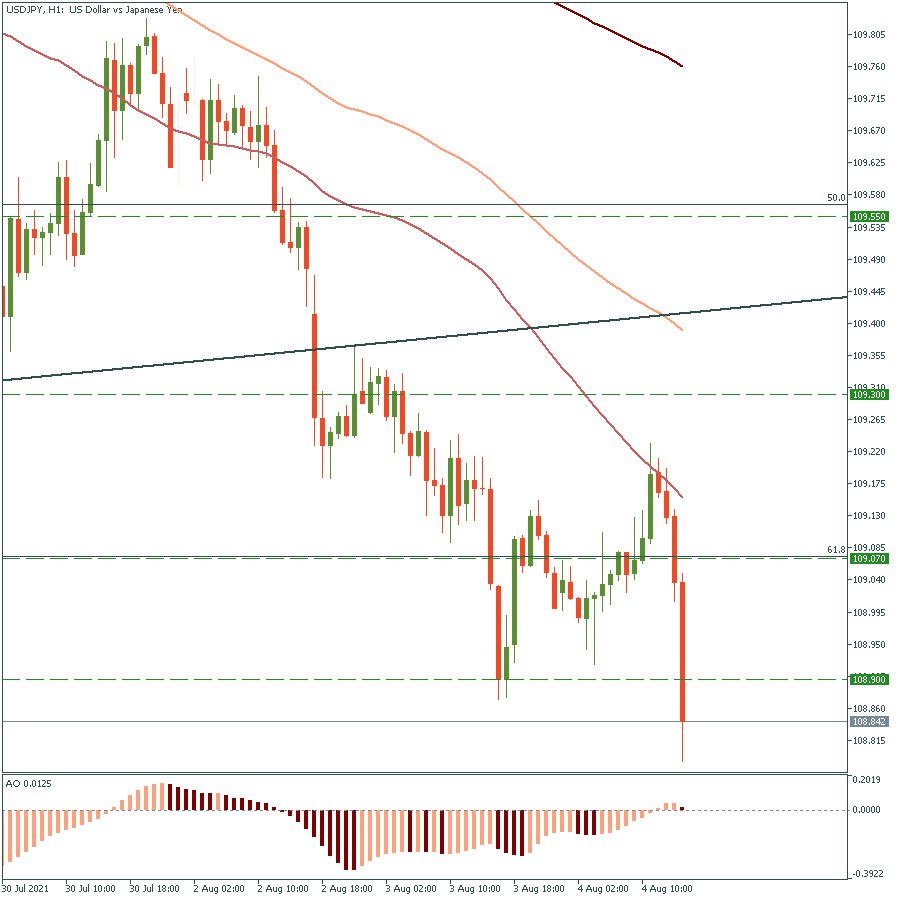
💡Do you want a trade idea for stocks?
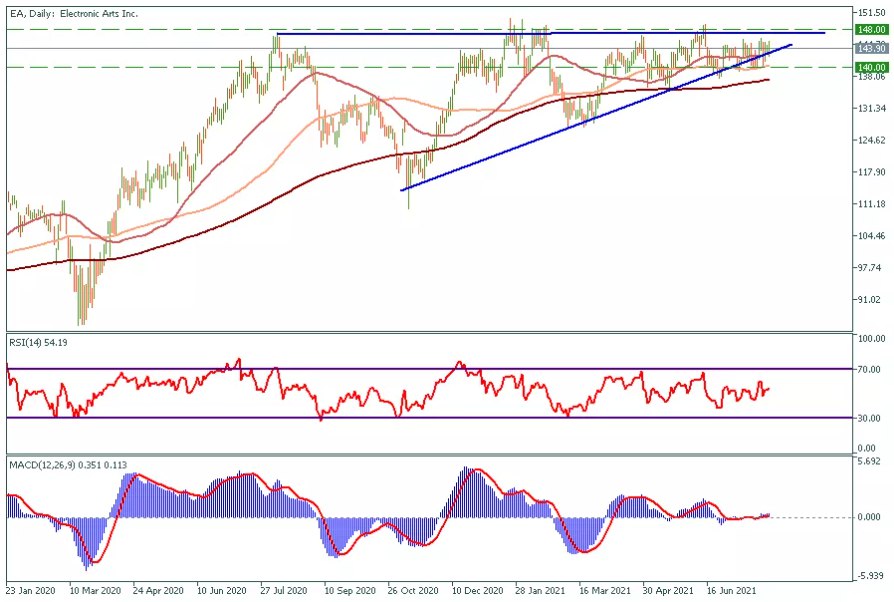
Behold! Electronic Arts, the global leader in digital interactive entertainment, will present its earnings report for the second quarter on August 4 after the stock market closes (23:00 GMT+3).
The stock is forming an interesting pattern on the chart. 📈
➡Learn more: https://bit.ly/2VxutvD
Behold! Electronic Arts, the global leader in digital interactive entertainment, will present its earnings report for the second quarter on August 4 after the stock market closes (23:00 GMT+3).
The stock is forming an interesting pattern on the chart. 📈
➡Learn more: https://bit.ly/2VxutvD