🇺🇸 USDCAD 🇨🇦
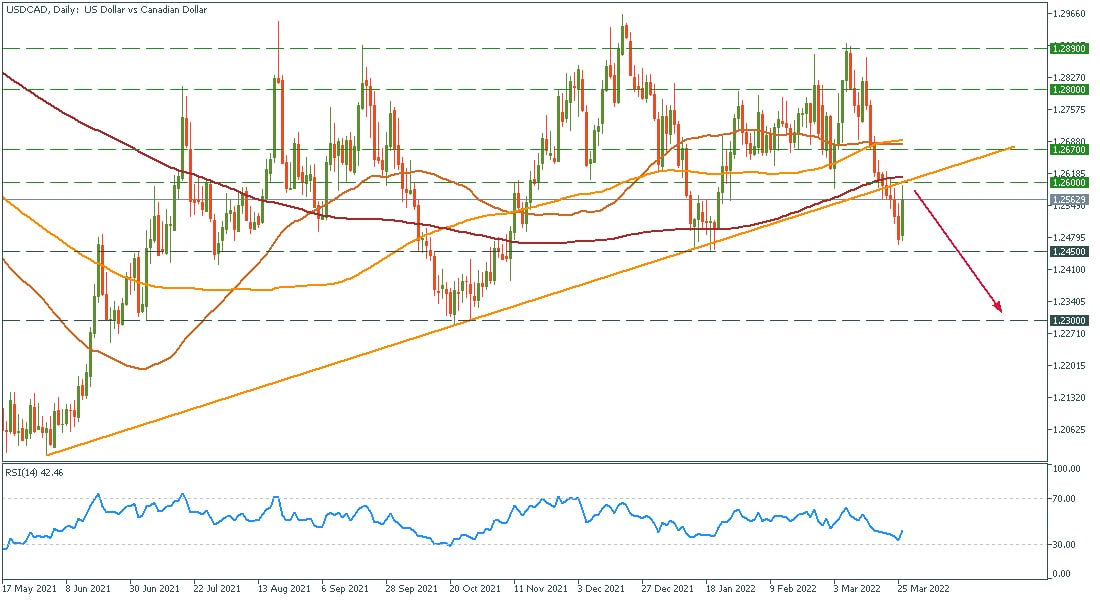
📉 The pair broke through the ascending trendline and now is making a retest. We suppose it will go lower and reach 1.2300 during April
⚠️ You can enter short trade now or a little bit higher (at 1.2600) with a stop loss higher that 1.2670. Be careful, the dollar is strong now and can move the pair higher
✅ Take profits should be at 1.2450 and 1.2300
🟢 TRADE USDCAD 🔴
📉 The pair broke through the ascending trendline and now is making a retest. We suppose it will go lower and reach 1.2300 during April
⚠️ You can enter short trade now or a little bit higher (at 1.2600) with a stop loss higher that 1.2670. Be careful, the dollar is strong now and can move the pair higher
✅ Take profits should be at 1.2450 and 1.2300
🟢 TRADE USDCAD 🔴
👍36❤12
🇬🇧🇺🇸#GBPUSD
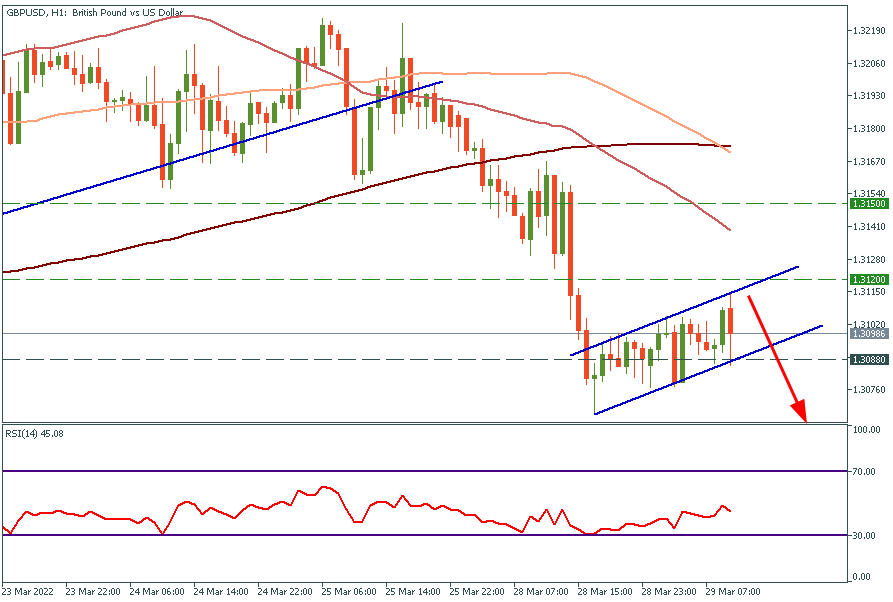
GBPUSD has formed the bearish flag 🚩
👇Consider opening a SELL trade as soon as the price breaks through the lower border of this pattern!
🎯Target: 1.3000
✅TRADE GBPUSD✅
GBPUSD has formed the bearish flag 🚩
👇Consider opening a SELL trade as soon as the price breaks through the lower border of this pattern!
🎯Target: 1.3000
✅TRADE GBPUSD✅
👍36❤7🔥4
🥇#Gold
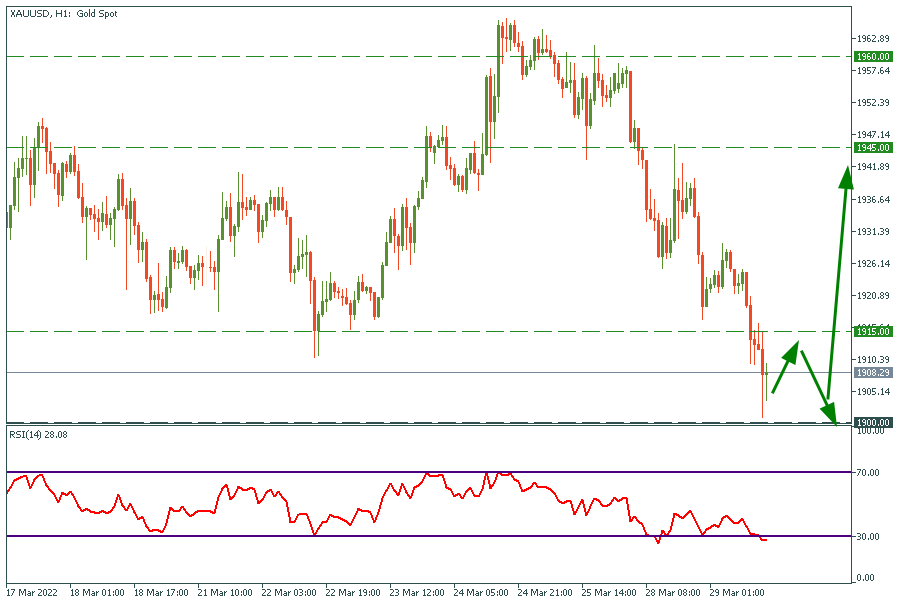
XAUUSD has almost reached our target of $1900 (click). Congratulations to everybody who entered this trade! 🎉
❗️The price might pull back after this dump. That's why we suggest opening a BUY trade with the target at $1915❗️
If the price breaks through $1915, it might increase to $1945!
✅BUY GOLD✅
XAUUSD has almost reached our target of $1900 (click). Congratulations to everybody who entered this trade! 🎉
❗️The price might pull back after this dump. That's why we suggest opening a BUY trade with the target at $1915❗️
If the price breaks through $1915, it might increase to $1945!
✅BUY GOLD✅
👍41❤7👏5👎3🔥3😁1
#Education
🎓ABC of Economic Releases
Hi everyone!
It’s time again for our weekly post of ABC for traders! Today we’ll discuss some releases that are crucial and why it’s necessary to check them regularly in the economic calendar.
Of course, these releases are published for all major countries; however, as the USD is a key currency, the US releases are the most significant because these events have the biggest impact on the market. They are all essential in defining the status of countries’ economic health and prosperity.
1) Gross Domestic Product (GDP) measures the value of goods and services produced in a specific country, adjusted for price changes. GDP measures country’s entire economy and it’s usually released quarterly.
Traders usually focus on the percentage increase or decrease in GDP. When real GDP increases businesses produce higher value goods and services. They are generally considered to make more money and are supposed to improve people’s standard of living. If GDP is declining, then the opposite is assumed to be true.
2) Non-farm payrolls (NFP) and unemployment rates both show an estimate of the total number of jobs created or lost in the previous month and a percentage figure showing what percentage of citizens aren’t working and actively looking for work. In the US, these indicators are published on the first Friday of every month.
When more companies hire employees, it can mean to market participants that businesses are doing well and can also lead to predictions that more people will have more money to spend. Conversely, when the unemployment rate rises unexpectedly — or even when it falls but falls less than expected — it may be due to falling stock prices, indicating that cash-strapped employers are tightening their belts.
3) Price Indices (CPI and PPI)
The Consumer Price Index (CPI) measures the prices of a basket of specific goods and services purchased by urban consumers, including food, transportation, clothing, medical care, and so on. It is published monthly and helps economists measure inflation and the increase in the overall price of goods and services. Meanwhile, the Producer Price Index (PPI) measures price change from a seller's point of view, based on the selling price received by domestic producers of goods and services.
The PPI is timely because it is the first measure of inflation available this month. Markets can sometimes use this index to forecast inflation before it appears in the CPI. Moreover, the PPI is a broader measure, as it tracks price changes in the output of almost all sectors of the country’s commodity-producing economy. At the same time, the CPI is designed to measure urban inflation and focuses on changes in the prices of goods and services.
Do you follow economic indicators releases? Share your experience in the comments!✨
🎓ABC of Economic Releases
Hi everyone!
It’s time again for our weekly post of ABC for traders! Today we’ll discuss some releases that are crucial and why it’s necessary to check them regularly in the economic calendar.
Of course, these releases are published for all major countries; however, as the USD is a key currency, the US releases are the most significant because these events have the biggest impact on the market. They are all essential in defining the status of countries’ economic health and prosperity.
1) Gross Domestic Product (GDP) measures the value of goods and services produced in a specific country, adjusted for price changes. GDP measures country’s entire economy and it’s usually released quarterly.
Traders usually focus on the percentage increase or decrease in GDP. When real GDP increases businesses produce higher value goods and services. They are generally considered to make more money and are supposed to improve people’s standard of living. If GDP is declining, then the opposite is assumed to be true.
2) Non-farm payrolls (NFP) and unemployment rates both show an estimate of the total number of jobs created or lost in the previous month and a percentage figure showing what percentage of citizens aren’t working and actively looking for work. In the US, these indicators are published on the first Friday of every month.
When more companies hire employees, it can mean to market participants that businesses are doing well and can also lead to predictions that more people will have more money to spend. Conversely, when the unemployment rate rises unexpectedly — or even when it falls but falls less than expected — it may be due to falling stock prices, indicating that cash-strapped employers are tightening their belts.
3) Price Indices (CPI and PPI)
The Consumer Price Index (CPI) measures the prices of a basket of specific goods and services purchased by urban consumers, including food, transportation, clothing, medical care, and so on. It is published monthly and helps economists measure inflation and the increase in the overall price of goods and services. Meanwhile, the Producer Price Index (PPI) measures price change from a seller's point of view, based on the selling price received by domestic producers of goods and services.
The PPI is timely because it is the first measure of inflation available this month. Markets can sometimes use this index to forecast inflation before it appears in the CPI. Moreover, the PPI is a broader measure, as it tracks price changes in the output of almost all sectors of the country’s commodity-producing economy. At the same time, the CPI is designed to measure urban inflation and focuses on changes in the prices of goods and services.
Do you follow economic indicators releases? Share your experience in the comments!✨

👍33🔥7😁1
Hi, traders! 👋🏻
Let’s look through economic events that are interesting to follow this week! 😎
We, Mar 30
Today the US is going to publish the ADP Employment rate, which is usually used to predict NFP. Also, there will be a report of Crude oil inventories, it tells the change in the number of barrels of crude oil held in inventory by commercial firms during the past week. Moreover, the final quarterly GDP will be announced. Great chance to trade the USD pairs and XTIUSD!
Th, March 31
Thursday will be fruitful for economic events. The OPEC meeting is coming and there must be some fluctuation in XBR and XTI! They’ll discuss a range of issues regarding energy markets and, most importantly, agree on how much oil they will produce. Due to geopolitical ussies, the result can be unexpected!
Canada is about to update its GDP. It’s an essential release for understanding country’s economic health. A small improvement is expected.
Finally, the US will release Core PCE Price index. The inflation in the US is a hot topic and keeping up with indicators is crucial for possible USD volatility. World commodity prices are growing, and it can bring unpleasant surprises to the consumer environment.
Fr, Apr 1
And of course, everyone is looking forward to Friday’s US NFP publication! NFP release is a perfect chance for a trader to the USD pairs and some indices, like US100 or US500.
Keeping up with economic events is a great chance to develop your fundamental analysis skills. Understanding countries’ economic health will help you gain insights during trading.
Good luck with the Marathon and be ready to share your results in the comments! ✨
#FBSTradingMarathon
Let’s look through economic events that are interesting to follow this week! 😎
We, Mar 30
Today the US is going to publish the ADP Employment rate, which is usually used to predict NFP. Also, there will be a report of Crude oil inventories, it tells the change in the number of barrels of crude oil held in inventory by commercial firms during the past week. Moreover, the final quarterly GDP will be announced. Great chance to trade the USD pairs and XTIUSD!
Th, March 31
Thursday will be fruitful for economic events. The OPEC meeting is coming and there must be some fluctuation in XBR and XTI! They’ll discuss a range of issues regarding energy markets and, most importantly, agree on how much oil they will produce. Due to geopolitical ussies, the result can be unexpected!
Canada is about to update its GDP. It’s an essential release for understanding country’s economic health. A small improvement is expected.
Finally, the US will release Core PCE Price index. The inflation in the US is a hot topic and keeping up with indicators is crucial for possible USD volatility. World commodity prices are growing, and it can bring unpleasant surprises to the consumer environment.
Fr, Apr 1
And of course, everyone is looking forward to Friday’s US NFP publication! NFP release is a perfect chance for a trader to the USD pairs and some indices, like US100 or US500.
Keeping up with economic events is a great chance to develop your fundamental analysis skills. Understanding countries’ economic health will help you gain insights during trading.
Good luck with the Marathon and be ready to share your results in the comments! ✨
#FBSTradingMarathon
👍40🔥7
🇺🇸🇯🇵#FBSTradingMarathon #USDJPY
Let's start our Trading Marathon with USDJPY! 🎉🎉🎉
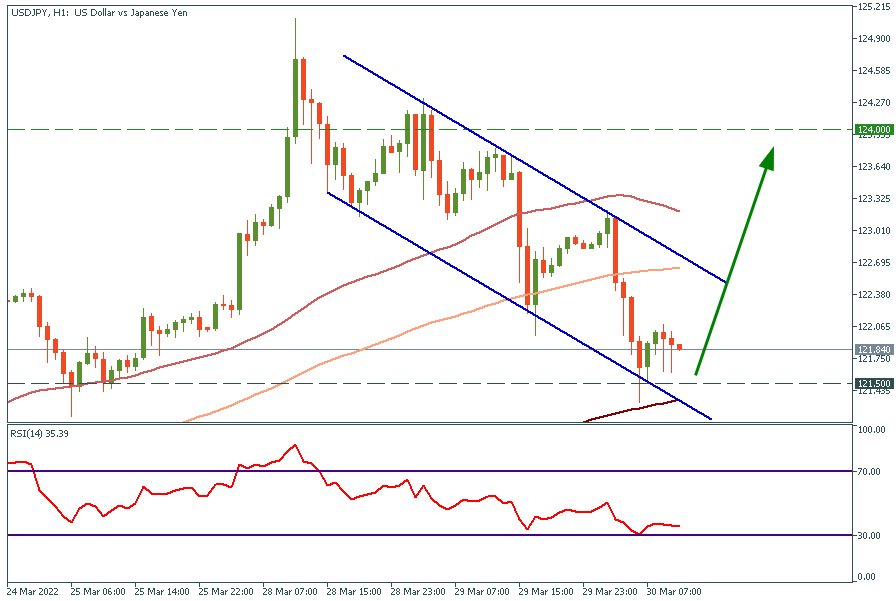
The pair plunged down as we've mentioned in this post (https://t.me/fbsanalytics/4516). The price is moving in the descending channel and, at the moment, it is consolidating above the 50-hour moving average.
✅We expect to see a reversal to the upwards here. Consider buying this pair at 121.5 with the target at 124.
Join the marathon: @FBS_marathon_bot
✅BUY USDJPY✅
Let's start our Trading Marathon with USDJPY! 🎉🎉🎉
The pair plunged down as we've mentioned in this post (https://t.me/fbsanalytics/4516). The price is moving in the descending channel and, at the moment, it is consolidating above the 50-hour moving average.
✅We expect to see a reversal to the upwards here. Consider buying this pair at 121.5 with the target at 124.
Join the marathon: @FBS_marathon_bot
✅BUY USDJPY✅
👍37🔥17👏1
🇪🇺🇺🇸#FBSTradingMarathon #EURUSD
🎉EURUSD hit all targets from our last trade idea - click
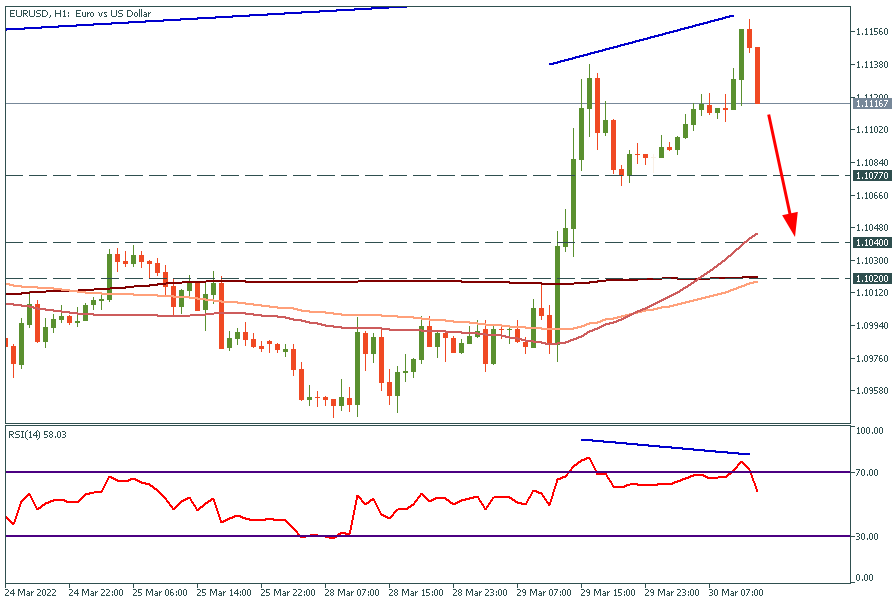
Right now the pair has formed a bearish divergence on the H1 chart. That's why we expect a decline to 1.1070.
If the price breaks through this support, it will slide down to 1.1040.
🤝Are you trading EURUSD today? What are your targets? Share in the comments!
Join the marathon: @FBS_marathon_bot
✅SELL EURUSD✅
🎉EURUSD hit all targets from our last trade idea - click
Right now the pair has formed a bearish divergence on the H1 chart. That's why we expect a decline to 1.1070.
If the price breaks through this support, it will slide down to 1.1040.
🤝Are you trading EURUSD today? What are your targets? Share in the comments!
Join the marathon: @FBS_marathon_bot
✅SELL EURUSD✅
👍33🔥21❤1
🔥25👍10👏8
🤩Hey, are you excited about the start of the FBS Trading Marathon? We are, too!
As today is the day of oil trading, let’s refresh our knowledge about it.
There are two types of oil you can trade with FBS: Brent and WTI.
While Brent is a benchmark for European and Asian markets, WTI is a standard of the US-produced oil.
In FBS, you can trade Brent and WTI as XBRUSD and XTIUSD.
To trade oil, you need to know what affects its performance. One of the most significant factors is the change in demand and supply. The bigger the supply, the lower the oil prices. Vice versa, low supply is a sign of a rise in price.
The easiest way to track it is to follow the release of crude oil inventories. It shows the change in the number of barrels of crude oil held in inventory by US commercial firms. Today, it is about to be published at 17:30 GMT+3!
According to the forecast, we will see a decline of 2 million barrels.
🔺If the release shows a bigger decline in inventories, the oil prices will go up.
🔻On contrary, if the decline is smaller, the oil will go down.
Don't miss a chance to trade and join the marathon! @FBS_marathon_bot
As today is the day of oil trading, let’s refresh our knowledge about it.
There are two types of oil you can trade with FBS: Brent and WTI.
While Brent is a benchmark for European and Asian markets, WTI is a standard of the US-produced oil.
In FBS, you can trade Brent and WTI as XBRUSD and XTIUSD.
To trade oil, you need to know what affects its performance. One of the most significant factors is the change in demand and supply. The bigger the supply, the lower the oil prices. Vice versa, low supply is a sign of a rise in price.
The easiest way to track it is to follow the release of crude oil inventories. It shows the change in the number of barrels of crude oil held in inventory by US commercial firms. Today, it is about to be published at 17:30 GMT+3!
According to the forecast, we will see a decline of 2 million barrels.
🔺If the release shows a bigger decline in inventories, the oil prices will go up.
🔻On contrary, if the decline is smaller, the oil will go down.
Don't miss a chance to trade and join the marathon! @FBS_marathon_bot

👍19👏6❤4🔥1
📣 Crude oil update!
Crude oil inventories - -3.449M vs forecast of -2M
US oil production = 11.7 mbd (vs 11.6 mbd previously)
Oil is plunging!
Crude oil inventories - -3.449M vs forecast of -2M
US oil production = 11.7 mbd (vs 11.6 mbd previously)
Oil is plunging!
👍28🥰7
🇺🇸🇨🇦#FBSTradingmarathon #USDCAD
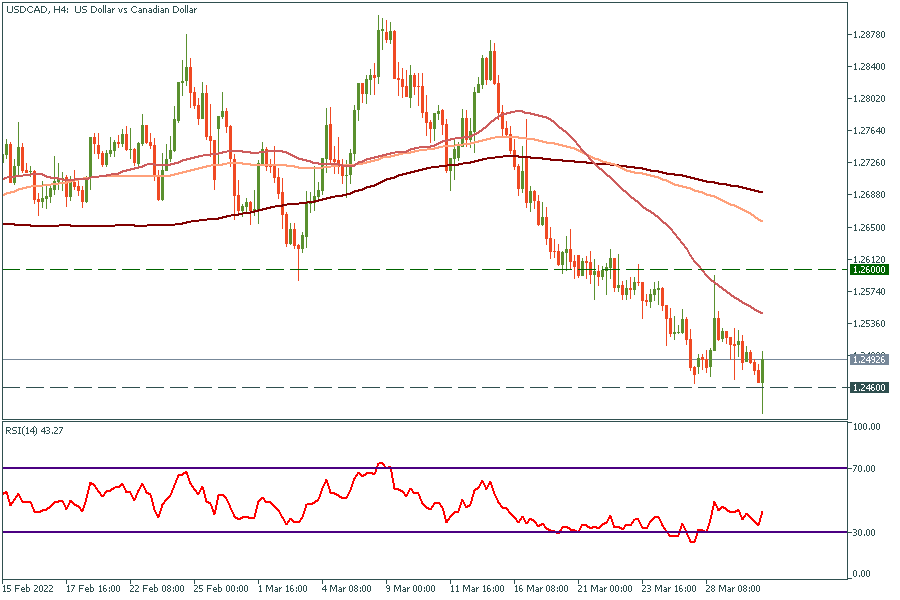
👍USDCAD has found its local support at 1.2460.
Traders might consider buying this pair in the 1.2450-1.2460 range with the target at 1.2600.
Join the marathon: @FBS_marathon_bot
✅BUY USDCAD✅
👍USDCAD has found its local support at 1.2460.
Traders might consider buying this pair in the 1.2450-1.2460 range with the target at 1.2600.
Join the marathon: @FBS_marathon_bot
✅BUY USDCAD✅
👍29🔥4👏1
🔥FBS Trading Marathon is continuing! Are you ready for Day 2?🔥
Let us present to you with the second day’s trading instruments: Stocks and Indices! 📈
Trade all available stocks and indices (HK50, JP225, US100, etc.) with FBS and get the chance to win some money! Moreover, keep up with our channel because soon we’ll reveal the list of top traders. Don’t forget, all traders have a chance to win!
➡️Use @FBS_marathon_bot to register for the trading marathon. You need to open stock or index trades during the day and close them before the end of the Marathon (23:59 MT on April 5). The more you trade, the more chances you have! 💪🏼
Good luck everyone! ✨
#FBSTradingMarathon
Let us present to you with the second day’s trading instruments: Stocks and Indices! 📈
Trade all available stocks and indices (HK50, JP225, US100, etc.) with FBS and get the chance to win some money! Moreover, keep up with our channel because soon we’ll reveal the list of top traders. Don’t forget, all traders have a chance to win!
➡️Use @FBS_marathon_bot to register for the trading marathon. You need to open stock or index trades during the day and close them before the end of the Marathon (23:59 MT on April 5). The more you trade, the more chances you have! 💪🏼
Good luck everyone! ✨
#FBSTradingMarathon
👍26🔥4👏1
#MarketNews
🤔 HK50 index is down after three days of growth. China’s manufacturing PMI came below 50 indicating industry contraction.
🇨🇳 Moreover, Chinese technology stocks are under pressure after the US Securities and Exchange Commission’s chief renounced rumors that a deal is brewing to keep about 200 Chinese stocks from losing their listings. The stock of Alibaba probably won’t like this!
🇺🇲 US500 (S&P 500) went down on Wednesday as talks between Russia and Ukraine stalled. Still, the index is above 4600 for now.
↘ Oil (XTIUSD) dropped from 106.50 to 101.50 on signs that the Biden administration is considering a massive release of crude from US reserves to combat inflation. Support is at 100.00 and 97.20.
🛢 OPEC+ will meet today. The cartel is expected to stick with its strategy of a modest output boost in May.
💹 In the currency market, the dollar mostly held a retreat, and the yen stabilized from its recent slide. USDJPY met resistance at 122.40 (March 24 and 25 highs) and slid to 121.80.
🏆 #FBSTradingMarathon continues! Today we trade indices and stocks. Contact @FBS_Marathon_bot to register.
🎦 The stream starts on this channel today at 11:00 GMT+3 (a.k.a. MT time).
How’s your Thursday? Do you have news to share?
🤔 HK50 index is down after three days of growth. China’s manufacturing PMI came below 50 indicating industry contraction.
🇨🇳 Moreover, Chinese technology stocks are under pressure after the US Securities and Exchange Commission’s chief renounced rumors that a deal is brewing to keep about 200 Chinese stocks from losing their listings. The stock of Alibaba probably won’t like this!
🇺🇲 US500 (S&P 500) went down on Wednesday as talks between Russia and Ukraine stalled. Still, the index is above 4600 for now.
↘ Oil (XTIUSD) dropped from 106.50 to 101.50 on signs that the Biden administration is considering a massive release of crude from US reserves to combat inflation. Support is at 100.00 and 97.20.
🛢 OPEC+ will meet today. The cartel is expected to stick with its strategy of a modest output boost in May.
💹 In the currency market, the dollar mostly held a retreat, and the yen stabilized from its recent slide. USDJPY met resistance at 122.40 (March 24 and 25 highs) and slid to 121.80.
🏆 #FBSTradingMarathon continues! Today we trade indices and stocks. Contact @FBS_Marathon_bot to register.
🎦 The stream starts on this channel today at 11:00 GMT+3 (a.k.a. MT time).
How’s your Thursday? Do you have news to share?
👍25👏1🤮1
👋🏻Hi, traders! Ready to trade stocks? Here are some tips that you should remember!
1️⃣To start with, make sure that you use a right platform to trade, the FBS Trader app or/and MetaTrader 5). MT4 is unavailable for stock trading.
2️⃣Then, check if the stock market is open. US stocks are available for trading from 16:30 to 23:00 GMT+3, German and UK stocks – from 10:00 to 18:00 GMT+3.
3️⃣When everything is great, open the charts with the stocks that you’re interested in. if you don’t know what stock to choose, read this.
4️⃣Next, add your favorite technical indicator to the chart. Moving averages or Bollinger Bands are the best in that case. The BB can help determine if an asset is overbought or oversold, while the MA can highlight possible support and resistance levels.
5️⃣After that, look for economic publications that may affect the stock market: income statements, company news, new product launches, etc.
6️⃣Don’t forget that you can open trades for both buying and selling. If the stock price is overbought or some negative news comes out, consider selling. Alternatively, if the stock price is oversold or some bullish news comes out, consider buying.
7️⃣The last, but not the least, make sure your portfolio is well-diversified: stocks from various sectors and/or different sizes and types.
Later we’ll give you some tips for some certain stocks, so, don’t miss it! 🔥
Good luck and happy trading! ✨
1️⃣To start with, make sure that you use a right platform to trade, the FBS Trader app or/and MetaTrader 5). MT4 is unavailable for stock trading.
2️⃣Then, check if the stock market is open. US stocks are available for trading from 16:30 to 23:00 GMT+3, German and UK stocks – from 10:00 to 18:00 GMT+3.
3️⃣When everything is great, open the charts with the stocks that you’re interested in. if you don’t know what stock to choose, read this.
4️⃣Next, add your favorite technical indicator to the chart. Moving averages or Bollinger Bands are the best in that case. The BB can help determine if an asset is overbought or oversold, while the MA can highlight possible support and resistance levels.
5️⃣After that, look for economic publications that may affect the stock market: income statements, company news, new product launches, etc.
6️⃣Don’t forget that you can open trades for both buying and selling. If the stock price is overbought or some negative news comes out, consider selling. Alternatively, if the stock price is oversold or some bullish news comes out, consider buying.
7️⃣The last, but not the least, make sure your portfolio is well-diversified: stocks from various sectors and/or different sizes and types.
Later we’ll give you some tips for some certain stocks, so, don’t miss it! 🔥
Good luck and happy trading! ✨
YouTube
Want to trade stocks? Watch this ASAP!
With the rapid growth of online trading, more and more people want to learn how to start buying and selling stocks. This video will help you to understand what stock trading is and how to make the first steps in it!
For more tips on stock trading, visit…
For more tips on stock trading, visit…
👍21👏3😁1