
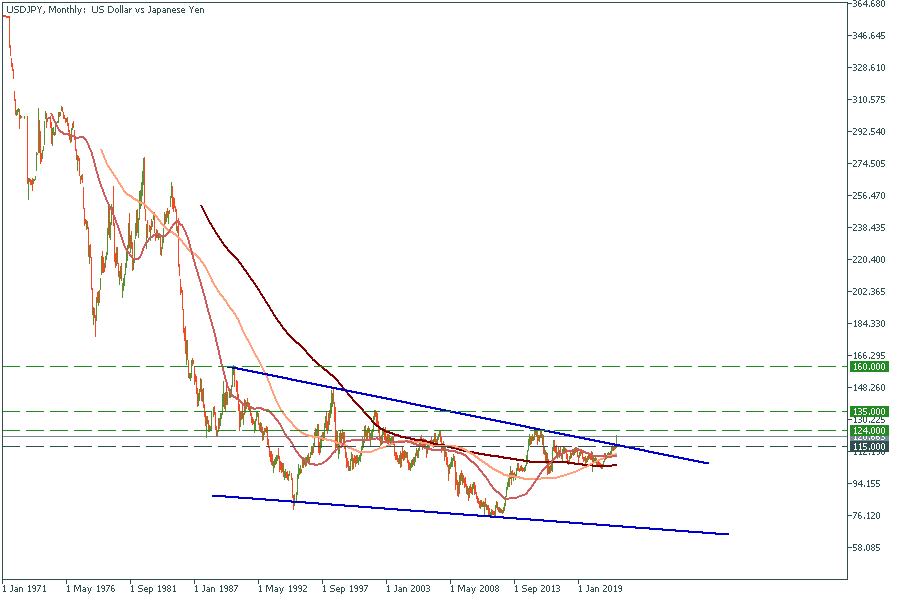
🇺🇸🇯🇵 The global reversal in #USDJPY
🧐What happened?
Historically investors treated the Japanese Yen as a safe haven in times of world crisis. However, three weeks since Russia invaded Ukraine, the JPY has plunged to a five-year low against the US dollar.
↘️Why is the yen falling?
Falling interest rates and high commodities prices are the main characteristics that usually push the Yen up against other currencies in times of global market upheaval. Yen’s safety was caused by the Japanese current account surplus.
Unfortunately for the yen, these factors work in reverse as well. Nowadays, global interest rates are increasing, energy and commodities prices are skyrocketing, and Japan's current account surplus is melting.
🛢Crude oil, which is trading around $115, meets most of Japan's primary energy needs. Japan is also one of the world's biggest importers of liquefied natural gas⛽️, which accounts for around a quarter of its energy balance. These factors mark a sharp deterioration in the country's terms of trade, and the yen-boosting current account surplus that Japan has run for decades may soon become a deficit.
If we consider that the Federal Reserve 💰 might increase the key rate by 50 basis points in May, plus another 25 points at each of the next five meetings in 2022, then we can conclude that USDJPY has more space to run higher. Moreover, energy prices may remain high for a long time, pressing the yen even more.
Do you want to see our analysts' technical outlook for USDJPY?
Read the article here 👈
🧐What happened?
Historically investors treated the Japanese Yen as a safe haven in times of world crisis. However, three weeks since Russia invaded Ukraine, the JPY has plunged to a five-year low against the US dollar.
↘️Why is the yen falling?
Falling interest rates and high commodities prices are the main characteristics that usually push the Yen up against other currencies in times of global market upheaval. Yen’s safety was caused by the Japanese current account surplus.
Unfortunately for the yen, these factors work in reverse as well. Nowadays, global interest rates are increasing, energy and commodities prices are skyrocketing, and Japan's current account surplus is melting.
🛢Crude oil, which is trading around $115, meets most of Japan's primary energy needs. Japan is also one of the world's biggest importers of liquefied natural gas⛽️, which accounts for around a quarter of its energy balance. These factors mark a sharp deterioration in the country's terms of trade, and the yen-boosting current account surplus that Japan has run for decades may soon become a deficit.
If we consider that the Federal Reserve 💰 might increase the key rate by 50 basis points in May, plus another 25 points at each of the next five meetings in 2022, then we can conclude that USDJPY has more space to run higher. Moreover, energy prices may remain high for a long time, pressing the yen even more.
Do you want to see our analysts' technical outlook for USDJPY?
Read the article here 👈
👍16🔥8🥰2👎1
🇪🇺🇺🇸#EURUSD
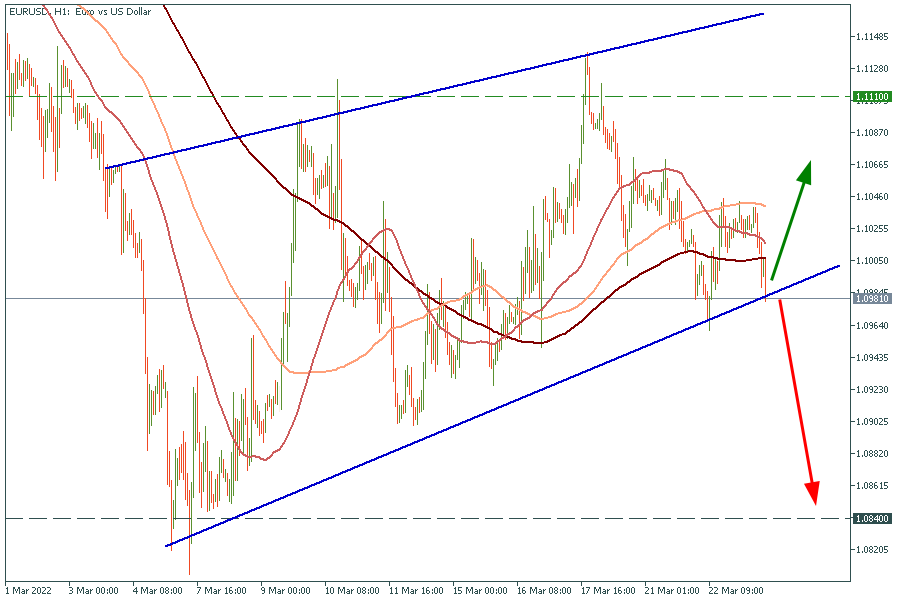
The price is testing the rising wedge's lower border again. Wait for the reversal confirmation and consider opening a long trade with a 1.1110 target.
👋On the other hand, if the H1 candle closes below the support trendline, consider selling the pair with a 1.0840 target.
🤔What is your prediction?
The price is testing the rising wedge's lower border again. Wait for the reversal confirmation and consider opening a long trade with a 1.1110 target.
👋On the other hand, if the H1 candle closes below the support trendline, consider selling the pair with a 1.0840 target.
🤔What is your prediction?
👍12❤1
🥇#GOLD
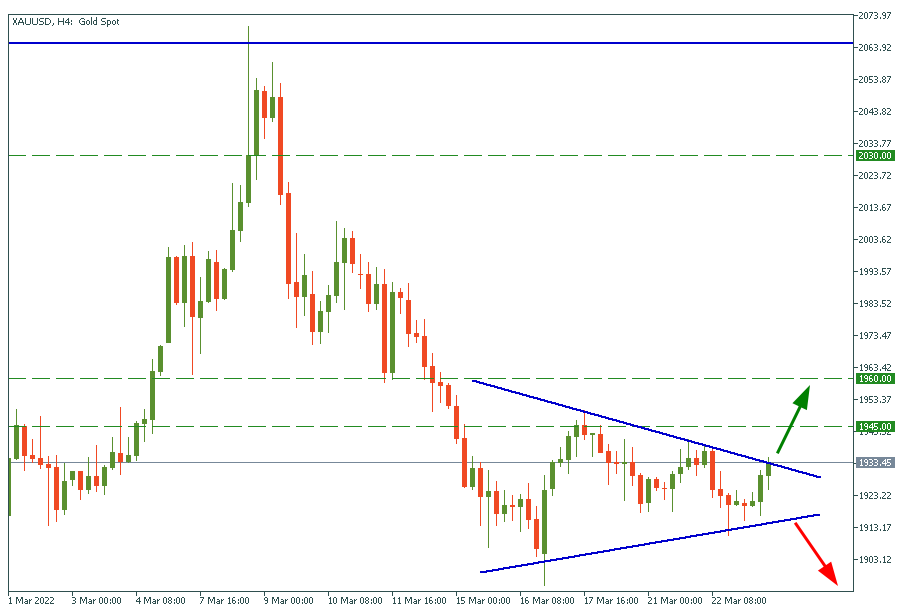
✅XAUUSD has formed a symmetrical triangle.🔻 Right now, the price is testing the upper border. In case of a breakout, consider opening a buy trade with targets at $1945 and $1960.
🤌Vice versa, if gold breaks through the lower border, it might fall to $1870.
✅TRADE GOLD✅
✅XAUUSD has formed a symmetrical triangle.🔻 Right now, the price is testing the upper border. In case of a breakout, consider opening a buy trade with targets at $1945 and $1960.
🤌Vice versa, if gold breaks through the lower border, it might fall to $1870.
✅TRADE GOLD✅
👍27👎2
⚡️European Economy Is Shaking! Ready to Take Advantage of It?
What is happening?
Germany will release the flash Purchasing Managers’ Index (PMI) on March 24, at 10:30 MT time (GMT+2). It’s an index based on purchasing managers’ surveys in the manufacturing and services industries. All numbers above the 50.0 level indicate industry expansion; numbers that are below the level show contraction. The market hasn’t seen a manufacturing index below 50.0 for 18 months, but it’s far from the historical highs of March 2021. Services PMI is also in the expansion zone, but the EU’s rising prices and supply shortages will greatly affect further readings.
What is happening with the euro?
PMI data might be released months ahead of the official data. That’s why the PMI surveys are considered to be one of the world’s most market-moving economic data releases. Geopolitical tensions and wars never take a toll. The economic activity decrease can’t help but to affect the PMI data.
The PMI may fall in this month and continue to decrease later. It will push the euro lower due to the economy weakening. EURUSD is at its lowest since 2020. The US Fed’s rates hike and low PMI numbers may put USD into a stronger position, pushing the chart lower to 1.0600.
How to trade on PMI readings?
As PMI is the essential index, it may influence all EUR pairs greatly. To catch a significant price movement, you can follow other news related to EUR and analyze all the events comprehensively.
🔺If the actual numbers beat expectations – EUR will rise.
🔻Otherwise, it might fall.
What is happening?
Germany will release the flash Purchasing Managers’ Index (PMI) on March 24, at 10:30 MT time (GMT+2). It’s an index based on purchasing managers’ surveys in the manufacturing and services industries. All numbers above the 50.0 level indicate industry expansion; numbers that are below the level show contraction. The market hasn’t seen a manufacturing index below 50.0 for 18 months, but it’s far from the historical highs of March 2021. Services PMI is also in the expansion zone, but the EU’s rising prices and supply shortages will greatly affect further readings.
What is happening with the euro?
PMI data might be released months ahead of the official data. That’s why the PMI surveys are considered to be one of the world’s most market-moving economic data releases. Geopolitical tensions and wars never take a toll. The economic activity decrease can’t help but to affect the PMI data.
The PMI may fall in this month and continue to decrease later. It will push the euro lower due to the economy weakening. EURUSD is at its lowest since 2020. The US Fed’s rates hike and low PMI numbers may put USD into a stronger position, pushing the chart lower to 1.0600.
How to trade on PMI readings?
As PMI is the essential index, it may influence all EUR pairs greatly. To catch a significant price movement, you can follow other news related to EUR and analyze all the events comprehensively.
🔺If the actual numbers beat expectations – EUR will rise.
🔻Otherwise, it might fall.

👍39👏7
#MarketNews
☀️Good morning traders! It is a great day to show your trading skills, especially in oil and gas, as Putin announced payments in the Russian ruble for all gas export. This will boost inflation in the EU to a whole new level, so keep an eye on XBRUSD and XGNUSD, they may jump a lot
🇯🇵 BOJ’s Kataoka: Japan's economy is improving as a trend, but downward pressure is increasing. Bonds should be purchased aggressively. JPY is dying with a 6% fall against USD
💰 Some analysts suppose Fed's balance sheet will matter more than raising rates against inflation. However, high rates will surely help in the fight. Fed’s Bullard said, “We will have to move faster than what we are used to. Fed should start reducing balance sheet now”.
🛢 US crude oil inventories turned out to be lower than expected (-2.5M vs. -0.7M forecast). Also, China’s oil refiners are discreetly purchasing cheap Russian oil “Urals”, keeping its price from falling.
🇵🇭 The Philippine central bank, which held interest rates steady Thursday, warned inflation may breach its target this year and that it stands ready to respond to a build-up in price pressures. Central bank keeps rate steady at record low 2%, as expected.
🥇 Gold is close to the resistance area. Consider buying after the $1950 breakout with a target at $1973. Are you in?
🥇 JOIN TRADING🥇
☀️Good morning traders! It is a great day to show your trading skills, especially in oil and gas, as Putin announced payments in the Russian ruble for all gas export. This will boost inflation in the EU to a whole new level, so keep an eye on XBRUSD and XGNUSD, they may jump a lot
🇯🇵 BOJ’s Kataoka: Japan's economy is improving as a trend, but downward pressure is increasing. Bonds should be purchased aggressively. JPY is dying with a 6% fall against USD
💰 Some analysts suppose Fed's balance sheet will matter more than raising rates against inflation. However, high rates will surely help in the fight. Fed’s Bullard said, “We will have to move faster than what we are used to. Fed should start reducing balance sheet now”.
🛢 US crude oil inventories turned out to be lower than expected (-2.5M vs. -0.7M forecast). Also, China’s oil refiners are discreetly purchasing cheap Russian oil “Urals”, keeping its price from falling.
🇵🇭 The Philippine central bank, which held interest rates steady Thursday, warned inflation may breach its target this year and that it stands ready to respond to a build-up in price pressures. Central bank keeps rate steady at record low 2%, as expected.
🥇 Gold is close to the resistance area. Consider buying after the $1950 breakout with a target at $1973. Are you in?
🥇 JOIN TRADING🥇
👍33👏2
🇨🇳#HK50
✅Chinese stocks will move higher today!
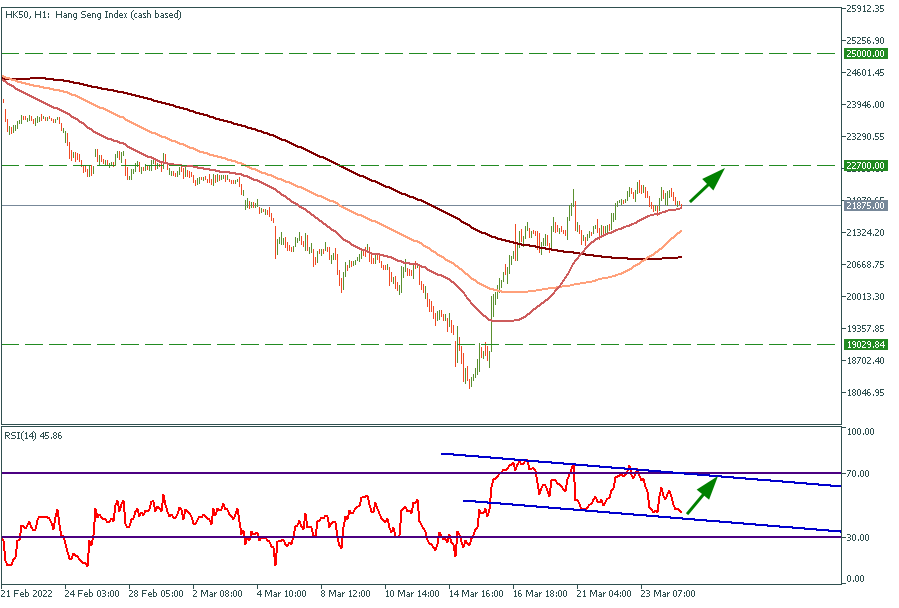
We love to use the RSI oscillator as one of the best trading indicators. We've noticed the RSI is consolidating on the HK50 chart, while the price is moving above the 50-hour moving average.
We expect HK50 to reach the 22 700 resistance already today❗️
🧐Still do not believe in RSI signals? Check out the previous post
✅BUY HK50✅
✅Chinese stocks will move higher today!
We love to use the RSI oscillator as one of the best trading indicators. We've noticed the RSI is consolidating on the HK50 chart, while the price is moving above the 50-hour moving average.
We expect HK50 to reach the 22 700 resistance already today❗️
🧐Still do not believe in RSI signals? Check out the previous post
✅BUY HK50✅
👍13❤4
#Education
🎓ABC of Technical Analysis Tools
We’re happy to be back with our little educational section. Today let’s talk about easy and efficient instruments that everyone observes during trading!
1) Candles offer a graphical way of displaying price dynamics. A price candlestick consists of two main elements: body - a vertical rectangle that demonstrates the levels of opening and closing trades; wicks or shadows - vertical lines above and below the body of the candle, reflecting fluctuations in value between opening and closing.
The main advantage of a candlestick over bars and a line chart is that it allows you to get four important indicators for technical analysis at once: High - the highest price for the period; Low - the lowest price for the period; Open - period opening price; Close - closing price of the period.
2) Trendline is a diagonal (never horizontal) line between two critical highs or lows, helping to determine a prevailing trend. Depending on the direction, it can be a downtrend or uptrend. You can draw the most reliable trendlines in larger timeframes (daily, weekly, or monthly). Trendline analysis helps to track only useful information on the chart and cut off minor deviations. This helps to focus and learn to see the bigger picture before making any market decision.
3) Resistance and Support levels are the two main horizontal price levels. At the support level, falling price tends to slow down or reverse. This means that the price is more likely to "bounce" from this level than break it. However, once the price breaks this level, it will likely continue to fall until it finds another support level. And vice versa: at the resistance level, a rising price tends to slow down or reverse. The price would rather bounce off this level than break it. However, a break above this level opens the way for the price to rise further until it finds another resistance level.
These are basic instruments that you can use while trading. Pay attention to them, and you’ll surely boost your trading skill! ✨
🎓ABC of Technical Analysis Tools
We’re happy to be back with our little educational section. Today let’s talk about easy and efficient instruments that everyone observes during trading!
1) Candles offer a graphical way of displaying price dynamics. A price candlestick consists of two main elements: body - a vertical rectangle that demonstrates the levels of opening and closing trades; wicks or shadows - vertical lines above and below the body of the candle, reflecting fluctuations in value between opening and closing.
The main advantage of a candlestick over bars and a line chart is that it allows you to get four important indicators for technical analysis at once: High - the highest price for the period; Low - the lowest price for the period; Open - period opening price; Close - closing price of the period.
2) Trendline is a diagonal (never horizontal) line between two critical highs or lows, helping to determine a prevailing trend. Depending on the direction, it can be a downtrend or uptrend. You can draw the most reliable trendlines in larger timeframes (daily, weekly, or monthly). Trendline analysis helps to track only useful information on the chart and cut off minor deviations. This helps to focus and learn to see the bigger picture before making any market decision.
3) Resistance and Support levels are the two main horizontal price levels. At the support level, falling price tends to slow down or reverse. This means that the price is more likely to "bounce" from this level than break it. However, once the price breaks this level, it will likely continue to fall until it finds another support level. And vice versa: at the resistance level, a rising price tends to slow down or reverse. The price would rather bounce off this level than break it. However, a break above this level opens the way for the price to rise further until it finds another resistance level.
These are basic instruments that you can use while trading. Pay attention to them, and you’ll surely boost your trading skill! ✨

👍33🥰4👏3
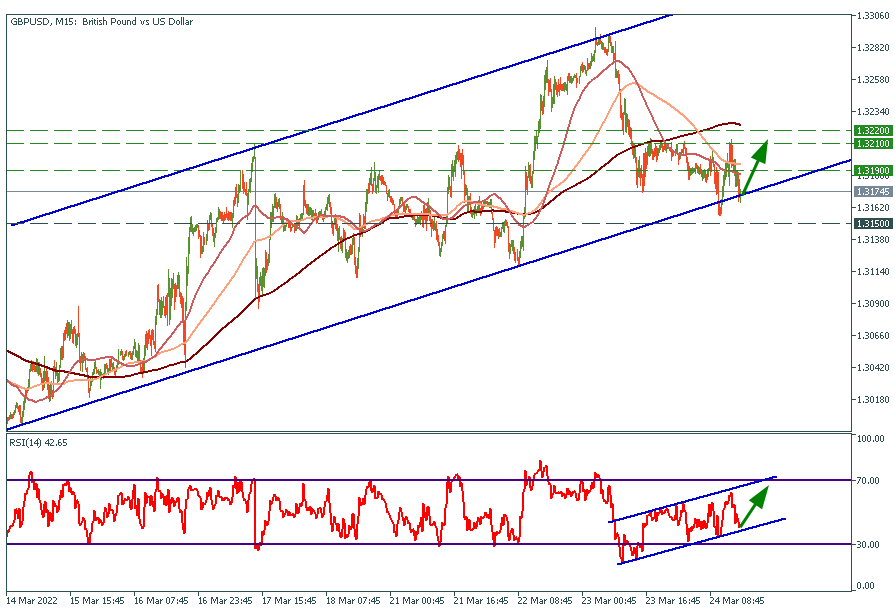
#MarketNews
🇯🇵The yen could weaken further to its 1990 low, according to Societe Generale SA strategist Albert Edwards. Now USDJPY is approximately $121.780.
📈The S&P 500, Dow Jones and Nasdaq closed Thursday's regular session up more than 1%. Contracts for the S&P 500 held on to a flat line. Despite some losses earlier this week, the S&P 500 and Nasdaq are up for the second week in a row if levels hold until Friday's close.
🇺🇸Federal Reserve has stepped up talk of tightening monetary policy. Now Chicago Fed President Charles Evans and San Francisco Fed President Mary Daly are considering raising interest rates by 50 basis points at the upcoming Fed meeting due to the highest inflation level in 40 years.
🛢Oil prices have stabilized after EU leaders refrained from new steps to reduce imports of Russian oil. XBR is $115.80 now.
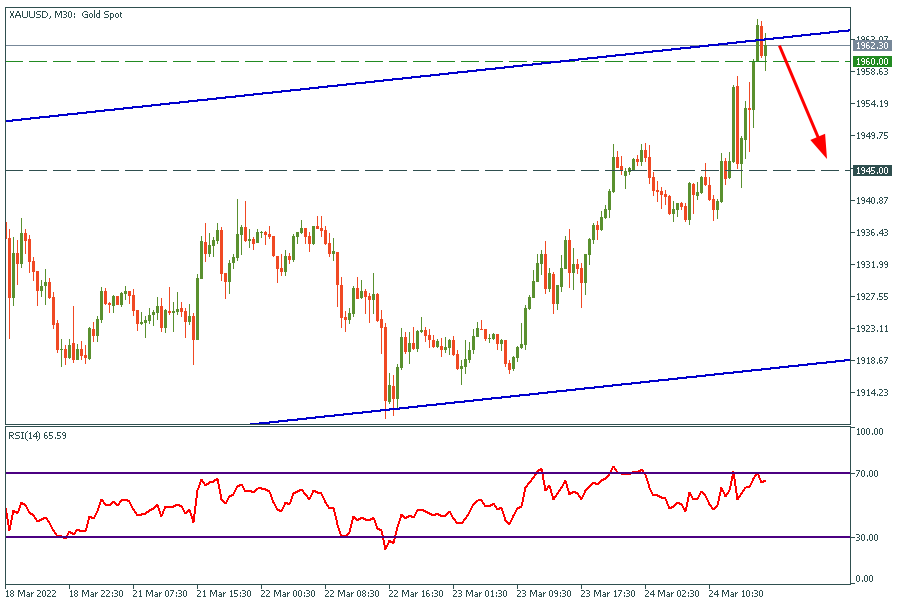
🟡Gold price rose to $1962.4 yesterday, approaching more than a weekly high in the previous session and gaining almost 2% in the week to date. Now it is about $1958.50 per ounce.
🇷🇺Russia is considering selling its oil and gas for crypto due to increased sanctions from the West. Thanks to that, Bitcoin has gained 4% since yesterday, it’s approximately $44071.
Have a great trading day! ✨
🇯🇵The yen could weaken further to its 1990 low, according to Societe Generale SA strategist Albert Edwards. Now USDJPY is approximately $121.780.
📈The S&P 500, Dow Jones and Nasdaq closed Thursday's regular session up more than 1%. Contracts for the S&P 500 held on to a flat line. Despite some losses earlier this week, the S&P 500 and Nasdaq are up for the second week in a row if levels hold until Friday's close.
🇺🇸Federal Reserve has stepped up talk of tightening monetary policy. Now Chicago Fed President Charles Evans and San Francisco Fed President Mary Daly are considering raising interest rates by 50 basis points at the upcoming Fed meeting due to the highest inflation level in 40 years.
🛢Oil prices have stabilized after EU leaders refrained from new steps to reduce imports of Russian oil. XBR is $115.80 now.
🟡Gold price rose to $1962.4 yesterday, approaching more than a weekly high in the previous session and gaining almost 2% in the week to date. Now it is about $1958.50 per ounce.
🇷🇺Russia is considering selling its oil and gas for crypto due to increased sanctions from the West. Thanks to that, Bitcoin has gained 4% since yesterday, it’s approximately $44071.
Have a great trading day! ✨
👍23👏5🔥3
🛢#Brent
The oil market cools down!
🇺🇸🇪🇺The United States talked with allies about a potential additional coordinated release from strategic petroleum reserves to ease the market tightness following Russia’s invasion of Ukraine.
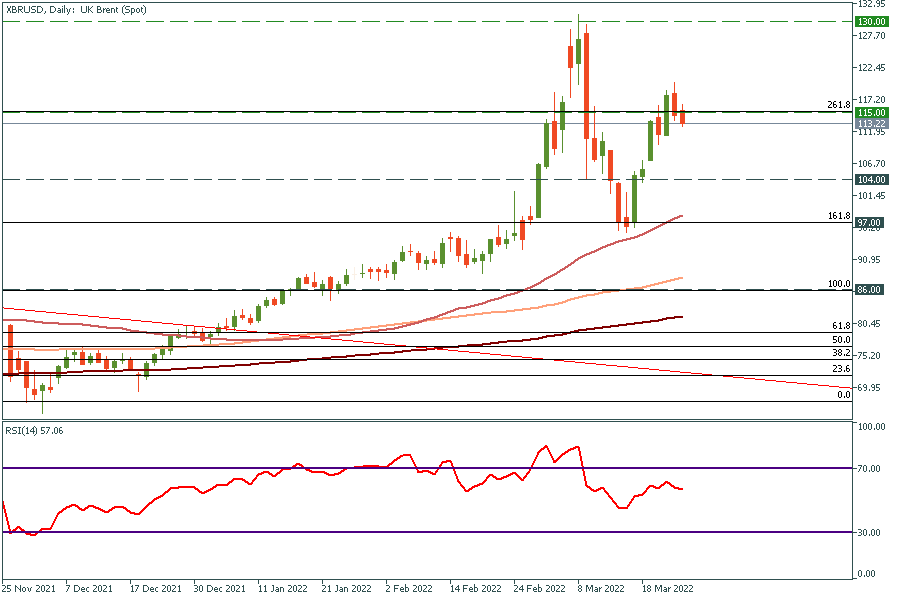
🔽As a result, XBRUSD reversed at the significant level of $115, which is the 261.8 Fibonacci level.
❗️We expect to see a further decline to $104 and $97 support levels.❗️
🤑Are you bullish or bearish about oil?
The oil market cools down!
🇺🇸🇪🇺The United States talked with allies about a potential additional coordinated release from strategic petroleum reserves to ease the market tightness following Russia’s invasion of Ukraine.
🔽As a result, XBRUSD reversed at the significant level of $115, which is the 261.8 Fibonacci level.
❗️We expect to see a further decline to $104 and $97 support levels.❗️
🤑Are you bullish or bearish about oil?
👍24🔥4👎2
☢️ #crypto
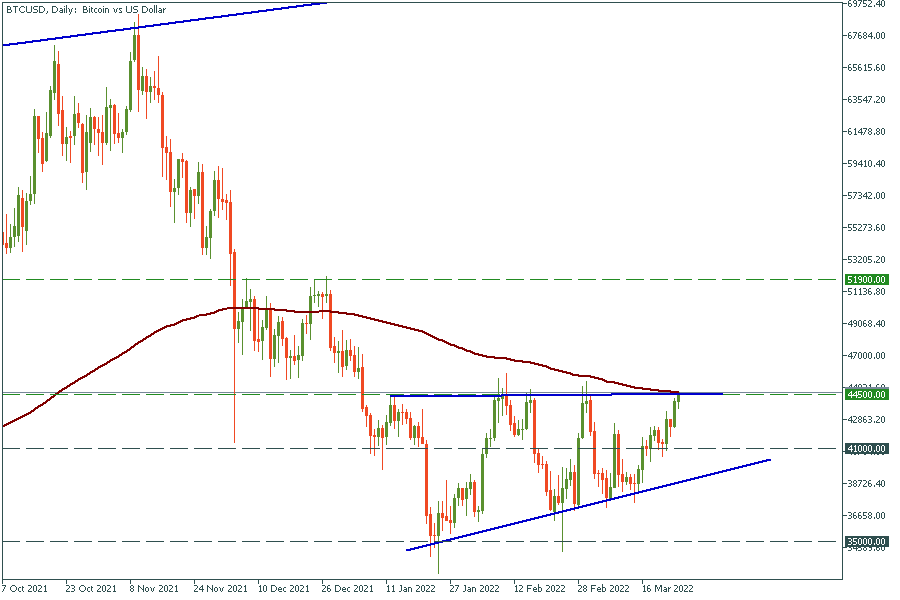
BTCUSD has formed the ascending triangle 🔺. At the moment, the price is testing the upper border of $45 000 & EMA200.
❗️There are two trading options right now:
🔴 Sell BTCUSD with the target of $41000, and very short stop-loss (above $45 000)
🟢 Buy with a target of $51 000 as soon as Bitcoin closes a daily candle above $44500.
Are there any crypto traders over here? 💪
✅I AM TRADING BTC✅
BTCUSD has formed the ascending triangle 🔺. At the moment, the price is testing the upper border of $45 000 & EMA200.
❗️There are two trading options right now:
🔴 Sell BTCUSD with the target of $41000, and very short stop-loss (above $45 000)
🟢 Buy with a target of $51 000 as soon as Bitcoin closes a daily candle above $44500.
Are there any crypto traders over here? 💪
✅I AM TRADING BTC✅
👍34🔥7🥰4😁2😱1
💥 Last week marked the consolidation for the most active assets of March 1-15 (which is oil and gold)
XBRUSD was oscillating between $96.00 and $120.00 per barrel, weakly reacting to the news from both sides of the geopolitical conflict. Gold did the same with price borders at $1970 and $1900 per ounce. But next week has a lot to show, be ready to take part!
😎 - https://bit.ly/3iD3A1W
XBRUSD was oscillating between $96.00 and $120.00 per barrel, weakly reacting to the news from both sides of the geopolitical conflict. Gold did the same with price borders at $1970 and $1900 per ounce. But next week has a lot to show, be ready to take part!
😎 - https://bit.ly/3iD3A1W
FBS
Trade ideas for March 28 - April 1
Last week marked the consolidation for the most active assets of March 1-15 (which is oil and gold). But next week has a lot to show, be ready to take part!
👍15👏2😁2
#Gold #GBPUSD #EURUSD #Bitcoin
Good morning, traders!
Our signals from the past week are playing out perfectly! 😱
🥇Gold - click. The yellow metal reversed from the upper border of the bearish flag and dropped under $1940. If you haven't opened a trade yet, don't worry. Consider opening a sell trade as soon as XAUUSD breaks through the lower border of the flag. In this case, your target will be $1900.
☢️Bitcoin - click. BTCUSD broke through $45 000 and increased above $47 000. We believe you've made a great profit, so we would advise closing a part of your position here. Great job!👍
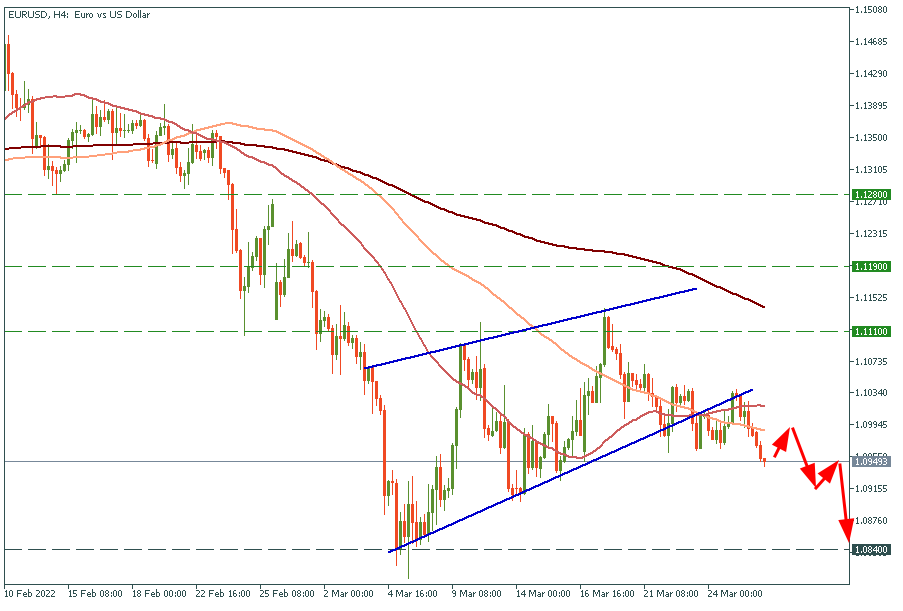
🇪🇺🇺🇸EURUSD - click. The pair did not reach our target. However, we have spotted a bearish pattern and the price is playing it perfectly out. EURUSD dropped out of the rising wedge. We expect a further decline to 1.0840. Consider selling this pair.
🇬🇧🇺🇸GBPUSD. The pair moves exactly as EURUSD does. Our target is 1.3000.
☢️ETHUSD - click. Great profit! You might close a part of your position!
What are your trade ideas for this week? Share in the comments!🙌
Good morning, traders!
Our signals from the past week are playing out perfectly! 😱
🥇Gold - click. The yellow metal reversed from the upper border of the bearish flag and dropped under $1940. If you haven't opened a trade yet, don't worry. Consider opening a sell trade as soon as XAUUSD breaks through the lower border of the flag. In this case, your target will be $1900.
☢️Bitcoin - click. BTCUSD broke through $45 000 and increased above $47 000. We believe you've made a great profit, so we would advise closing a part of your position here. Great job!👍
🇪🇺🇺🇸EURUSD - click. The pair did not reach our target. However, we have spotted a bearish pattern and the price is playing it perfectly out. EURUSD dropped out of the rising wedge. We expect a further decline to 1.0840. Consider selling this pair.
🇬🇧🇺🇸GBPUSD. The pair moves exactly as EURUSD does. Our target is 1.3000.
☢️ETHUSD - click. Great profit! You might close a part of your position!
What are your trade ideas for this week? Share in the comments!🙌
👍37🔥8🥰6❤4😁3
🥇#GOLD
❗️Attention❗️
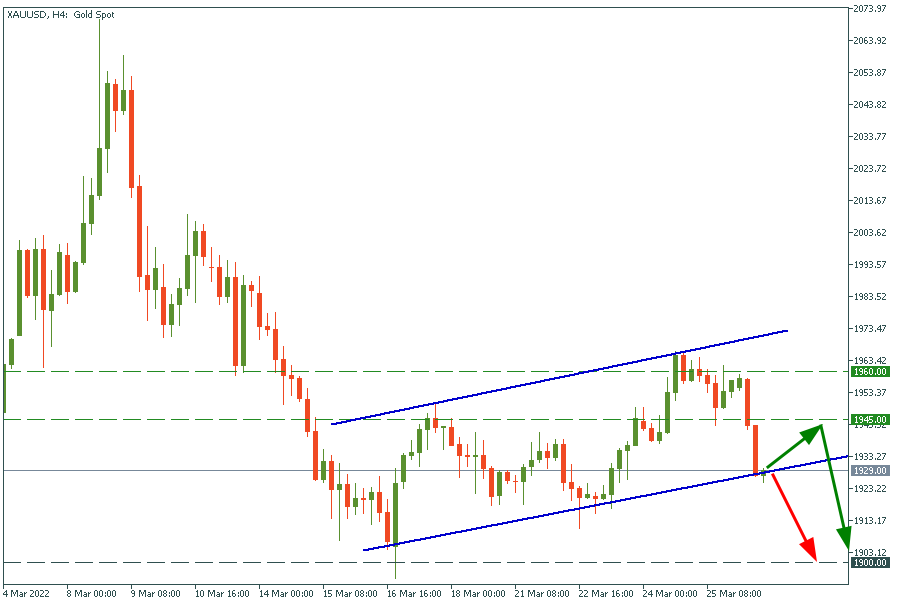
Gold reached the lower border of the bearish flag. The price is testing it!
🟢Those who do not see their lives without risks might open a buy trade with short stop-loss and low volume! The target is $1945!
🔴Those, who prefer to avoid risks, need to wait until the price breaks through this support line and open a sell trade with the target at $1900!
Good luck to everyone👍
✅TRADE GOLD✅
❗️Attention❗️
Gold reached the lower border of the bearish flag. The price is testing it!
🟢Those who do not see their lives without risks might open a buy trade with short stop-loss and low volume! The target is $1945!
🔴Those, who prefer to avoid risks, need to wait until the price breaks through this support line and open a sell trade with the target at $1900!
Good luck to everyone👍
✅TRADE GOLD✅
👍37🔥12❤4👏1
🇺🇸🇯🇵#USDJPY
🔥USDJPY reached our target!
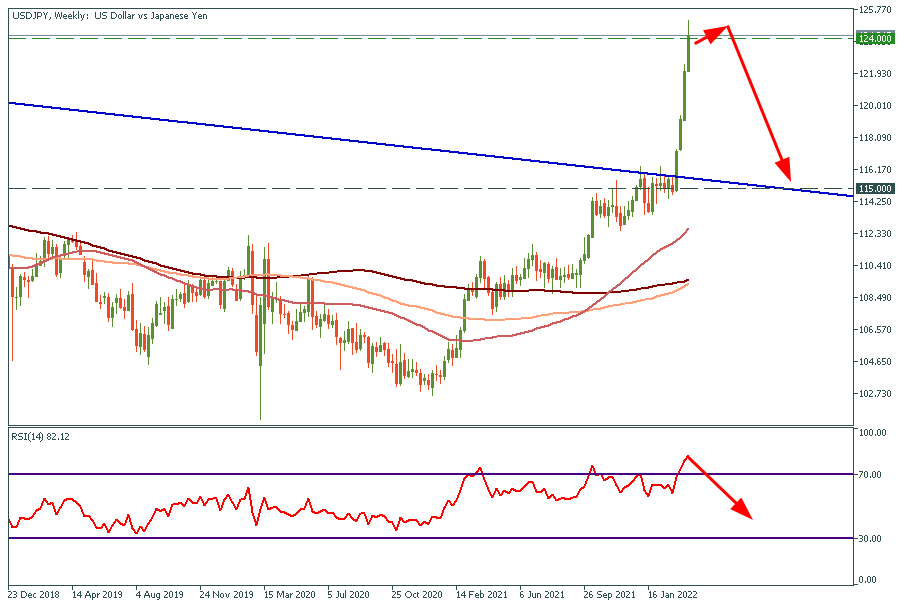
In the article, we predicted an increase in 🇺🇸USDJPY🇯🇵 to 124. Only three trading sessions later, the pair reached this target!
What is next?
☝️124 is the global resistance level. The last time the price increased that high was in 2015. We expect the pair to cool down a little before the rally might continue further. That's why we suggest looking for SELL trades from the current level.
✅SELL USDJPY✅
🔥USDJPY reached our target!
In the article, we predicted an increase in 🇺🇸USDJPY🇯🇵 to 124. Only three trading sessions later, the pair reached this target!
What is next?
☝️124 is the global resistance level. The last time the price increased that high was in 2015. We expect the pair to cool down a little before the rally might continue further. That's why we suggest looking for SELL trades from the current level.
✅SELL USDJPY✅
👍35👏1
Which currency has risen the most against USD since the beginning of 2022?
Anonymous Quiz
35%
NZD
8%
BRL
18%
CHF
39%
CAD
👍32👏7🔥5😱2
FBS Analytics
🥇#GOLD ❗️Attention❗️ Gold reached the lower border of the bearish flag. The price is testing it! 🟢Those who do not see their lives without risks might open a buy trade with short stop-loss and low volume! The target is $1945! 🔴Those, who prefer to avoid…
This media is not supported in your browser
VIEW IN TELEGRAM
🔥35👍9🤯8😁6👎5😱4💩4
🇬🇧🇺🇸#GBPUSD
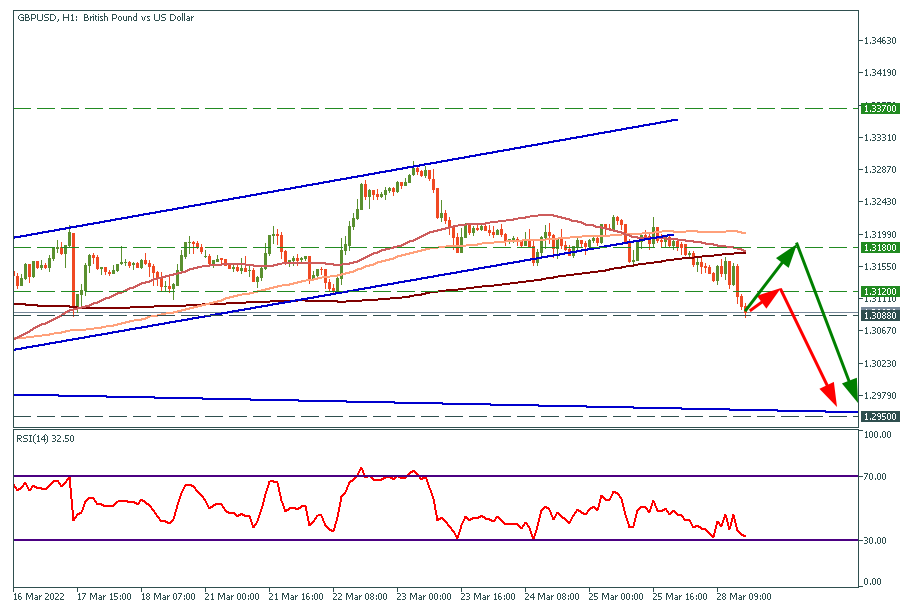
👇Sellers attack the last support before they drag GBPUSD to 1.2950.
As usual, there are two options right now:
🟢 Risky one. BUY GBPUSD with targets at 1.3120 and 1.3150.
🔴 Consider opening a SELL trade as soon as GBPUSD breaks through 1.3088. Target is 1.2950.
✅TRADE GBPUSD✅
👇Sellers attack the last support before they drag GBPUSD to 1.2950.
As usual, there are two options right now:
🟢 Risky one. BUY GBPUSD with targets at 1.3120 and 1.3150.
🔴 Consider opening a SELL trade as soon as GBPUSD breaks through 1.3088. Target is 1.2950.
✅TRADE GBPUSD✅
👍24
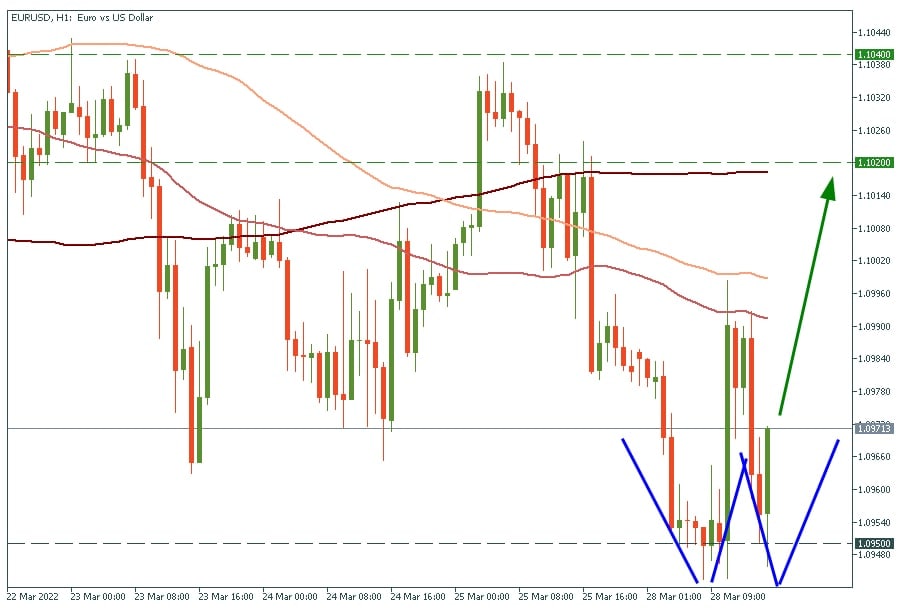
🇪🇺🇺🇸#EURUSD
👍EURUSD has formed a double bottom pattern.
✅You might open a BUY trade with targets at 1.0990. 1.1020, 1.1040.
✅TRADE EURUSD✅
👍EURUSD has formed a double bottom pattern.
✅You might open a BUY trade with targets at 1.0990. 1.1020, 1.1040.
✅TRADE EURUSD✅
👍34❤6🔥2🥰2👏1