
🥇#XAUUSD
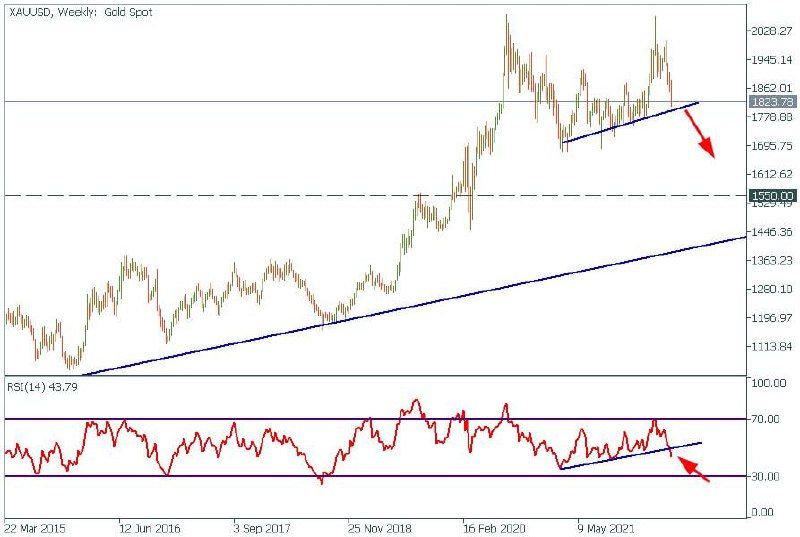
🔥🐻The massive bearish signal has appeared on the XAUUSD RSI indicator!
The RSI broke through the support trendline on the weekly timeframe, which signals the bearish trend continuation. If RSI closes this week below the trendline, XAUUSD might break through its trendline next week. In this case, middle-term targets will be $1700 and $1550.
🥲Do you still believe XAUUSD can recover?
🔥🐻The massive bearish signal has appeared on the XAUUSD RSI indicator!
The RSI broke through the support trendline on the weekly timeframe, which signals the bearish trend continuation. If RSI closes this week below the trendline, XAUUSD might break through its trendline next week. In this case, middle-term targets will be $1700 and $1550.
🥲Do you still believe XAUUSD can recover?
👍28👏4❤2
#MarketNews
Good morning traders! Here is some news that move the market today!
🇪🇺🛢🇷🇺On May 16, the EU will discuss the 6th sanctions package and the oil embargo against Russia.
🇨🇳Asian markets are green. Since the US's inflation and unemployment rate overperformed forecasts, the Chinese economy looks more stable, supported by oil prices. The over-fulfillment of the OPEC + deal and forecasts for cheaper oil will positively impact the Chinese economy aimed at production.
🇺🇸The American market is growing despite weak macro data. The June interest rate decision is on the horizon. Positive brings the decline in oil prices.
🇺🇸Powell: It will not be easy for the US government to achieve a "soft landing" for the US economy in the current geopolitical conditions, keeping it from sliding into recession. Buy the deep?
😱Robinhood +30% after FTX CEO reveals purchase of 7.6% stake of the platform.
What are you trading today? Share in the comments!
Good morning traders! Here is some news that move the market today!
🇪🇺🛢🇷🇺On May 16, the EU will discuss the 6th sanctions package and the oil embargo against Russia.
🇨🇳Asian markets are green. Since the US's inflation and unemployment rate overperformed forecasts, the Chinese economy looks more stable, supported by oil prices. The over-fulfillment of the OPEC + deal and forecasts for cheaper oil will positively impact the Chinese economy aimed at production.
🇺🇸The American market is growing despite weak macro data. The June interest rate decision is on the horizon. Positive brings the decline in oil prices.
🇺🇸Powell: It will not be easy for the US government to achieve a "soft landing" for the US economy in the current geopolitical conditions, keeping it from sliding into recession. Buy the deep?
😱Robinhood +30% after FTX CEO reveals purchase of 7.6% stake of the platform.
What are you trading today? Share in the comments!
👍21

#Indicators
🤩Hello, everybody!
If you start to dive into the forex world, we’re sure you heard about different indicators that you can use. Every trader has their own favorite one that they prefer to use. How to choose it? Where to look at it? Why do we need it?
We’re glad to announce the “Best indicator of the week” section. There you’ll learn various indicators and their features. We’ll start with one of the most popular ones- the RSI indicator.
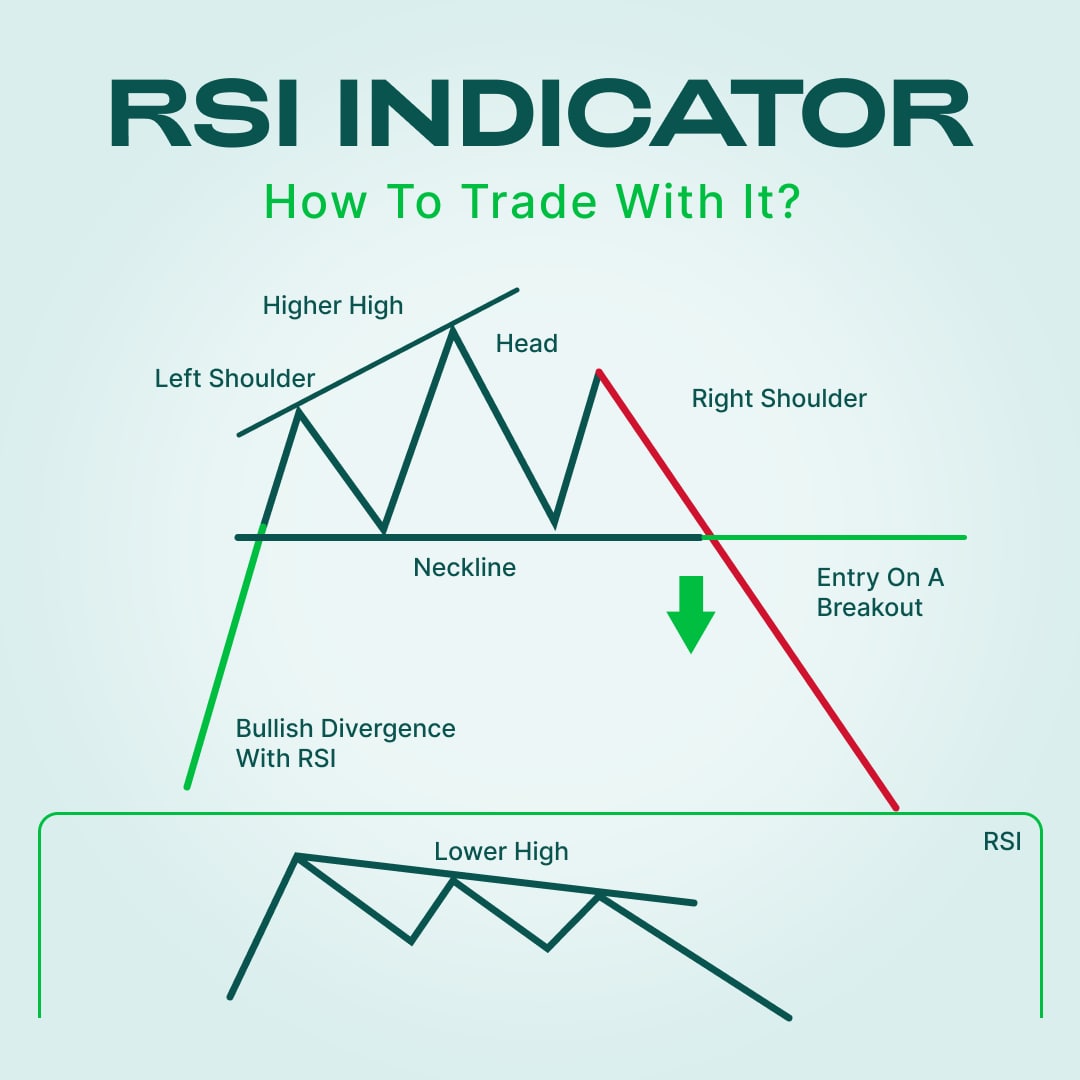
Relative Strength Index or RSI indicator is a momentum oscillator that measures the strength and momentum of price movements. It oscillates between 0 and 100 and by default, it’s considered overbought when it’s above 70 and oversold when it is below 30. 50 is the golden mean there, so if it’s higher than this level, the trend is bullish; otherwise, it’s bearish.
So, how to trade using the RSI indicator? Let’s look at the bullish example. We notice that the price rises and there are several higher highs. However, RSI shows a decrease with more than two lower highs. This divergence proves that the chance of trend reversing is really high. It looks like a head and shoulders pattern. We recommend entering the trade at the moment of a neckline breakdown.
RSI works best when there’s no clear trend because, in another case, it will be useless. However, if the trend is unstable, RSI can give some great signals!
For more facts about RSI, visit the FBS website: https://bit.ly/3wbJ5kw
🤩Hello, everybody!
If you start to dive into the forex world, we’re sure you heard about different indicators that you can use. Every trader has their own favorite one that they prefer to use. How to choose it? Where to look at it? Why do we need it?
We’re glad to announce the “Best indicator of the week” section. There you’ll learn various indicators and their features. We’ll start with one of the most popular ones- the RSI indicator.
Relative Strength Index or RSI indicator is a momentum oscillator that measures the strength and momentum of price movements. It oscillates between 0 and 100 and by default, it’s considered overbought when it’s above 70 and oversold when it is below 30. 50 is the golden mean there, so if it’s higher than this level, the trend is bullish; otherwise, it’s bearish.
So, how to trade using the RSI indicator? Let’s look at the bullish example. We notice that the price rises and there are several higher highs. However, RSI shows a decrease with more than two lower highs. This divergence proves that the chance of trend reversing is really high. It looks like a head and shoulders pattern. We recommend entering the trade at the moment of a neckline breakdown.
RSI works best when there’s no clear trend because, in another case, it will be useless. However, if the trend is unstable, RSI can give some great signals!
For more facts about RSI, visit the FBS website: https://bit.ly/3wbJ5kw
👍28🥰18👏3😁2
#MarketNews
🎉Hello, dear traders! Here is some news you need to know on Monday:
🇺🇸The soaring dollar is pushing the global economy into a deeper, synchronized slowdown, driving up borrowing costs and fueling financial market volatility, with little respite on the horizon. The closely watched dollar indicator has risen 7% since January to a two-year high as the Federal Reserve embarks on an aggressive series of interest rate hikes to curb inflation. Investors have been buying dollars as a safe haven amid economic uncertainty.
🛢Saudi Aramco reported its highest profit since its record listing on the stock exchange after oil prices soared following Russia's invasion of Ukraine. Aramco, which surpassed Apple Inc. last week and became the most valuable company in the world, following competitors from major oil companies such as Shell Plc and BP Plc, reported strong first quarter earnings. Like them, the Saudi firm's performance was boosted by a jump in oil to $110 a barrel after Moscow's attack in late February.
🇯🇵The yen edged higher against all its major peers after weaker-than-expected data from China fueled investor fears that the global economy is heading for a sustained slowdown. USDJPY is $129.00.
😱Geopolitical worries in Europe over a Russian invasion of Ukraine are likely to remain a focus for investors as moves by Finland and Sweden to join the North Atlantic Treaty Organization could escalate tensions.
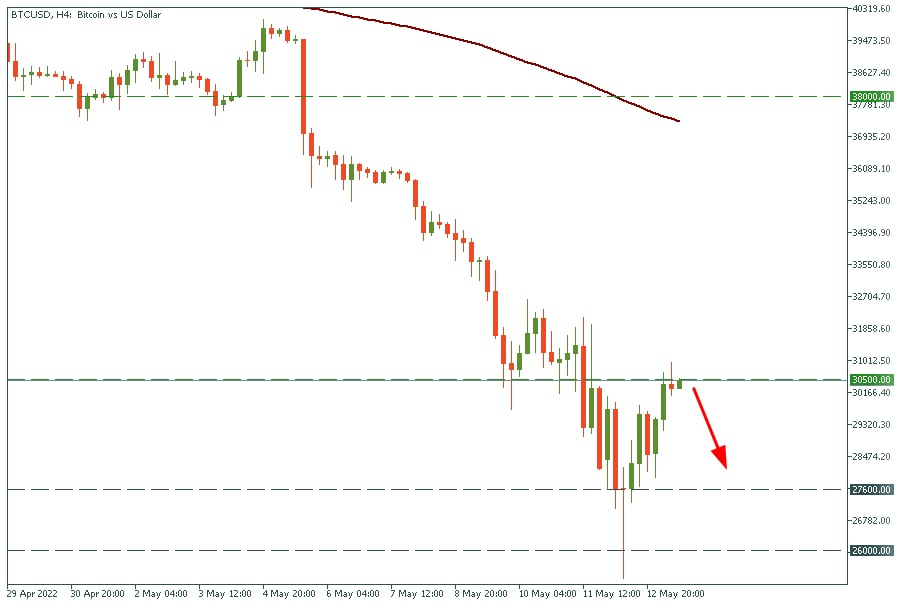
☢️Bitcoin is down 2.2% and is trading at $30,360. Other cryptos, including Ethereum and Avalanche, are also in the red. Overall, however, the digital asset markets have been calmer compared to last week’s turmoil due to the stablecoin crash.
What are your thoughts for this week? Share in the comments!⬇️
🎉Hello, dear traders! Here is some news you need to know on Monday:
🇺🇸The soaring dollar is pushing the global economy into a deeper, synchronized slowdown, driving up borrowing costs and fueling financial market volatility, with little respite on the horizon. The closely watched dollar indicator has risen 7% since January to a two-year high as the Federal Reserve embarks on an aggressive series of interest rate hikes to curb inflation. Investors have been buying dollars as a safe haven amid economic uncertainty.
🛢Saudi Aramco reported its highest profit since its record listing on the stock exchange after oil prices soared following Russia's invasion of Ukraine. Aramco, which surpassed Apple Inc. last week and became the most valuable company in the world, following competitors from major oil companies such as Shell Plc and BP Plc, reported strong first quarter earnings. Like them, the Saudi firm's performance was boosted by a jump in oil to $110 a barrel after Moscow's attack in late February.
🇯🇵The yen edged higher against all its major peers after weaker-than-expected data from China fueled investor fears that the global economy is heading for a sustained slowdown. USDJPY is $129.00.
😱Geopolitical worries in Europe over a Russian invasion of Ukraine are likely to remain a focus for investors as moves by Finland and Sweden to join the North Atlantic Treaty Organization could escalate tensions.
☢️Bitcoin is down 2.2% and is trading at $30,360. Other cryptos, including Ethereum and Avalanche, are also in the red. Overall, however, the digital asset markets have been calmer compared to last week’s turmoil due to the stablecoin crash.
What are your thoughts for this week? Share in the comments!⬇️
👍33❤3🔥1
✅ We have prepared several trade ideas for you, make this week profitable!!!
⬇️
https://bit.ly/3yFnYbY
⬆️
⬇️
https://bit.ly/3yFnYbY
⬆️
FBS
What to trade on May 16-20?
Last week brought a selloff in markets. Some assets reached the most crucial support levels and are likely to reverse in a short term. Be ahead of trends and make the most out of this week!
👍27❤9🔥3🥰1
🥇#Gold #XAUUSD
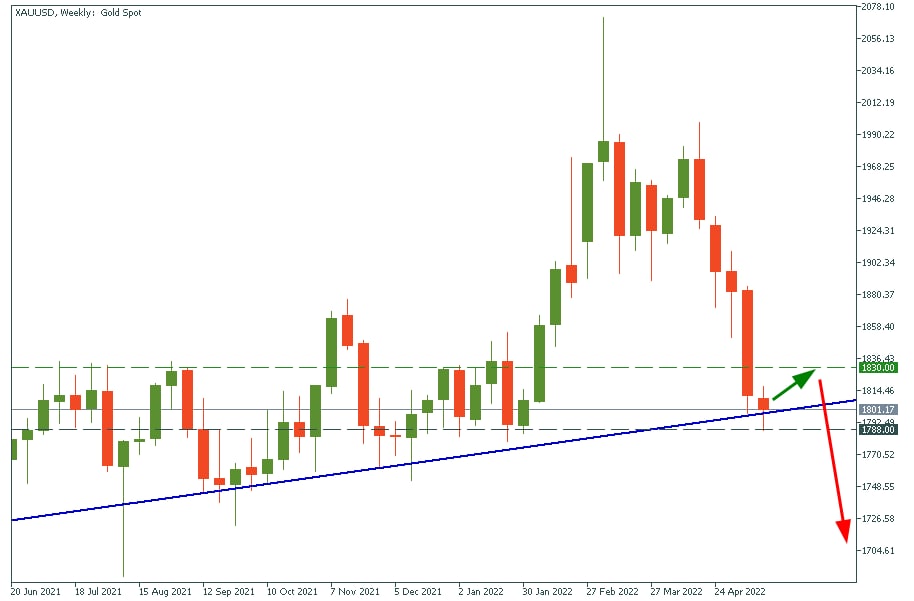
🔥⚡️Gold reached the support trend line!
The breakout of this support is just a matter of time. However, we expect to see a pullback to $1830 within a couple of trading sessions.
Entry: $1788
TP: $1830
Potential profit: >4200 points
😎TRADE GOLD😎
🔥⚡️Gold reached the support trend line!
The breakout of this support is just a matter of time. However, we expect to see a pullback to $1830 within a couple of trading sessions.
Entry: $1788
TP: $1830
Potential profit: >4200 points
😎TRADE GOLD😎
👍36🔥7🥰4🤔4👏1
👀Is the oil market rally coming?
Today, the European Union will decide on an embargo on Russian oil imports. If it happens, the Russian crude oil could drop to the lowest level since 2004, according to the International Energy Agency. At the same time, it will boost the price of both Brent and WTI.
Josep Borrell, of of the top EU policymakers, sees high chances of reaching an agreement on the Russian oil ban. So, we need to get ready for bullish momentum in the crude prices. If the EU finalizes an agreement, XTIUSD will cross the $115 level and target March's high at $126. XBRUSD will cross the $120 mark and move up to $130.
Don't miss an opportunity to trade oil on big event with FBS
🔥 https://bit.ly/3ykTPvC 🔥
Today, the European Union will decide on an embargo on Russian oil imports. If it happens, the Russian crude oil could drop to the lowest level since 2004, according to the International Energy Agency. At the same time, it will boost the price of both Brent and WTI.
Josep Borrell, of of the top EU policymakers, sees high chances of reaching an agreement on the Russian oil ban. So, we need to get ready for bullish momentum in the crude prices. If the EU finalizes an agreement, XTIUSD will cross the $115 level and target March's high at $126. XBRUSD will cross the $120 mark and move up to $130.
Don't miss an opportunity to trade oil on big event with FBS
🔥 https://bit.ly/3ykTPvC 🔥

👍18🔥2🥰2❤1
Walmart will release its earnings report tomorrow. We bet you want to earn on this! Then go check the article we made for you 💚
⬇️
https://bit.ly/3whCAg4
⬆️
And tell us what you think in the comments! It is a SELL for Walmart?
⬇️
https://bit.ly/3whCAg4
⬆️
And tell us what you think in the comments! It is a SELL for Walmart?
FBS
Walmart earnings outlook
Walmart is one of the biggest retail corporations in the US, with $244 billion in total assets. Does it worth buying amid rising prices and supply concerns that shatter the world economy?
👍13❤10👏3
🇪🇺🇺🇸#EURUSD
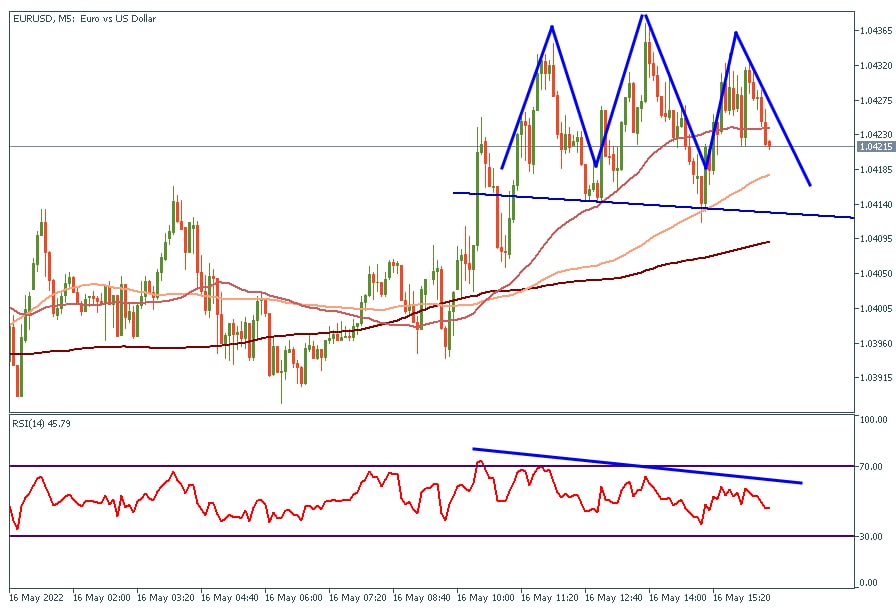
EURUSD forms the "head and shoulders" pattern with the bearish divergence!
Do not miss a breakout! 👍
🟥 I AM SELLING EURUSD 🟥
EURUSD forms the "head and shoulders" pattern with the bearish divergence!
Do not miss a breakout! 👍
🟥 I AM SELLING EURUSD 🟥
🔥19👍8👏6🤔2
🐦 #Twitter
The stock is trying to find a bottom. Also, RSI is near the oversold zone. Thus, the reversal may start soon. The stock needs to stay above the $34.80 support line to retest the resistance of $38.50 per share
If Elon Musk doesn't make another statement about Twitter, the stock will probably reach the last bottom at the $31.00
What are your thoughts on Twitter and Musk?
The stock is trying to find a bottom. Also, RSI is near the oversold zone. Thus, the reversal may start soon. The stock needs to stay above the $34.80 support line to retest the resistance of $38.50 per share
If Elon Musk doesn't make another statement about Twitter, the stock will probably reach the last bottom at the $31.00
What are your thoughts on Twitter and Musk?

👍13🔥5
🧐Do you use harmonic patterns in your trading strategy?
Maybe it's time to add some!
Read the article and learn about an awesome "Cypher" harmonic pattern!
Read the article: https://bit.ly/3Nf5PWm
Maybe it's time to add some!
Read the article and learn about an awesome "Cypher" harmonic pattern!
Read the article: https://bit.ly/3Nf5PWm

👍14🤔3
⛽️#NaturalGas
🔥The gas crisis in Europe is about to be finished!
More than 25 European companies have already opened special accounts in Russian banks as Europe decided to pay for the Russian Natural gas in rubles. Gas prices are facing a significant correction.
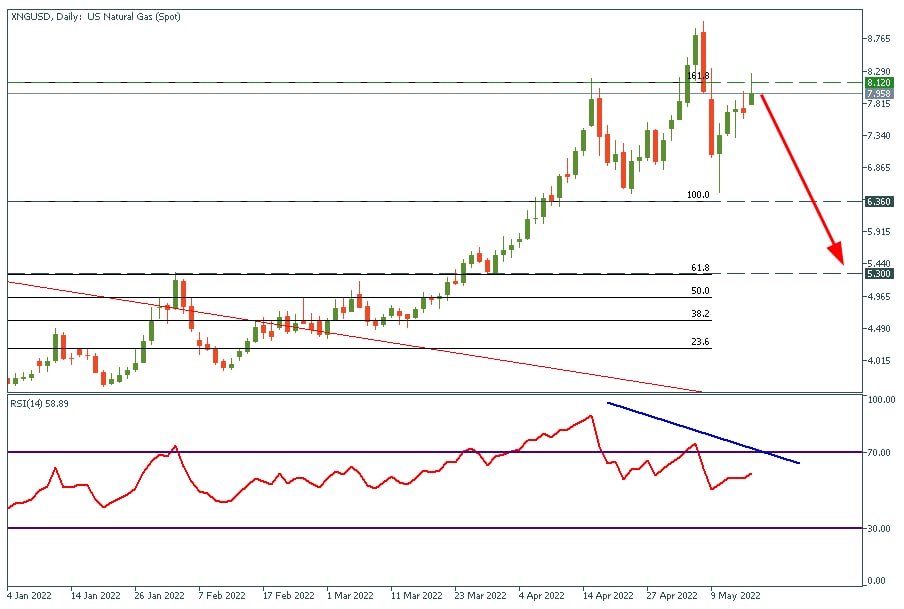
As we can see on the daily XNGUSD chart, the price can't stay above the 161.8 Fibonacci level. Moreover, the price might form a "head and shoulders" pattern with a bearish divergence, which is the massive reversal setup.
If you are a swing trader and you're not scared to hold your trade over some nights, consider opening a SELL trade with targets at $6.36 and $5.30.
🔥🔥🔥This trade might bring you more than 20% profit!
🔥The gas crisis in Europe is about to be finished!
More than 25 European companies have already opened special accounts in Russian banks as Europe decided to pay for the Russian Natural gas in rubles. Gas prices are facing a significant correction.
As we can see on the daily XNGUSD chart, the price can't stay above the 161.8 Fibonacci level. Moreover, the price might form a "head and shoulders" pattern with a bearish divergence, which is the massive reversal setup.
If you are a swing trader and you're not scared to hold your trade over some nights, consider opening a SELL trade with targets at $6.36 and $5.30.
🔥🔥🔥This trade might bring you more than 20% profit!
🔥16👍8👎1
#MarketNews
☀️ Morning, traders! It’s time to dive into another trading session, and here’s what you should know:
🇦🇺 Reserve Bank of Australia: RBA minutes show the RBA considered a 40bp hike in May. The current interest rate is very low (0.35%). RBA members said the rate hike is needed to prevent inflation from fast growth
📹 Don’t miss the stream in Telegram today at 15:15 GMT+3. We will trade on the US retail sales reading and analyze related assets
⛽️ Russian gas transit through Ukraine to Europe is down by almost a third after Kyiv suspends supplies
👷♂️Jobless claims in the US tick up to 203 000 and remain near the lowest in decades. The level of weekly jobless claims shows the strength of the labor market
💸 El Salvador’s crypto-loving president is hosting the Davos for Bitcoin, with more than 40 countries represented
🇹🇭 Thailand lowers GDP outlook due to war in Ukraine. Full-year growth estimates cut one percentage point to 2.5%-3.5%. Inflation forecast raised to 4.2%-5.2% amid supply disruptions
🛢 XBRUSD reached the last local high of $113.00 amid a possible oil embargo. Hungary denied the EU proposal because the consequences for the country’s economy would be terrifying
🍀 What are you trading today? Share your thoughts!
☀️ Morning, traders! It’s time to dive into another trading session, and here’s what you should know:
🇦🇺 Reserve Bank of Australia: RBA minutes show the RBA considered a 40bp hike in May. The current interest rate is very low (0.35%). RBA members said the rate hike is needed to prevent inflation from fast growth
📹 Don’t miss the stream in Telegram today at 15:15 GMT+3. We will trade on the US retail sales reading and analyze related assets
⛽️ Russian gas transit through Ukraine to Europe is down by almost a third after Kyiv suspends supplies
👷♂️Jobless claims in the US tick up to 203 000 and remain near the lowest in decades. The level of weekly jobless claims shows the strength of the labor market
💸 El Salvador’s crypto-loving president is hosting the Davos for Bitcoin, with more than 40 countries represented
🇹🇭 Thailand lowers GDP outlook due to war in Ukraine. Full-year growth estimates cut one percentage point to 2.5%-3.5%. Inflation forecast raised to 4.2%-5.2% amid supply disruptions
🛢 XBRUSD reached the last local high of $113.00 amid a possible oil embargo. Hungary denied the EU proposal because the consequences for the country’s economy would be terrifying
🍀 What are you trading today? Share your thoughts!
👍17🥰5🔥3
🔥Central banks are about to make statements!
Today, at 20:00 MT European central bank’s president is going to make her speech! Just after that, at 21:00 MT the Federal Reserve chair will make a statement about inflation. These events usually give a sense of volatility as traders try to decipher interest rate clues.
As the heads of the central bank who control short-term interest rates, Christine Lagarde and Jerome Powell have more influence on the value of the US dollar and the Euro than any other people. Traders pay attention to their public statements as they help give subtle clues about future monetary policy.
Use the chance to trade EURUSD, XAUUSD, EURJPY, USDCAD!
🟩 https://bit.ly/3ykTPvC 🟩
Today, at 20:00 MT European central bank’s president is going to make her speech! Just after that, at 21:00 MT the Federal Reserve chair will make a statement about inflation. These events usually give a sense of volatility as traders try to decipher interest rate clues.
As the heads of the central bank who control short-term interest rates, Christine Lagarde and Jerome Powell have more influence on the value of the US dollar and the Euro than any other people. Traders pay attention to their public statements as they help give subtle clues about future monetary policy.
Use the chance to trade EURUSD, XAUUSD, EURJPY, USDCAD!
🟩 https://bit.ly/3ykTPvC 🟩

👍18❤5🔥2😁2🎉1
#Education
ABC of analysis🎓
Hello traders! ✨
There are some topics that spark never-ending debate and sow discord among people. What to buy – iPhone or Android? Which football team to support – Manchester United or Liverpool? You might have noticed that there’s no clear-cut answer to these questions. In Forex, the debates are the same - which analysis is better: fundamental or technical?
In general, a trader’s success hugely depends on the quality of the analysis made. Although it’s common knowledge that a trader should rely on both fundamental and technical analyses, some traders still prefer one to another.
1) Technical analysis is based on the price movement patterns and technical tools in their analysis and doesn’t pay much heed to the economic news flow. Technical analysis is the same for Forex and stock trading. Traders typically open the chart and follow the price action to predict where the price will move next. They often use different technical tools to recognize trends and trend reversals and try to identify some chart patterns. Technical indicators are based on mathematical formulas, but traders don’t need to get into them as they are graphically represented for simplicity. When some technical indicators become favorite for a trader, he/she can start creating his own investment strategy!
2) Fundamental analysis explains which fundamental (economic) factors caused the price moves seen on the chart and what factors will determine the price movements in future. It differs for Forex and stock trading. When a person trades currency pairs, he/she takes into consideration the dynamics of economic indicators and news events, gathered in the economic calendar. When a person trades stocks, he/she bases his/her bets on earnings reports, which reveal how the company performed in the previous quarter.
Both fundamental and technical analyses have their advantages and drawbacks, so it’s best to combine these two methods. This way you will get the fullest view of what is happening at the market. While trading on the intraday use technical analysis first to determine the state of the market, trade entry and exit levels. Then use fundamental analysis to adjust your strategy taking into account events of the economic calendar. In the longer-term trade firstly determine the trend with the help of fundamental analysis and then look for an entry and exit point using technical analysis tools.
What team are you: fundamental or technical analysis? Share in the comment!
⬇️
ABC of analysis🎓
Hello traders! ✨
There are some topics that spark never-ending debate and sow discord among people. What to buy – iPhone or Android? Which football team to support – Manchester United or Liverpool? You might have noticed that there’s no clear-cut answer to these questions. In Forex, the debates are the same - which analysis is better: fundamental or technical?
In general, a trader’s success hugely depends on the quality of the analysis made. Although it’s common knowledge that a trader should rely on both fundamental and technical analyses, some traders still prefer one to another.
1) Technical analysis is based on the price movement patterns and technical tools in their analysis and doesn’t pay much heed to the economic news flow. Technical analysis is the same for Forex and stock trading. Traders typically open the chart and follow the price action to predict where the price will move next. They often use different technical tools to recognize trends and trend reversals and try to identify some chart patterns. Technical indicators are based on mathematical formulas, but traders don’t need to get into them as they are graphically represented for simplicity. When some technical indicators become favorite for a trader, he/she can start creating his own investment strategy!
2) Fundamental analysis explains which fundamental (economic) factors caused the price moves seen on the chart and what factors will determine the price movements in future. It differs for Forex and stock trading. When a person trades currency pairs, he/she takes into consideration the dynamics of economic indicators and news events, gathered in the economic calendar. When a person trades stocks, he/she bases his/her bets on earnings reports, which reveal how the company performed in the previous quarter.
Both fundamental and technical analyses have their advantages and drawbacks, so it’s best to combine these two methods. This way you will get the fullest view of what is happening at the market. While trading on the intraday use technical analysis first to determine the state of the market, trade entry and exit levels. Then use fundamental analysis to adjust your strategy taking into account events of the economic calendar. In the longer-term trade firstly determine the trend with the help of fundamental analysis and then look for an entry and exit point using technical analysis tools.
What team are you: fundamental or technical analysis? Share in the comment!
⬇️

👍26🔥6❤2🎉2