
#Indicators
🤩Hello, everybody!
If you start to dive into the forex world, we’re sure you heard about different indicators that you can use. Every trader has their own favorite one that they prefer to use. How to choose it? Where to look at it? Why do we need it?
We’re glad to announce the “Best indicator of the week” section. There you’ll learn various indicators and their features. We’ll start with one of the most popular ones- the RSI indicator.
Relative Strength Index or RSI indicator is a momentum oscillator that measures the strength and momentum of price movements. It oscillates between 0 and 100 and by default, it’s considered overbought when it’s above 70 and oversold when it is below 30. 50 is the golden mean there, so if it’s higher than this level, the trend is bullish; otherwise, it’s bearish.
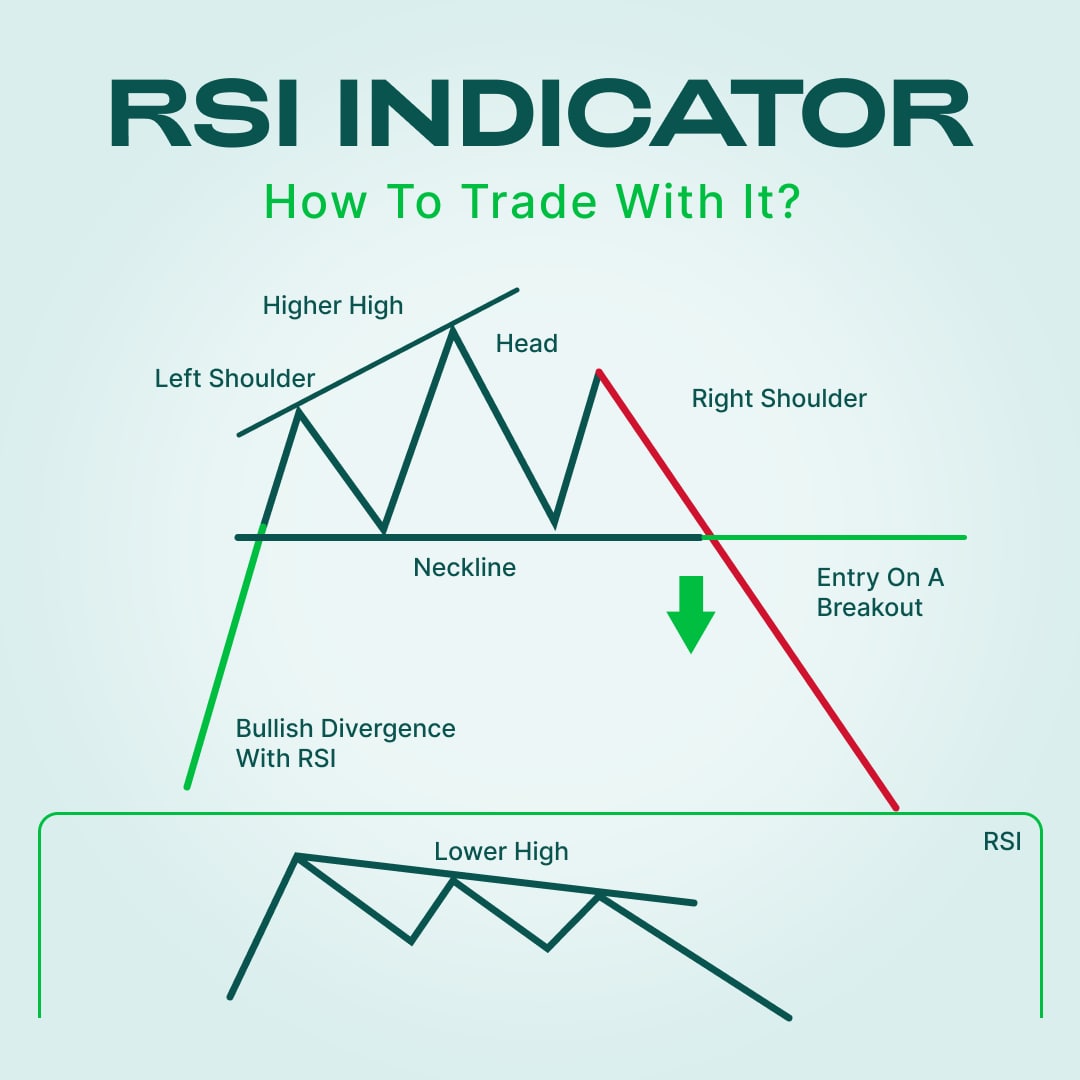
So, how to trade using the RSI indicator? Let’s look at the bullish example. We notice that the price rises and there are several higher highs. However, RSI shows a decrease with more than two lower highs. This divergence proves that the chance of trend reversing is really high. It looks like a head and shoulders pattern. We recommend entering the trade at the moment of a neckline breakdown.
RSI works best when there’s no clear trend because, in another case, it will be useless. However, if the trend is unstable, RSI can give some great signals!
For more facts about RSI, visit the FBS website: https://bit.ly/3wbJ5kw
🤩Hello, everybody!
If you start to dive into the forex world, we’re sure you heard about different indicators that you can use. Every trader has their own favorite one that they prefer to use. How to choose it? Where to look at it? Why do we need it?
We’re glad to announce the “Best indicator of the week” section. There you’ll learn various indicators and their features. We’ll start with one of the most popular ones- the RSI indicator.
Relative Strength Index or RSI indicator is a momentum oscillator that measures the strength and momentum of price movements. It oscillates between 0 and 100 and by default, it’s considered overbought when it’s above 70 and oversold when it is below 30. 50 is the golden mean there, so if it’s higher than this level, the trend is bullish; otherwise, it’s bearish.
So, how to trade using the RSI indicator? Let’s look at the bullish example. We notice that the price rises and there are several higher highs. However, RSI shows a decrease with more than two lower highs. This divergence proves that the chance of trend reversing is really high. It looks like a head and shoulders pattern. We recommend entering the trade at the moment of a neckline breakdown.
RSI works best when there’s no clear trend because, in another case, it will be useless. However, if the trend is unstable, RSI can give some great signals!
For more facts about RSI, visit the FBS website: https://bit.ly/3wbJ5kw
👍28🥰18👏3😁2