
🇺🇸🇨🇦#USDCAD
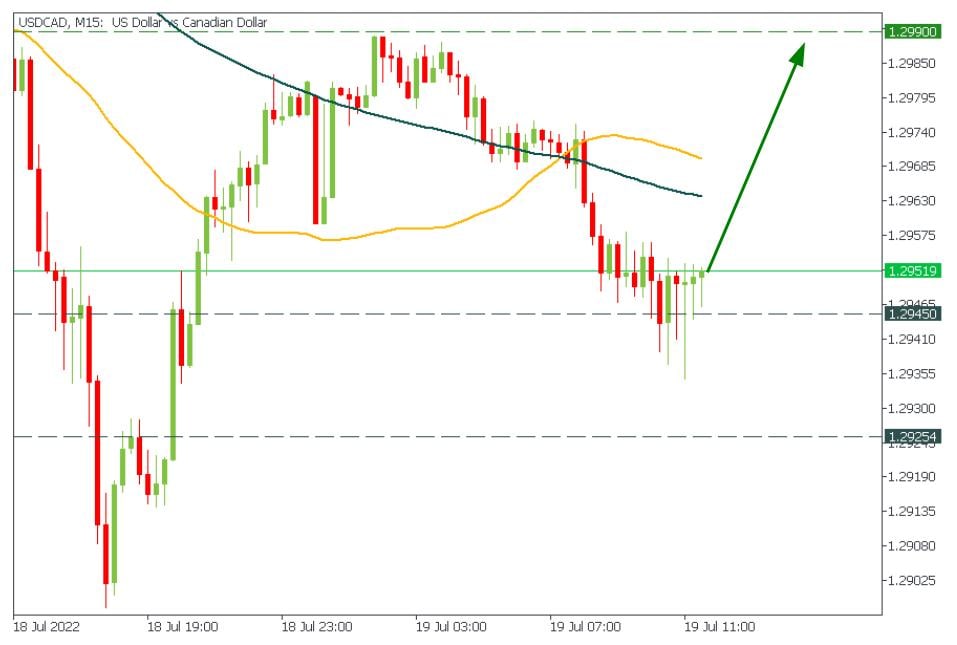
🔥USDCAD makes a good consolidation above the support level!
The price might reach 1.2990 shortly!
🟩 START TRADING 🟩
🔥USDCAD makes a good consolidation above the support level!
The price might reach 1.2990 shortly!
🟩 START TRADING 🟩
🔥34👍28👎16👏1
#Education
ABC of Fibonacci🎓
Hello, dear traders! Today we’ll talk about one of the most popular instruments in trading, Fibonacci Tools! Let's study the logic of them.
▪️In the 13th century, the mathematician Leonardo Fibonacci explored a series of numbers (0, 1, 1, 2, 3, 5, 8, 13, 21, 34, 55, 89, 144, etc.). Each number in this sequence is the sum of the previous two. It turned out that the ratios of these numbers correspond to the natural proportions of things in the universe. For example, tree branches form or diverge according to Fibonacci numbers, seed pods on a pine cone follow a Fibonacci spiral, and so on.
▪️Financial markets are no exception: various market movements are also often consistent with Fibonacci ratios. The Fibonacci sequence has some constant relationships. The most important Fibonacci ratios are:
- 161.8%, "golden section".
- 61.8%.
- 38.2%.
▪️Forex traders constantly use Fibonacci tools to see when the trend finishes its correction. There are several Fibonacci tools in your trading terminal: retracement, extension, fan, arcs and time zones. All of these tools are based on Fibonacci ratios.
Read more about them here: https://bit.ly/3v06kwJ
ABC of Fibonacci🎓
Hello, dear traders! Today we’ll talk about one of the most popular instruments in trading, Fibonacci Tools! Let's study the logic of them.
▪️In the 13th century, the mathematician Leonardo Fibonacci explored a series of numbers (0, 1, 1, 2, 3, 5, 8, 13, 21, 34, 55, 89, 144, etc.). Each number in this sequence is the sum of the previous two. It turned out that the ratios of these numbers correspond to the natural proportions of things in the universe. For example, tree branches form or diverge according to Fibonacci numbers, seed pods on a pine cone follow a Fibonacci spiral, and so on.
▪️Financial markets are no exception: various market movements are also often consistent with Fibonacci ratios. The Fibonacci sequence has some constant relationships. The most important Fibonacci ratios are:
- 161.8%, "golden section".
- 61.8%.
- 38.2%.
▪️Forex traders constantly use Fibonacci tools to see when the trend finishes its correction. There are several Fibonacci tools in your trading terminal: retracement, extension, fan, arcs and time zones. All of these tools are based on Fibonacci ratios.
Read more about them here: https://bit.ly/3v06kwJ

👍43❤4🔥1
🇺🇸🇯🇵#USDJPY
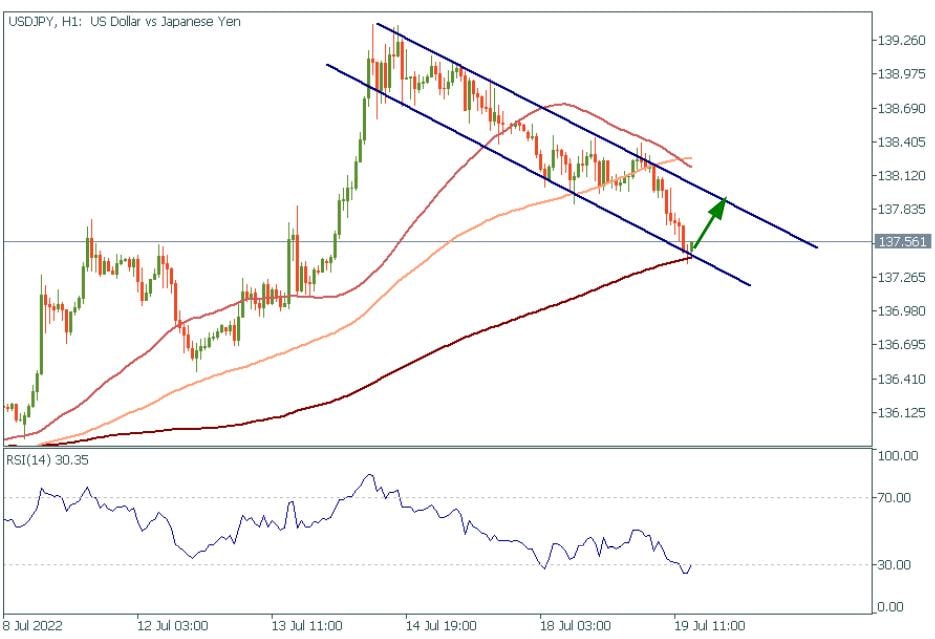
🔥USDJPY is bouncing from the cross point of the 200-hour MA and the bottom border of the descending channel!
It is another chance to enter a BUY trade with the target at the upper channel's border!
🟩 START TRADING 🟩
🔥USDJPY is bouncing from the cross point of the 200-hour MA and the bottom border of the descending channel!
It is another chance to enter a BUY trade with the target at the upper channel's border!
🟩 START TRADING 🟩
🔥19👍12
🇬🇧🇺🇸#GBPUSD
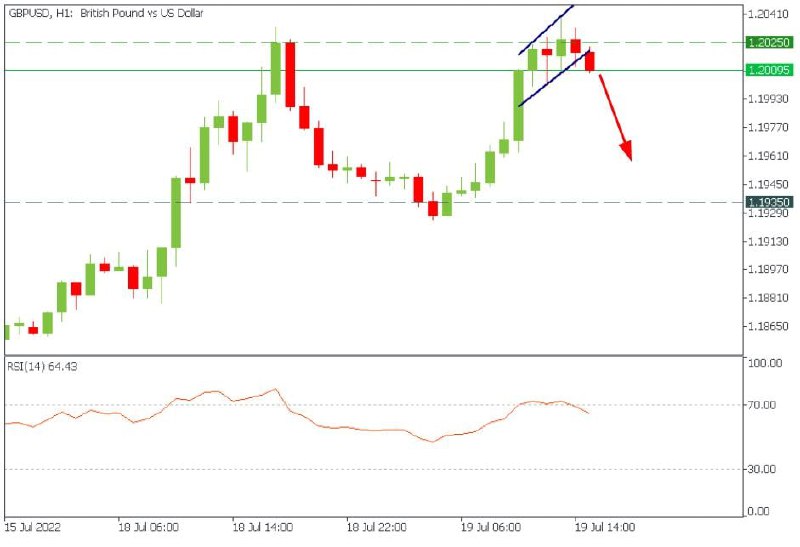
🔥GBPUSD breaks out of the bearish reversed wedge!
Buyers couldn't close the candles above the resistance level of 1.2025. It looks like the pair might plunge to 1.1935!
P.S. At least half of the position need to be fixed around 1.1970!
P.S. Do not forget to use a traveling stop-loss!
🟩 START TRADING 🟩
🔥GBPUSD breaks out of the bearish reversed wedge!
Buyers couldn't close the candles above the resistance level of 1.2025. It looks like the pair might plunge to 1.1935!
P.S. At least half of the position need to be fixed around 1.1970!
P.S. Do not forget to use a traveling stop-loss!
🟩 START TRADING 🟩
👍28🔥5👏5🥰3
🇺🇸 #USDJPY 🇯🇵
Despite USDJPY is bullish on smaller timeframe, the bigger picture is different
🔻 Multiple RSI divergences and two Fibonacci retracements sign about soon reversal to the support of 134.40
📉 We can't say for sure whether the pair stops at the support or continue falling, but the next stop would be the 131.40 support line
⚠️ Scenario will be inactive if USDJPY goes above 140.10
🔻START TRADING 🔻
Despite USDJPY is bullish on smaller timeframe, the bigger picture is different
🔻 Multiple RSI divergences and two Fibonacci retracements sign about soon reversal to the support of 134.40
📉 We can't say for sure whether the pair stops at the support or continue falling, but the next stop would be the 131.40 support line
⚠️ Scenario will be inactive if USDJPY goes above 140.10
🔻START TRADING 🔻

👍48🔥9🙏6
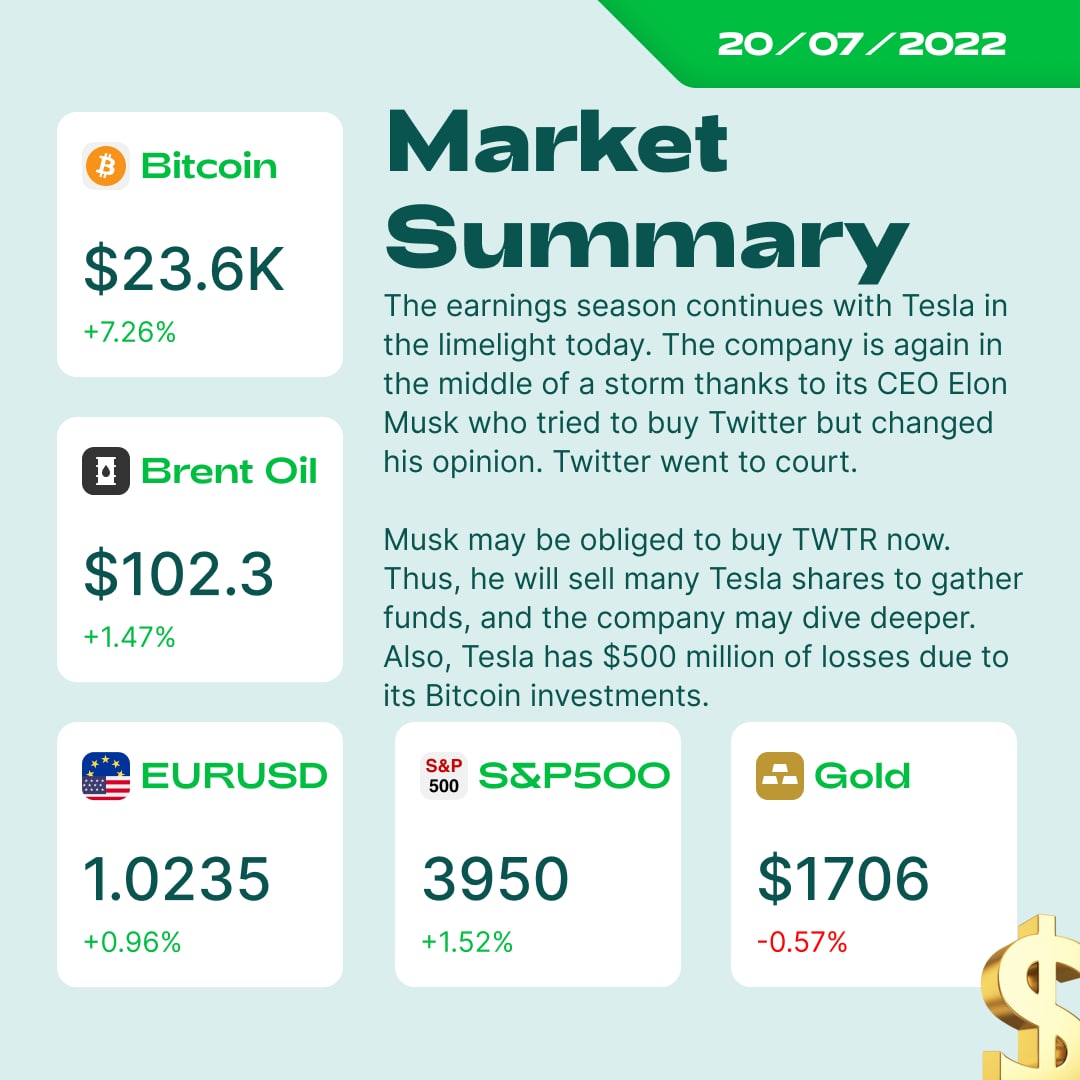
#Marketnews
👀 Don’t look at the charts for too long. Otherwise, the charts will start looking back at you. Always read our morning news post to look at the chart only when you need to
🙁 One of the most famous investors, Cathie Wood, is closing down one of her ETFs “ARK Transparency ETF” due to the lack of interest from the market
📊 As we said in the weekly outlook, inflation data in Britain turned out to be higher than expected (9.4% actual vs. 9.3% forecast). GBP slides lower EURGBP jumped by 115 points over the last 15 minutes. Still, we expect the GBP to rise
🇬🇧 Bank of England governor Bailey said the bank would consider a 50bp rate hike in August. Also, Monetary Policy Committee (MPC) could vote to start asset sales in September
🇨🇳China reported 1012 new Covid-19 cases on July 19 for the first time since May 20. Rather negative news for oil hasn’t taken any impact yet (but the lockdowns may become harsher soon)
🌏 RBA governor Lowe said inflation is expected to reach 6 or 7%, and steady rate hikes are now a good idea to control prices
💸 Bitcoin is above the 50-daily MA for the first time since April 2022. Bears are in shock as the main crypto may reach $25.2K if it holds above the moving average
🥇 Gold is trying to break through the support of 1700. Even if the breakout happens a little bit later, it’s probably inevitable (sell trades are more preferable)
🥸 What news did you like the most?
👀 Don’t look at the charts for too long. Otherwise, the charts will start looking back at you. Always read our morning news post to look at the chart only when you need to
🙁 One of the most famous investors, Cathie Wood, is closing down one of her ETFs “ARK Transparency ETF” due to the lack of interest from the market
📊 As we said in the weekly outlook, inflation data in Britain turned out to be higher than expected (9.4% actual vs. 9.3% forecast). GBP slides lower EURGBP jumped by 115 points over the last 15 minutes. Still, we expect the GBP to rise
🇬🇧 Bank of England governor Bailey said the bank would consider a 50bp rate hike in August. Also, Monetary Policy Committee (MPC) could vote to start asset sales in September
🇨🇳China reported 1012 new Covid-19 cases on July 19 for the first time since May 20. Rather negative news for oil hasn’t taken any impact yet (but the lockdowns may become harsher soon)
🌏 RBA governor Lowe said inflation is expected to reach 6 or 7%, and steady rate hikes are now a good idea to control prices
💸 Bitcoin is above the 50-daily MA for the first time since April 2022. Bears are in shock as the main crypto may reach $25.2K if it holds above the moving average
🥇 Gold is trying to break through the support of 1700. Even if the breakout happens a little bit later, it’s probably inevitable (sell trades are more preferable)
🥸 What news did you like the most?
👍44🔥5
FBS Analytics
🇬🇧🇺🇸#GBPUSD 🔥GBPUSD breaks out of the bearish reversed wedge! Buyers couldn't close the candles above the resistance level of 1.2025. It looks like the pair might plunge to 1.1935! P.S. At least half of the position need to be fixed around 1.1970! P.S.…
Watch out the support of 1.1990. If the 30M closes below, open a SELL trade with the target at 1.1935!
🔥43😍9👍8🥰6
🥇🥈#GOLD #SILVER
🔥Metals will stay under pressure!
XAGUSD broke through and retested the inverted rising wedge!
🎯Target: $18.19!
XAUUSD is trying to break through $1705 support. Consider selling gold after the breakout with a stop-loss above this level.
🎯Target: $1690
🟩 START TRADING 🟩
🔥Metals will stay under pressure!
XAGUSD broke through and retested the inverted rising wedge!
🎯Target: $18.19!
XAUUSD is trying to break through $1705 support. Consider selling gold after the breakout with a stop-loss above this level.
🎯Target: $1690
🟩 START TRADING 🟩
👍54🔥13🥰3❤1👎1👏1
🔥Canada CPI🔥 - Inflation change m/m
Estimated: 0.9%
Actual: 0.7%
Previous: 1.4%
🔥Canada IPPI🔥- Industrial Product Price Index m/m
Estimated: -0.6%
Actual: -1.1%
Previous: 1.7%
Estimated: 0.9%
Actual: 0.7%
Previous: 1.4%
🔥Canada IPPI🔥- Industrial Product Price Index m/m
Estimated: -0.6%
Actual: -1.1%
Previous: 1.7%
👍28❤6🔥3👏1
🔥Tomorrow, the ECB will hike interest rate for the first time in 11 years
⚠️ It will affect EURUSD, Gold, and million people's lives. We prepared a video for you with explanations of how interest rates changes gold and USD prices
Please, hit a ❤️ reaction if you are interested. Once we have 300 reactions, we will post the video ☺️
⚠️ It will affect EURUSD, Gold, and million people's lives. We prepared a video for you with explanations of how interest rates changes gold and USD prices
Please, hit a ❤️ reaction if you are interested. Once we have 300 reactions, we will post the video ☺️
❤480👍33🔥19👏13🙏9
🛢#Brent
⚡️Oil market gets ready for the swing!
XBRUSD has formed a "head-and-shoulders" pattern on the H1 timeframe right under the resistance trend line! If the price breaks the neckline, it will decline to $99.00.
On the other hand, if XBRUSD breaks through the descending trendline, it will start the way towards $106.00 and $112.00 resistance levels.
🟩 START TRADING 🟩
⚡️Oil market gets ready for the swing!
XBRUSD has formed a "head-and-shoulders" pattern on the H1 timeframe right under the resistance trend line! If the price breaks the neckline, it will decline to $99.00.
On the other hand, if XBRUSD breaks through the descending trendline, it will start the way towards $106.00 and $112.00 resistance levels.
🟩 START TRADING 🟩
👍36🔥8❤4
FBS Analytics pinned «🇺🇸🔥⚡️#TSLA #Bitcoin $Crypto TESLA sold about 75% Bitcoin from the balance!»
Should we go LIVE on the ECB statement release? 🤨
Anonymous Poll
87%
Yes
4%
No
9%
Who cares about ECB?
👍36🔥5👏3🤬1
⚡️Elder-Ray Index!
⬆️⬇️Elder-Ray Index attempts to gauge bullish and bearish forces in the market by using two separate measures, one for each type of directional pressure.
🐻🦬The Bear Power indicator measures the market's appetite for lower prices, while the Bull Power indicator measures the market's appetite for higher prices. Both do this by making a comparison to a third measure. Typically, it is a 13-period exponential moving average (EMA).
👆If bulls dominate, prices rise, and the slope of a moving average will be upward. If bears gain dominance, prices fall, and the slope of a moving average will be downward.
The Elder-Ray technique combines elements of both trend-following indicators and oscillators. Using all three together should, in theory, enable you to decide whether bulls or bears are stronger and then join the winning side.
Let's figure out how does this indicator work?
Signals for a Buy trade:
✅The market is in an uptrend, as indicated by the slope of the EMA
✅Bears Power is below zero but has been moving higher
✅The most recent peak in Bulls Power is greater than the peak prior
✅There is a bullish divergence between Bears Power and the price
Signals for a Sell trade:
✅Only open a short position when the EMA signifies a downtrend
✅Bulls Power is above zero but has been moving lower
✅The most recent low in Bears Power is lower than the prior bottom
✅There is a bearish divergence between Bulls Power and the price
A trend is a trader's friend!
⬆️⬇️Elder-Ray Index attempts to gauge bullish and bearish forces in the market by using two separate measures, one for each type of directional pressure.
🐻🦬The Bear Power indicator measures the market's appetite for lower prices, while the Bull Power indicator measures the market's appetite for higher prices. Both do this by making a comparison to a third measure. Typically, it is a 13-period exponential moving average (EMA).
👆If bulls dominate, prices rise, and the slope of a moving average will be upward. If bears gain dominance, prices fall, and the slope of a moving average will be downward.
The Elder-Ray technique combines elements of both trend-following indicators and oscillators. Using all three together should, in theory, enable you to decide whether bulls or bears are stronger and then join the winning side.
Let's figure out how does this indicator work?
Signals for a Buy trade:
✅The market is in an uptrend, as indicated by the slope of the EMA
✅Bears Power is below zero but has been moving higher
✅The most recent peak in Bulls Power is greater than the peak prior
✅There is a bullish divergence between Bears Power and the price
Signals for a Sell trade:
✅Only open a short position when the EMA signifies a downtrend
✅Bulls Power is above zero but has been moving lower
✅The most recent low in Bears Power is lower than the prior bottom
✅There is a bearish divergence between Bulls Power and the price
A trend is a trader's friend!

👍29❤2🔥2
#MarketNews
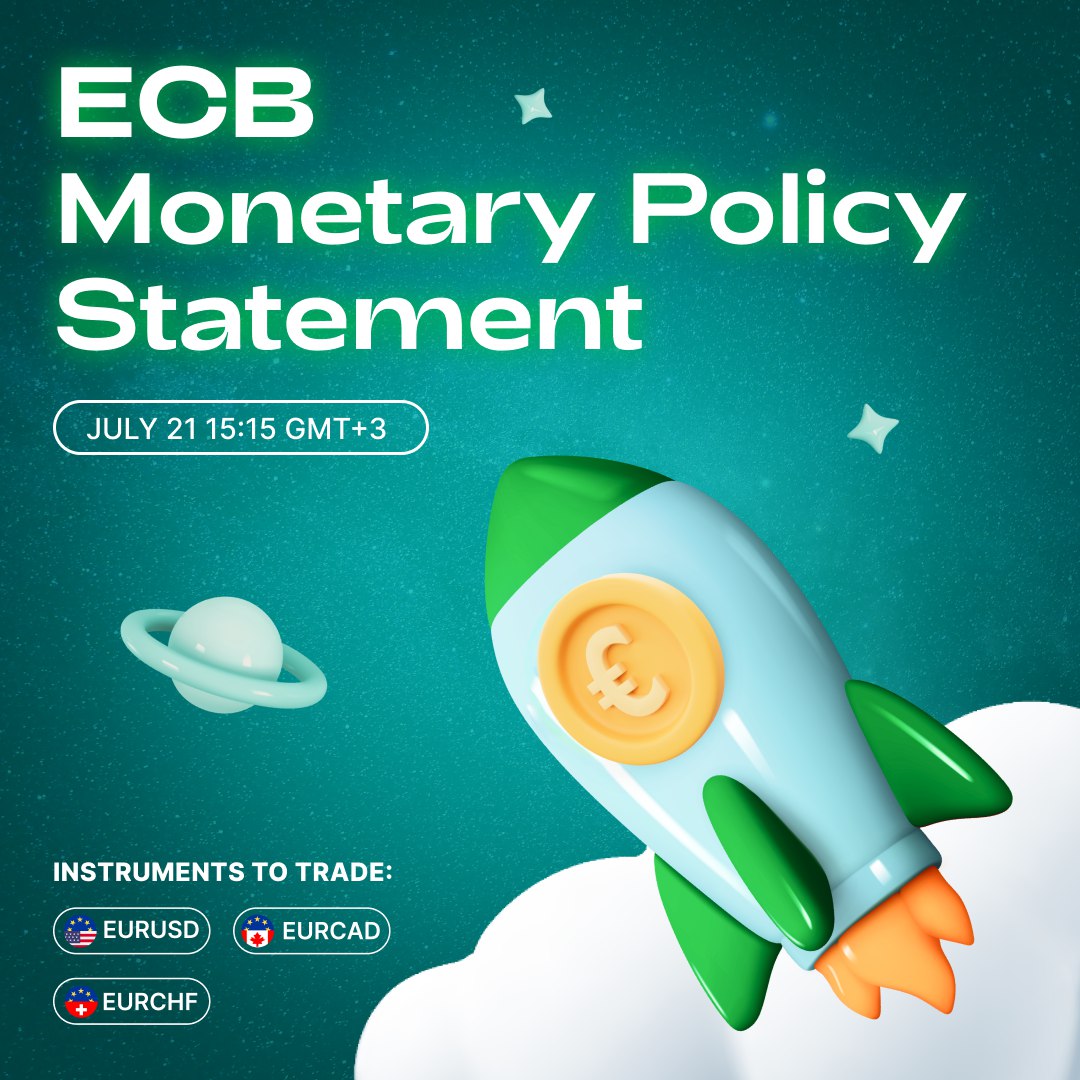
🔔EURUSD is back above 1.0200 ahead of a European Central Bank meeting where it is expected to hike for the first time in more than a decade, almost certainly raising rates by 25 basis points. The rate announcement is at 15:15 MT time, while the central bank’s press conference starts at 15:45 MT time.
💹The Bank of Japan maintained its policy rate and lowered its economic growth forecast for this year. USDJPY is stable at around 138.00.
🔥Russia resumed sending gas to Europe through the key Nord Stream pipeline, alleviating some investor concerns. XNGUSD is down from yesterday’s high at 7.917. US500 is at the highest level since June 10 as market sentiment improved a bit.
😬Still, not all are optimistic. Tech companies are getting ready for recession. Microsoft said Wednesday it was eliminating many job openings. Google is pausing hiring for the next two weeks.
🙈Tesla Inc. disclosed that it sold about 75% of its holdings of cryptocurrency during the second quarter. BTCUSD slipped below 23 000 after testing 24250 earlier this week.
🇺🇲🇨🇳US President Joe Biden said he expects to speak to Chinese leader Xi Jinping “within the next 10 days” as Washington considers lifting some tariffs on Chinese imports.
🛢WTI oil (XTIUSD) was back below $100 a barrel as growing stockpiles of crude and gasoline tempered fears of a tight market.
It's Thursday and we are sure that there will be big market moves. What will you trade? Tell us in the comments!
🔔EURUSD is back above 1.0200 ahead of a European Central Bank meeting where it is expected to hike for the first time in more than a decade, almost certainly raising rates by 25 basis points. The rate announcement is at 15:15 MT time, while the central bank’s press conference starts at 15:45 MT time.
💹The Bank of Japan maintained its policy rate and lowered its economic growth forecast for this year. USDJPY is stable at around 138.00.
🔥Russia resumed sending gas to Europe through the key Nord Stream pipeline, alleviating some investor concerns. XNGUSD is down from yesterday’s high at 7.917. US500 is at the highest level since June 10 as market sentiment improved a bit.
😬Still, not all are optimistic. Tech companies are getting ready for recession. Microsoft said Wednesday it was eliminating many job openings. Google is pausing hiring for the next two weeks.
🙈Tesla Inc. disclosed that it sold about 75% of its holdings of cryptocurrency during the second quarter. BTCUSD slipped below 23 000 after testing 24250 earlier this week.
🇺🇲🇨🇳US President Joe Biden said he expects to speak to Chinese leader Xi Jinping “within the next 10 days” as Washington considers lifting some tariffs on Chinese imports.
🛢WTI oil (XTIUSD) was back below $100 a barrel as growing stockpiles of crude and gasoline tempered fears of a tight market.
It's Thursday and we are sure that there will be big market moves. What will you trade? Tell us in the comments!
👍46🔥6❤4🥰2😁1
#MacroAnalysis #EURUSD
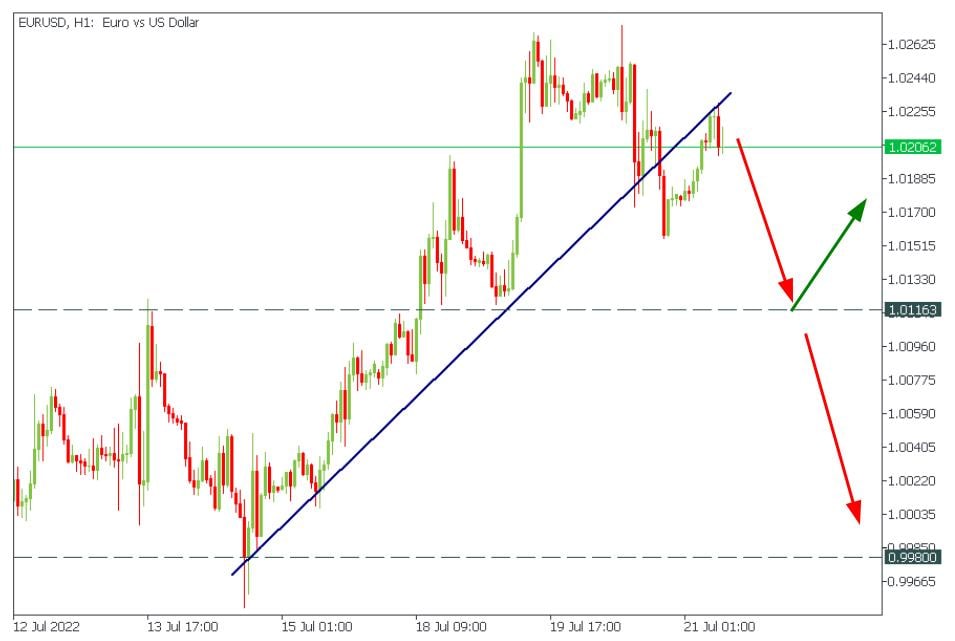
❗️The ECB meeting in crisis - the euro might continue to decline
👆On Thursday, the ECB will raise interest rates for the first time in 10 years as the weakening euro requires a tough policy of the regulator.
🙅Eurozone problems
The EU is on the brink of recession due to the energy crisis. The German Uniper is already using gas from storage facilities. If it is not enough, countries might ration gas consumption. In this case, companies will reduce activity and produce less. As a result, prices for domestic goods will rise while exports decline. In this case, the euro will decrease, pushing inflation even higher.
The political environment in the EU makes it more complex. Due to instability, investors sell bonds due to instability and yields rise, destabilizing the Union's debt market. Especially in Italy, the country with the "weakest" economy.
🏦What about ECB?
The ECB will tighten its policy, but the debt burden of countries with the biggest loans will increase. Therefore, raising rates quickly is dangerous. Otherwise, a debt crisis threatens. That's why the EUR might weaken as the Fed acts much tighter and capital flows to the US.
❗️The ECB meeting in crisis - the euro might continue to decline
👆On Thursday, the ECB will raise interest rates for the first time in 10 years as the weakening euro requires a tough policy of the regulator.
🙅Eurozone problems
The EU is on the brink of recession due to the energy crisis. The German Uniper is already using gas from storage facilities. If it is not enough, countries might ration gas consumption. In this case, companies will reduce activity and produce less. As a result, prices for domestic goods will rise while exports decline. In this case, the euro will decrease, pushing inflation even higher.
The political environment in the EU makes it more complex. Due to instability, investors sell bonds due to instability and yields rise, destabilizing the Union's debt market. Especially in Italy, the country with the "weakest" economy.
🏦What about ECB?
The ECB will tighten its policy, but the debt burden of countries with the biggest loans will increase. Therefore, raising rates quickly is dangerous. Otherwise, a debt crisis threatens. That's why the EUR might weaken as the Fed acts much tighter and capital flows to the US.
🔥20👍15❤5👎3
FBS Analytics
🇺🇸🇯🇵#USDJPY USDJPY bounces off the 100-hour moving average. Moreover, the price is moving inside the bullish flag, which might signal for an uptrend continuation! ❗️You can open a BUY trade now or wait for the breakout of the higher flag's border❗️ 🟩…
✅Perfect retest of the 261.8 Fibonacci level.
The rocket is fueled! Don't miss the flight!
🎯Target: 144.00
🟩 START TRADING 🟩
The rocket is fueled! Don't miss the flight!
🎯Target: 144.00
🟩 START TRADING 🟩
🔥39👍24🤩4❤3