
FBS Analytics
🇺🇸🇨🇦#USDCAD 🔥USDCAD reached the resistance area! The price is trading under the ascending trendline right inside the resistance range between 1.3075 and 1.3100. ❗️Bears might get active right now! Consider looking for any reversal signals ❗️ 🟩 START…
Not active. Bulls destroyed the resistance level. There were no signs of a potential reversal.
👍23🤬6👏3🔥1
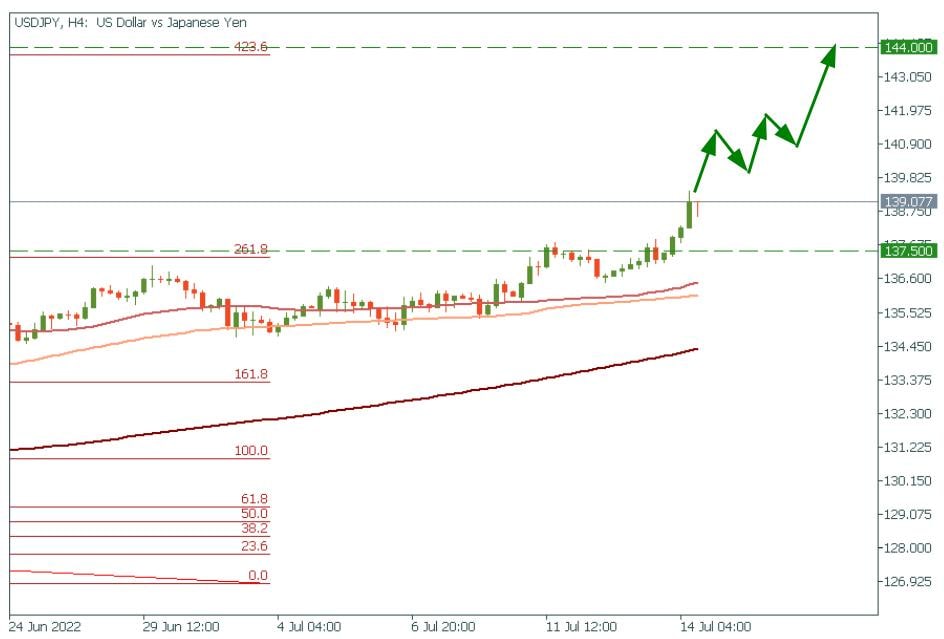
🇺🇸🇯🇵#USDJPY
🔥The price is trending strongly!
Just follow the trend. Target is 144.00.
🟩 START TRADING 🟩
🔥The price is trending strongly!
Just follow the trend. Target is 144.00.
🟩 START TRADING 🟩
🔥27👍17❤3🥰3🎉3
🛢#XBRUSD
🔥Brent bounces off the 200-day moving average!
The price declined to the $96.00, which is the cross point of the significant horizontal support level and the 200-day moving average! Since the price is moving in the rising channel we expect XBRUSD to head towards $102.00 resistance level first.
If the price breaks out of this channel, it might go towards $106.00.
🟩 START TRADING 🟩
🔥Brent bounces off the 200-day moving average!
The price declined to the $96.00, which is the cross point of the significant horizontal support level and the 200-day moving average! Since the price is moving in the rising channel we expect XBRUSD to head towards $102.00 resistance level first.
If the price breaks out of this channel, it might go towards $106.00.
🟩 START TRADING 🟩

👍19🔥5
🔥One more time..
USDCHF - target 1.003.
EURUSD - target 0.99.
USDJPY - target 144.00.
GOLD - target $1690.
All ideas we've been talking about during last several days work perfectly! Enjoy trading! Good luck 😉
USDCHF - target 1.003.
EURUSD - target 0.99.
USDJPY - target 144.00.
GOLD - target $1690.
All ideas we've been talking about during last several days work perfectly! Enjoy trading! Good luck 😉
👍39🔥11❤6
1️⃣ Do you want to become a successful investor or catch a short-term movement and earn some money?
2️⃣ In both cases, you need to think strategically, and be patient
3️⃣One of the biggest banks in the world gonna report tomorrow. Read this article of you want to profit from the event
Let's go!
🔽
https://bit.ly/3yEhZ5A
🔼
2️⃣ In both cases, you need to think strategically, and be patient
3️⃣One of the biggest banks in the world gonna report tomorrow. Read this article of you want to profit from the event
Let's go!
🔽
https://bit.ly/3yEhZ5A
🔼

🔥25👍11🐳8👏4
#MarketNews
🎉Happy Friday our dear traders! Hope your week was great! Here is the last portion of news for this week!
🇺🇸Traders consider how hawkish the Fed needs to be to curb inflation and potential losses to the economy. Bets on a one percentage point July rate hike were cut after the latest comment pointed to 75 basis points.
🇮🇹The Italian prime minister's decision to resign Thursday plunged the eurozone's third-largest economy into a paralyzing political crisis that could end in early elections as the country grapples with an energy crisis, rising borrowing costs and an escalating conflict in Ukraine. Such events led to the fall of the euro by 1%.
🇨🇳China refrained from injecting funds into the banking system, keeping the cost of borrowing unchanged against the backdrop of sufficient cash levels in the banking system. The People's Bank of China has rolled over 100 billion yuan ($14.8 billion) loans.
📺Netflix chose Microsoft to help roll out its new ad-supported offering, but one analyst says the deal could be hiding a "hidden agenda," casting doubt on the timing of that agreement.
🇯🇵USDJPY climbed a new yearly high of 139.39, continuing its rise after a larger-than-expected rise in the US CPI, with the exchange rate on track to test the September 1998 high of 139.91. Now USDJPY is 138.6.
❗️Don’t miss: 15:30 GMP+3 US Retail Sales. Trade the USD pairs!
Have a great day today!✨
🎉Happy Friday our dear traders! Hope your week was great! Here is the last portion of news for this week!
🇺🇸Traders consider how hawkish the Fed needs to be to curb inflation and potential losses to the economy. Bets on a one percentage point July rate hike were cut after the latest comment pointed to 75 basis points.
🇮🇹The Italian prime minister's decision to resign Thursday plunged the eurozone's third-largest economy into a paralyzing political crisis that could end in early elections as the country grapples with an energy crisis, rising borrowing costs and an escalating conflict in Ukraine. Such events led to the fall of the euro by 1%.
🇨🇳China refrained from injecting funds into the banking system, keeping the cost of borrowing unchanged against the backdrop of sufficient cash levels in the banking system. The People's Bank of China has rolled over 100 billion yuan ($14.8 billion) loans.
📺Netflix chose Microsoft to help roll out its new ad-supported offering, but one analyst says the deal could be hiding a "hidden agenda," casting doubt on the timing of that agreement.
🇯🇵USDJPY climbed a new yearly high of 139.39, continuing its rise after a larger-than-expected rise in the US CPI, with the exchange rate on track to test the September 1998 high of 139.91. Now USDJPY is 138.6.
❗️Don’t miss: 15:30 GMP+3 US Retail Sales. Trade the USD pairs!
Have a great day today!✨

👍35🔥10❤4😁1
💪May the Force be with you!
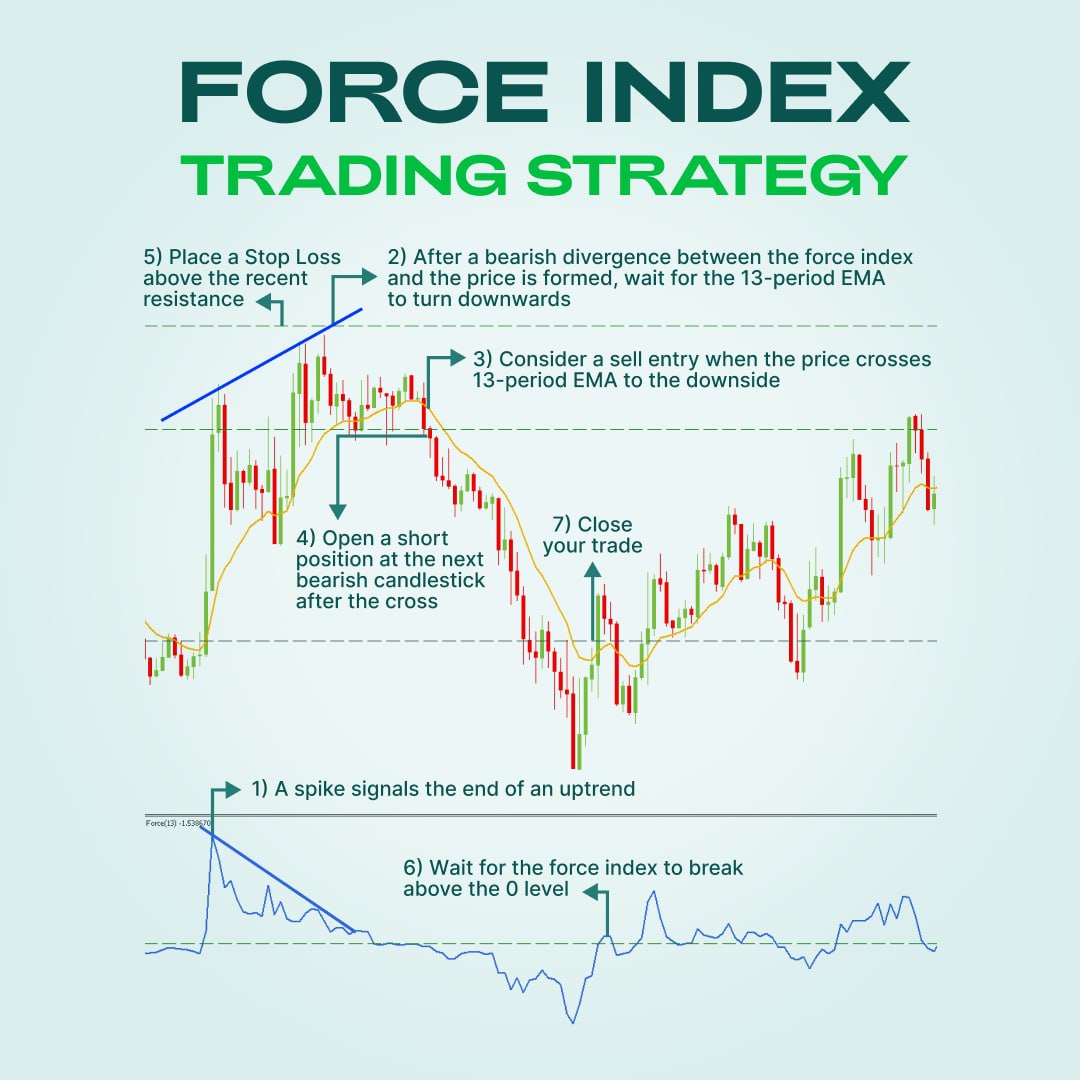
We’re continuing our series of posts about indicators. Let’s talk about the Force indicator!
🐻🦬Force Index (FI) measures the force of bears and bulls in a trending market. This indicator is based on price, direction and trade volumes, which are the three essential elements of the price’s movement. The FI can confirm a trend, identify corrections that are worth trading and even foresee the reversals.
If the current closing price is higher than the previous one, the index will be positive. When the indicator rises, it shows bulls’ force. Vice versa, if the closing price is lower than the previous one, the indicator will be negative showing the bears’ force. As a result, it’s worth watching the moments when the FI crosses the zero line.
If a trend is strong, the force index will change sharply. More likely, it will signal the continuation of a trend. At the same time, if prices change by inertia, the FI will change only slightly. If the current price increases but the indicator is not, it means that the uptrend weakens.
What is the best strategy for FI?
✅First, notice the spike, it signals the end of uptrend.
✅Then, after the bearish divergence between FI index and the price is formed, wait for the 13-period EMA to turn downwards.
✅When the price crosses 13-period EMA to the downside, consider a sell entry.
✅Open a short position at the next bearish candlestick after the cross.
✅Don’t forget to set the Stop Loss at the recent resistance.
✅Hold your order open until the Force index breaks above the 0 level.
✅Finally, at this moment, close the trade.
To learn more about Force index, click here ⬅️
👍Try the Force index and trade with FBS!
We’re continuing our series of posts about indicators. Let’s talk about the Force indicator!
🐻🦬Force Index (FI) measures the force of bears and bulls in a trending market. This indicator is based on price, direction and trade volumes, which are the three essential elements of the price’s movement. The FI can confirm a trend, identify corrections that are worth trading and even foresee the reversals.
If the current closing price is higher than the previous one, the index will be positive. When the indicator rises, it shows bulls’ force. Vice versa, if the closing price is lower than the previous one, the indicator will be negative showing the bears’ force. As a result, it’s worth watching the moments when the FI crosses the zero line.
If a trend is strong, the force index will change sharply. More likely, it will signal the continuation of a trend. At the same time, if prices change by inertia, the FI will change only slightly. If the current price increases but the indicator is not, it means that the uptrend weakens.
What is the best strategy for FI?
✅First, notice the spike, it signals the end of uptrend.
✅Then, after the bearish divergence between FI index and the price is formed, wait for the 13-period EMA to turn downwards.
✅When the price crosses 13-period EMA to the downside, consider a sell entry.
✅Open a short position at the next bearish candlestick after the cross.
✅Don’t forget to set the Stop Loss at the recent resistance.
✅Hold your order open until the Force index breaks above the 0 level.
✅Finally, at this moment, close the trade.
To learn more about Force index, click here ⬅️
👍Try the Force index and trade with FBS!
👍34❤21🔥10🥰2
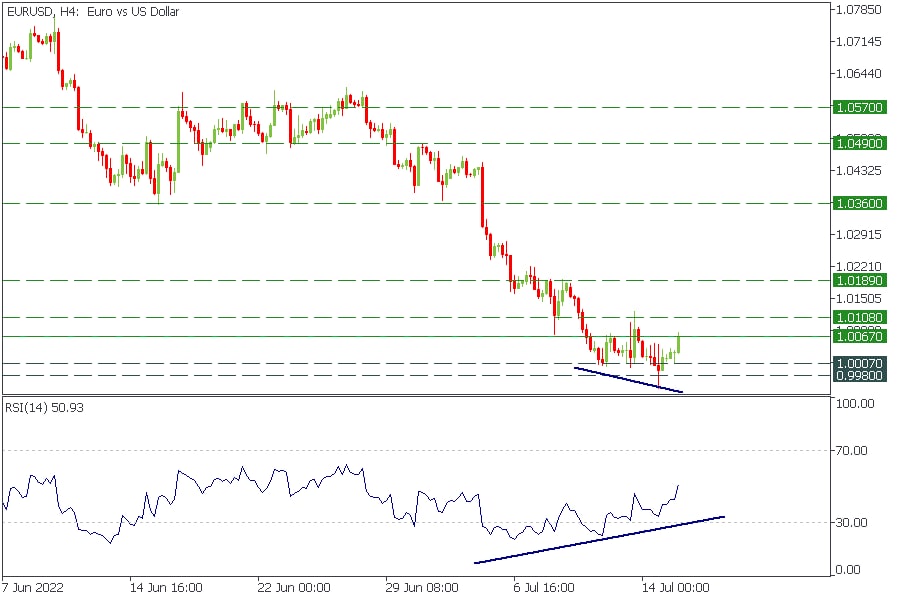
🇺🇸🇪🇺#EURUSD
🔥EUR is surprisingly strengthening!
EURUSD might form a double bottom pattern with bullish divergence. When the H1 candle closes above 1.0108, traders might buy EURUSD with the target at 1.0189!
❗️Trade activates only after a breakout❗️
🟩 START TRADING 🟩
🔥EUR is surprisingly strengthening!
EURUSD might form a double bottom pattern with bullish divergence. When the H1 candle closes above 1.0108, traders might buy EURUSD with the target at 1.0189!
❗️Trade activates only after a breakout❗️
🟩 START TRADING 🟩
👍25🔥12❤6
FBS Analytics
🇺🇸🇪🇺#EURUSD 🔥EUR is surprisingly strengthening! EURUSD might form a double bottom pattern with bullish divergence. When the H1 candle closes above 1.0108, traders might buy EURUSD with the target at 1.0189! ❗️Trade activates only after a breakout❗️ …
Market decided to form falling wedge on EURUSD instead of a "double bottom". Ok, it will also work! 👍
👍49🔥12😁5🥰4❤2
☢️#BTCUSD
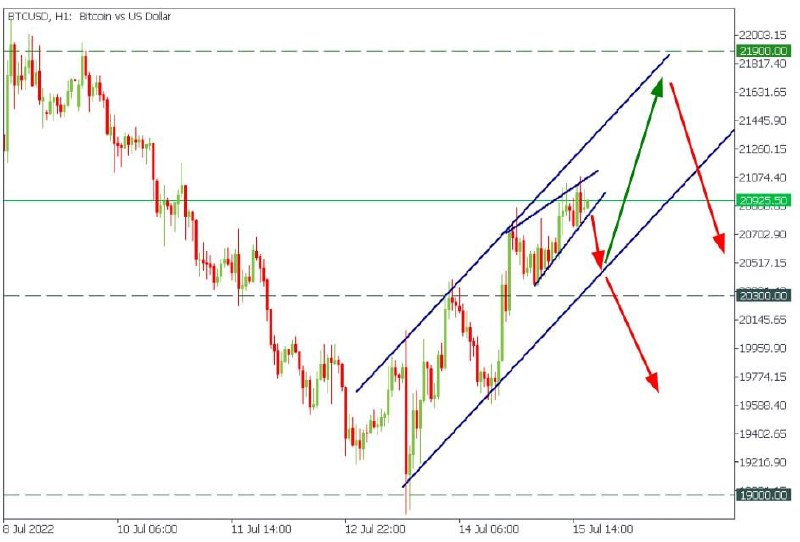
🐻Bearish wedge inside the ascending channel!
🤨Looks not so good for Bitcoin, doesn't it?
🟩 START TRADING 🟩
🐻Bearish wedge inside the ascending channel!
🤨Looks not so good for Bitcoin, doesn't it?
🟩 START TRADING 🟩
👍39🔥14❤7😁1
⬆️⬇️Demand and Supply Dynamics!
💸In trading, people use supply and demand as a resistance and support areas where the price of an asset may slow down or reverse. Supply and demand trading is about placing your orders according to zones where the price tends to reverse due to various factors. Summed up with other trading techniques, supply and demand trading provides a comprehensive and powerful tool that can take your results to a new level.
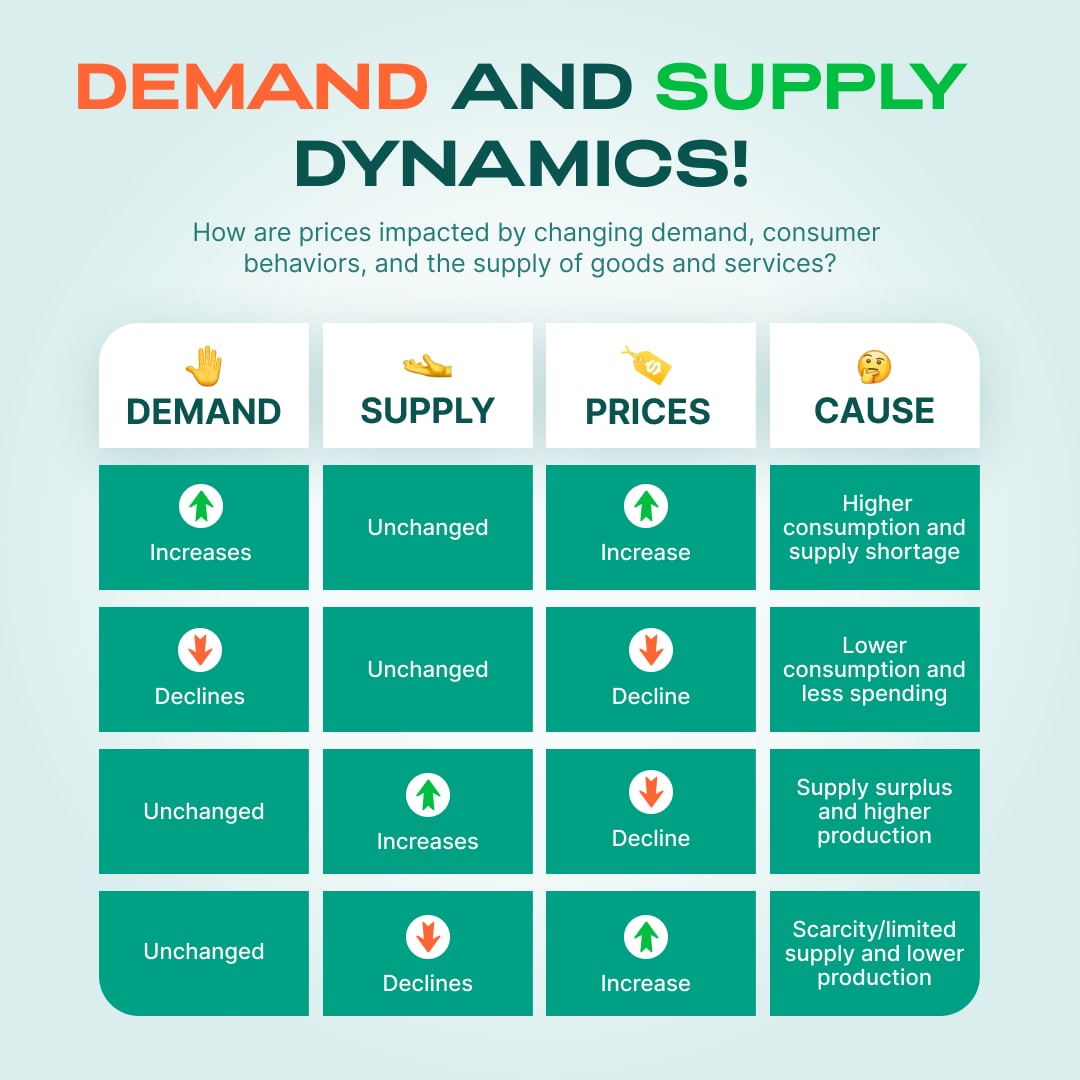
🤔So, how are prices impacted by changing demand, consumer behaviors, and the supply of goods and services?
✅When the demand increases and the supply is unchanged, the prices increase because of the higher consumption and supply shortage.
✅When the demand declines and the supply is unchanged, the prices decline due to the lower consumption and less spending.
✅When the demand is unchanged and the supply increases, the prices decline due to the supply surplus and higher production.
✅When the demand is unchanged and supply declines, prices increase because of scarcity/limited supply and lower production.
👍Use the supply and demand and move your trading skills for the next level!
💸In trading, people use supply and demand as a resistance and support areas where the price of an asset may slow down or reverse. Supply and demand trading is about placing your orders according to zones where the price tends to reverse due to various factors. Summed up with other trading techniques, supply and demand trading provides a comprehensive and powerful tool that can take your results to a new level.
🤔So, how are prices impacted by changing demand, consumer behaviors, and the supply of goods and services?
✅When the demand increases and the supply is unchanged, the prices increase because of the higher consumption and supply shortage.
✅When the demand declines and the supply is unchanged, the prices decline due to the lower consumption and less spending.
✅When the demand is unchanged and the supply increases, the prices decline due to the supply surplus and higher production.
✅When the demand is unchanged and supply declines, prices increase because of scarcity/limited supply and lower production.
👍Use the supply and demand and move your trading skills for the next level!
👍43❤11🔥3🥰2
FBS Analytics
Market decided to form falling wedge on EURUSD instead of a "double bottom". Ok, it will also work! 👍
Buyers attack 1.0108! The breakout of this resistance will open the way to 1.0189! 🔥
👍45🔥10
#MarketNews
✨Good morning! Are you ready for the new trading week? Let’s see what’s happening now:
🇨🇳China is facing a rise in Covid cases again, containment lockdowns and problems in the real estate sector, now linked to a boycott of mortgage payments on some pending projects.
🛢Oil prices rose after US President Joe Biden ended a historic visit to the Middle East without a firm commitment from key producer Saudi Arabia to increase oil supplies. XBRUSD is $100.
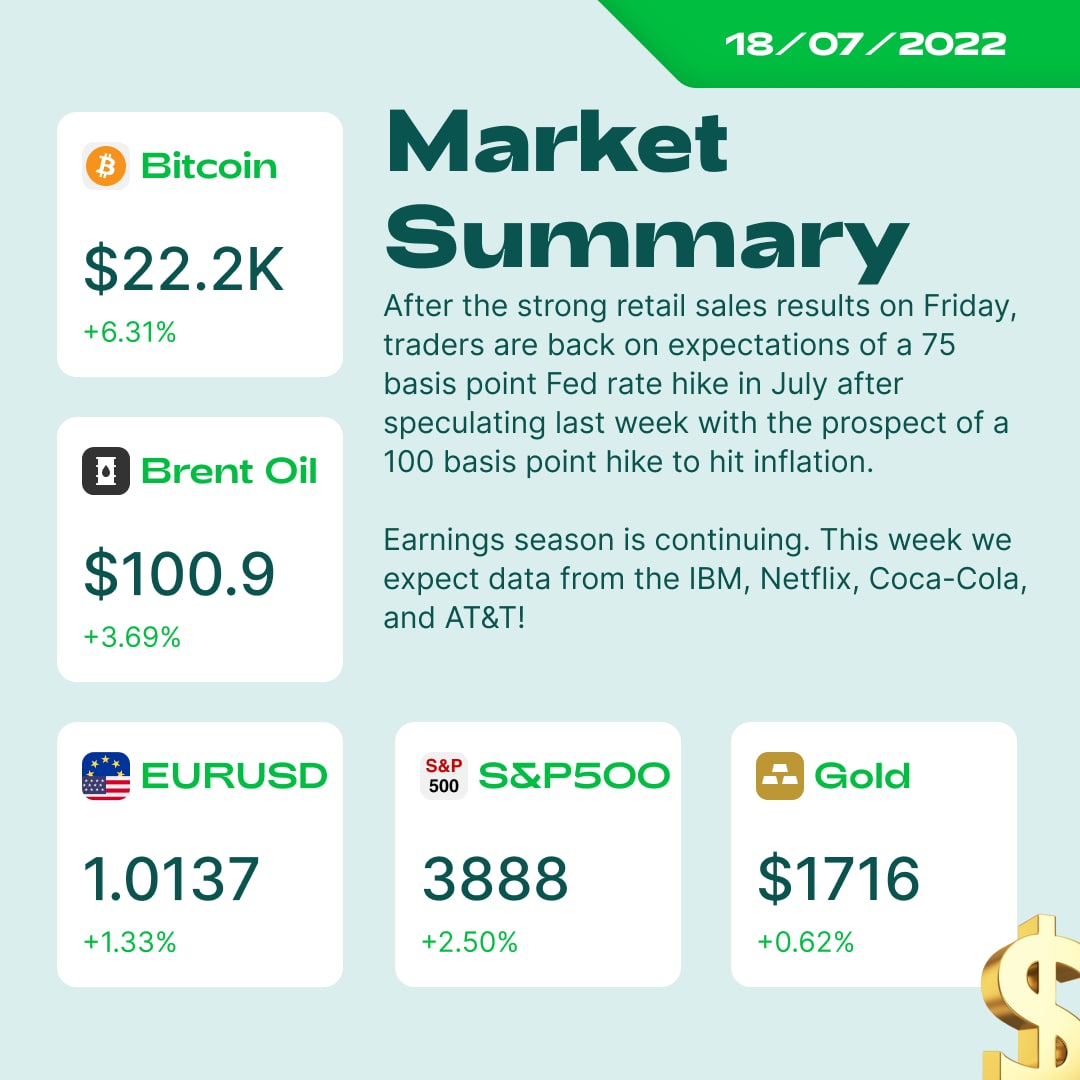
☢️Bitcoin jumped above $21,500 amid a broad rise in cryptocurrencies. BTC is $22210.
🇺🇸Last week's data showing a decline in long-term inflation expectations in the US eased some concerns that higher price pressures are taking hold. Strong retail sales underscored the resilience of the economy despite monetary tightening.
🤔Traders are back on expectations of a 75 basis point Fed rate hike in July after speculating last week with the prospect of a 100 basis point hike to hit inflation. The USD is decreasing.
❗️Earnings season is continuing. This week we expect data from the IBM, Netflix, Coca-Cola, eBay, Tesla, Intel and AT&T! It’s a great chance to trade these stocks!
Have a great trading week! 🎉
✨Good morning! Are you ready for the new trading week? Let’s see what’s happening now:
🇨🇳China is facing a rise in Covid cases again, containment lockdowns and problems in the real estate sector, now linked to a boycott of mortgage payments on some pending projects.
🛢Oil prices rose after US President Joe Biden ended a historic visit to the Middle East without a firm commitment from key producer Saudi Arabia to increase oil supplies. XBRUSD is $100.
☢️Bitcoin jumped above $21,500 amid a broad rise in cryptocurrencies. BTC is $22210.
🇺🇸Last week's data showing a decline in long-term inflation expectations in the US eased some concerns that higher price pressures are taking hold. Strong retail sales underscored the resilience of the economy despite monetary tightening.
🤔Traders are back on expectations of a 75 basis point Fed rate hike in July after speculating last week with the prospect of a 100 basis point hike to hit inflation. The USD is decreasing.
❗️Earnings season is continuing. This week we expect data from the IBM, Netflix, Coca-Cola, eBay, Tesla, Intel and AT&T! It’s a great chance to trade these stocks!
Have a great trading week! 🎉
👍32😁4❤3🔥2🥰2
FBS Analytics
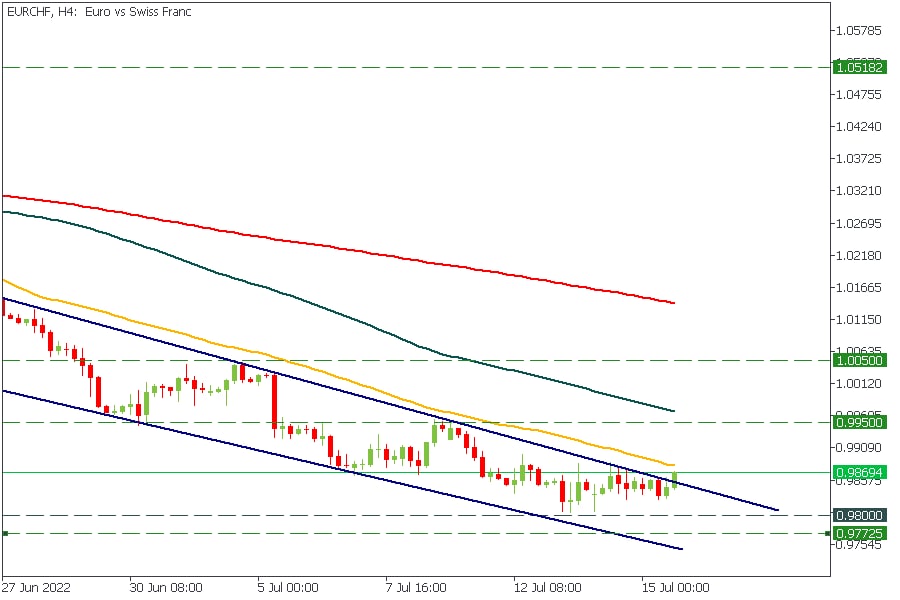
🇪🇺🇨🇭#EURCHF 🔥EURCHF finally breaks out of the rising wedge! 🎯Target: 0.995! 🟩 START TRADING 🟩
Not sure what to trade right now? EURCHF makes a great impulse towards 0.9950! Do not miss it😉
👍18🔥5🥰2
🇺🇸🇯🇵#USDJPY
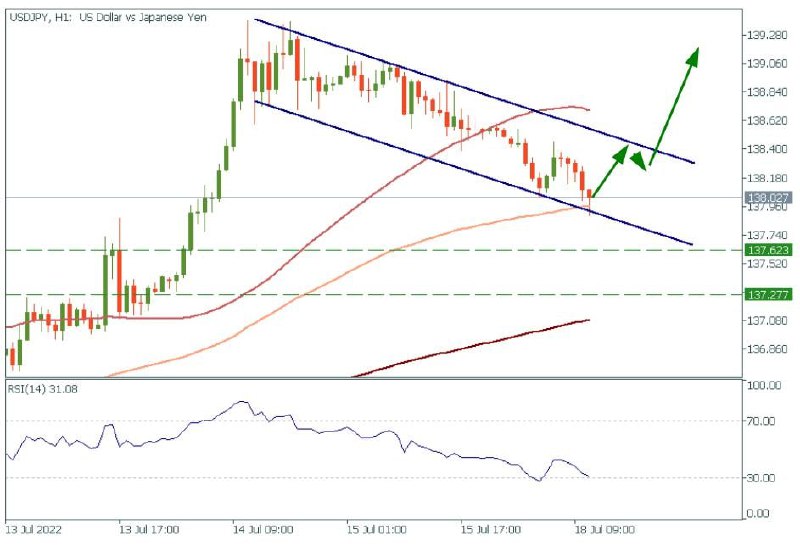
USDJPY bounces off the 100-hour moving average. Moreover, the price is moving inside the bullish flag, which might signal for an uptrend continuation!
❗️You can open a BUY trade now or wait for the breakout of the higher flag's border❗️
🟩 START TRADING 🟩
USDJPY bounces off the 100-hour moving average. Moreover, the price is moving inside the bullish flag, which might signal for an uptrend continuation!
❗️You can open a BUY trade now or wait for the breakout of the higher flag's border❗️
🟩 START TRADING 🟩
👍45🔥15🥰5👏2
🇬🇧🇺🇸#GBPUSD
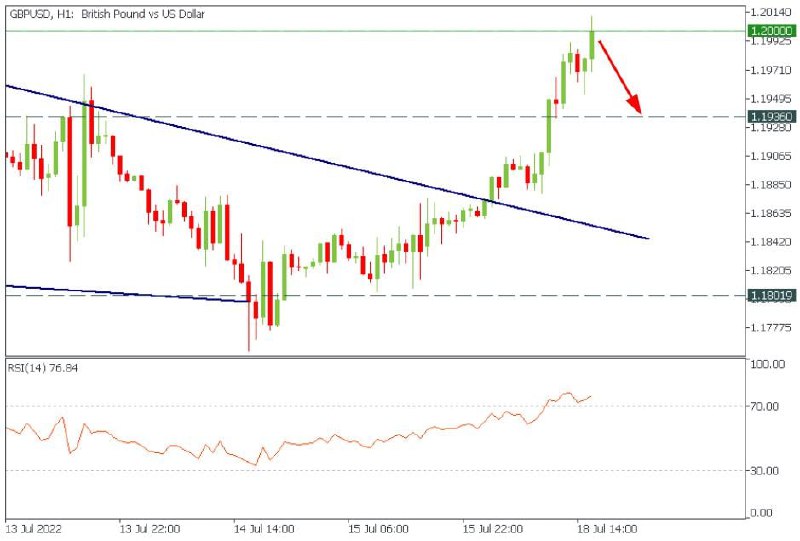
❗️GBPUSD might face a correction.
🔥The pair is currently overbought according to the RSI. Moreover, the price is trading right under the resistance level of 1.2000. We expect a correction at least down to 1.1936!
🟩 START TRADING 🟩
❗️GBPUSD might face a correction.
🔥The pair is currently overbought according to the RSI. Moreover, the price is trading right under the resistance level of 1.2000. We expect a correction at least down to 1.1936!
🟩 START TRADING 🟩
👍28🔥12🤔4👏3
FBS Analytics
Buyers attack 1.0108! The breakout of this resistance will open the way to 1.0189! 🔥
🔥EURUSD hits the target and reverses! Targets for this correction are: 1.0118 and 1.0074!
😏Smash emojis if you followed this move!
😏Smash emojis if you followed this move!
🔥81👍34❤13🥰7💩6
What is the most important asset for this week?
Anonymous Poll
22%
Bitcoin
60%
Gold
31%
Euro
8%
AUD
5%
Tesla
6%
Something else
👍83🔥32💩8👏5👎3
#MarketNews
😱Apple Inc. plans to slow hiring and spending growth next year in some divisions to cope with a potential economic downturn, according to a report by Bloomberg. The stock fell by 2.1% on Monday after opening with a gap up. S&P 500 (US500) also reacted negatively and erased a 1% gain closing 1% down.
💰The US dollar index is mildly weakening but remains near multi-year highs. EURUSD is at 1.0150 after testing 1.0200 yesterday. XAUUSD returned to 1708 after turning down from the resistance at 1720.
🇪🇺In Europe, concerns are intensifying about gas supplies from Russia amid a standoff over its invasion of Ukraine. The European Union is preparing to tell members to cut gas consumption “immediately” to preserve supplies for winter.
🛢Oil held above $100 a barrel after posting the biggest one-day advance since May as fears of a tightening market rattled traders. Saudi Arabia declined to commit to output increases following a visit by US President Joe Biden, and disruption along the Keystone pipeline cut shipments of some Canadian oil to US refiners. XBRUSD is consolidating above 102.00.
🟢Bitcoin tested $23 000, the level at which it last was in the middle of June. Altcoins rallied with Ether adding almost 11% at one point. Solana also achieved a double-digit percentage gain.
Coming next:
💷18:00 GMT+3 - BOE Gov Bailey speaks
💵21:35 - FOMC member Brainard speaks
💸Earnings reports
How about some trading? Who’s gonna trade what today?
😱Apple Inc. plans to slow hiring and spending growth next year in some divisions to cope with a potential economic downturn, according to a report by Bloomberg. The stock fell by 2.1% on Monday after opening with a gap up. S&P 500 (US500) also reacted negatively and erased a 1% gain closing 1% down.
💰The US dollar index is mildly weakening but remains near multi-year highs. EURUSD is at 1.0150 after testing 1.0200 yesterday. XAUUSD returned to 1708 after turning down from the resistance at 1720.
🇪🇺In Europe, concerns are intensifying about gas supplies from Russia amid a standoff over its invasion of Ukraine. The European Union is preparing to tell members to cut gas consumption “immediately” to preserve supplies for winter.
🛢Oil held above $100 a barrel after posting the biggest one-day advance since May as fears of a tightening market rattled traders. Saudi Arabia declined to commit to output increases following a visit by US President Joe Biden, and disruption along the Keystone pipeline cut shipments of some Canadian oil to US refiners. XBRUSD is consolidating above 102.00.
🟢Bitcoin tested $23 000, the level at which it last was in the middle of June. Altcoins rallied with Ether adding almost 11% at one point. Solana also achieved a double-digit percentage gain.
Coming next:
💷18:00 GMT+3 - BOE Gov Bailey speaks
💵21:35 - FOMC member Brainard speaks
💸Earnings reports
How about some trading? Who’s gonna trade what today?

👍32🔥11🥰3