
#MarketNews
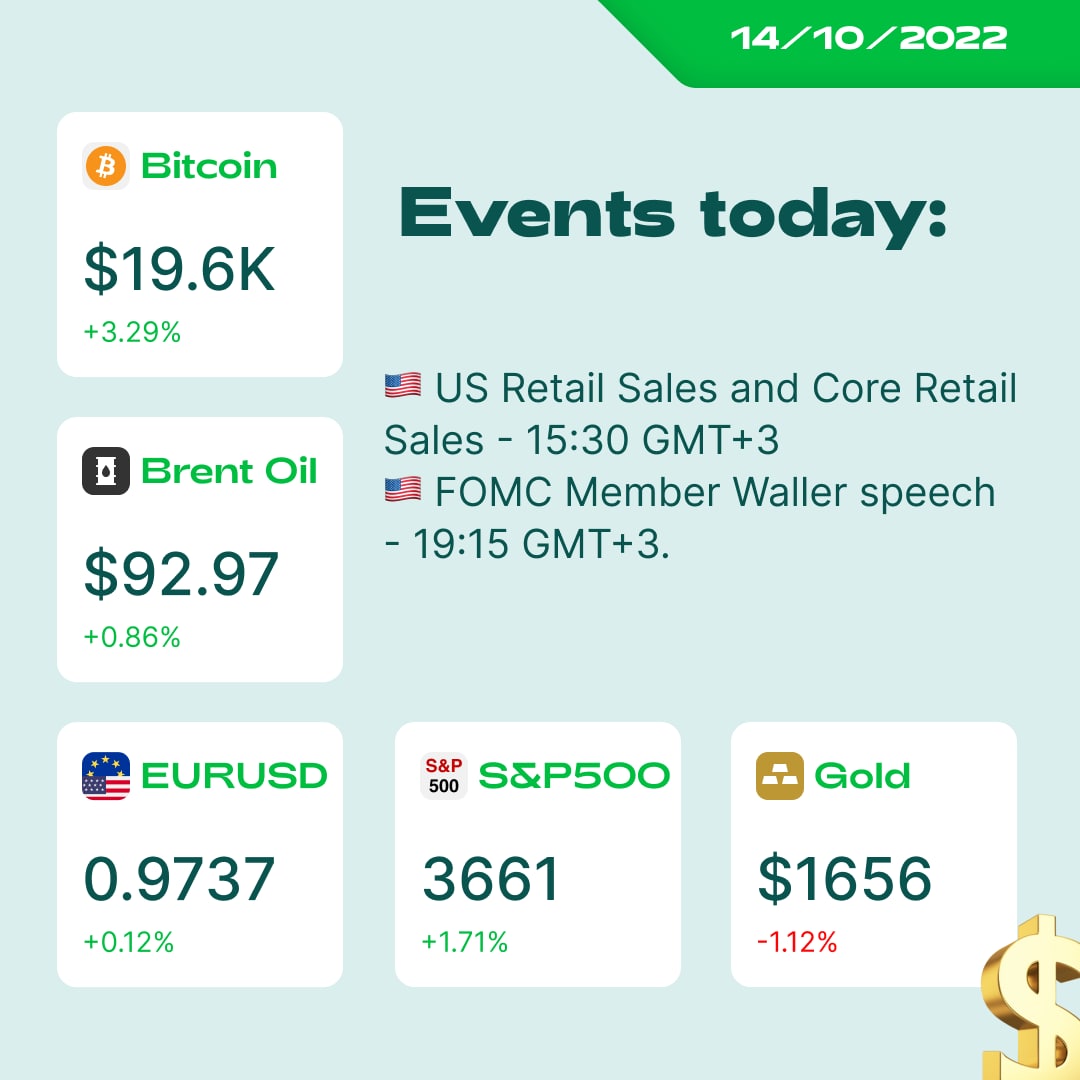
☀️ Inflation data annihilates bears on the market. The US500 plunged by 2.4% after the US CPI release but then reversed and caused a short-squeeze. More about that in our daily report: https://bit.ly/3EKZRvk
🇨🇳 China’s annual inflation came up as expected (2.8%). USDCNH rose by 360 points. Experts suggest Chinese credit growth remains near normal levels in Q4.
🇺🇸 US monthly CPI turned out to be twice the expectations (0.4% vs. 0.2%).
⛽️ North Stream 2 pipeline may be irreparable, says “Gazprom” CEO. Thus, the EU will face even more gas issues in the nearest future.
🥇Gold is consolidating in the channel no matter what CPI is here. The metal is preparing for a massive move on the following week.
🔥 Here you will find more analysis, our outlook for the US500, and news:
https://bit.ly/3EKZRvk
❓ What do you think about our US500 analysis in the article? The link is above this sentence
☀️ Inflation data annihilates bears on the market. The US500 plunged by 2.4% after the US CPI release but then reversed and caused a short-squeeze. More about that in our daily report: https://bit.ly/3EKZRvk
🇨🇳 China’s annual inflation came up as expected (2.8%). USDCNH rose by 360 points. Experts suggest Chinese credit growth remains near normal levels in Q4.
🇺🇸 US monthly CPI turned out to be twice the expectations (0.4% vs. 0.2%).
⛽️ North Stream 2 pipeline may be irreparable, says “Gazprom” CEO. Thus, the EU will face even more gas issues in the nearest future.
🥇Gold is consolidating in the channel no matter what CPI is here. The metal is preparing for a massive move on the following week.
🔥 Here you will find more analysis, our outlook for the US500, and news:
https://bit.ly/3EKZRvk
❓ What do you think about our US500 analysis in the article? The link is above this sentence
👍22❤4🥰4🔥3❤🔥2😍1🐳1
🇬🇧🇺🇸#GBPUSD
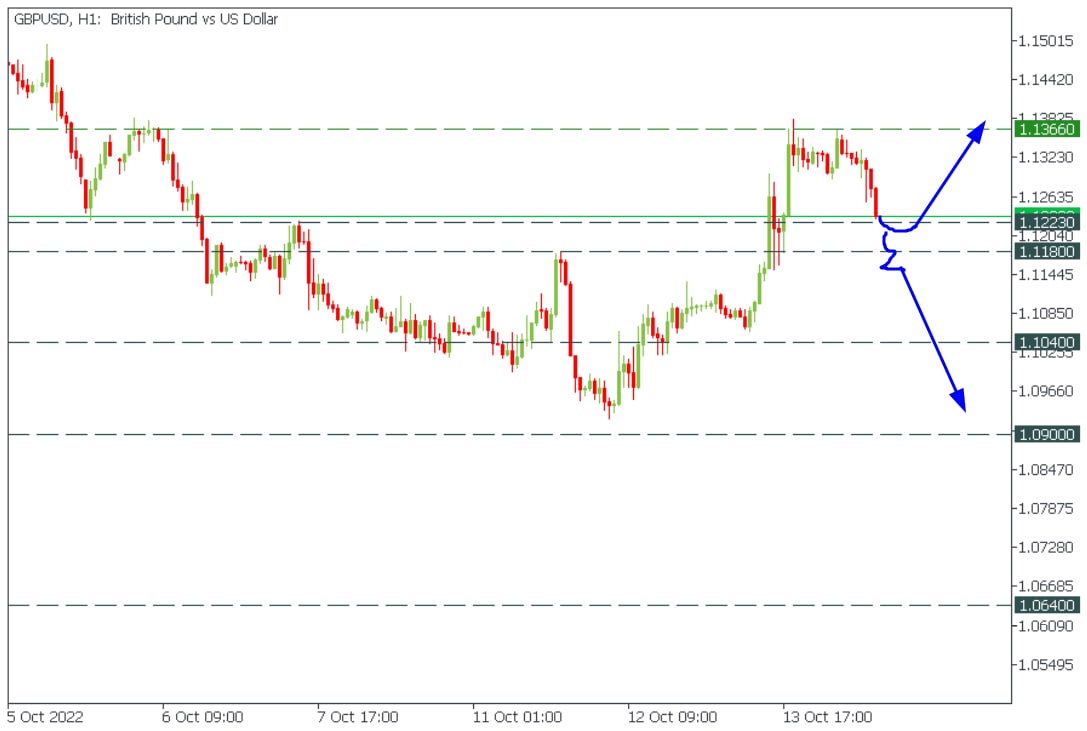
🔥GBPUSD is declining again!
All eyes at the 1.1180 - 1.2323 support range!
👆If buyers defend this level, the pair might reverse to 1.1366 and even 1.1490!
👇However, if buyers lose this range, GBPUSD will keep moving down towards 1.1040 and 1.0900.
Be patient and succeed!
✅START TRADING ✅
🔥GBPUSD is declining again!
All eyes at the 1.1180 - 1.2323 support range!
👆If buyers defend this level, the pair might reverse to 1.1366 and even 1.1490!
👇However, if buyers lose this range, GBPUSD will keep moving down towards 1.1040 and 1.0900.
Be patient and succeed!
✅START TRADING ✅
👍37🔥5😁5💩2
🇺🇸#Macroeconomics
🤔Why did the USD fall after the US CPI release?
On October 13, the Bureau of Labor Statistics published the Consumer Price index (CPI). Monthly CPI increased by 0.4% against the 0.2% expected in September. Core CPI gained 0.6% against the 0.4% expected in September.
As a result, markets dropped right after the announcement, with EURUSD losing over 1000 points.
💥What happened next?
Then, the experts turned their view to yearly CPI change (8.2% y/y increase in September vs. 8.3% y/y increase in August), highlighting the overall inflation growth slowdown. Moreover, many investors were selling stocks and crypto ahead of the release. Therefore, right after the release, they had to close their short positions purchasing the assets and pushing the stock market higher. As a result, the USD weakened, and markets reversed. EURUSD gained over 1500 points.
😱What to expect?
Now, investors believe the Fed might slow down the pace of rate hikes. But The Federal Reserve stated many times that the longer the inflation stays at the highest levels - the worse it is for the economy. That’s why their decisions are likely to remain hawkish. In this case, EURUSD, GBPUSD, and XAUUSD will stay under heavy pressure.
❗️Keep an eye on any Fed members' statements and the FOMC meeting on November 2.
🤔Why did the USD fall after the US CPI release?
On October 13, the Bureau of Labor Statistics published the Consumer Price index (CPI). Monthly CPI increased by 0.4% against the 0.2% expected in September. Core CPI gained 0.6% against the 0.4% expected in September.
As a result, markets dropped right after the announcement, with EURUSD losing over 1000 points.
💥What happened next?
Then, the experts turned their view to yearly CPI change (8.2% y/y increase in September vs. 8.3% y/y increase in August), highlighting the overall inflation growth slowdown. Moreover, many investors were selling stocks and crypto ahead of the release. Therefore, right after the release, they had to close their short positions purchasing the assets and pushing the stock market higher. As a result, the USD weakened, and markets reversed. EURUSD gained over 1500 points.
😱What to expect?
Now, investors believe the Fed might slow down the pace of rate hikes. But The Federal Reserve stated many times that the longer the inflation stays at the highest levels - the worse it is for the economy. That’s why their decisions are likely to remain hawkish. In this case, EURUSD, GBPUSD, and XAUUSD will stay under heavy pressure.
❗️Keep an eye on any Fed members' statements and the FOMC meeting on November 2.

👍34❤5🔥3🤩3🤯1
🇨🇦🇯🇵#CADJPY
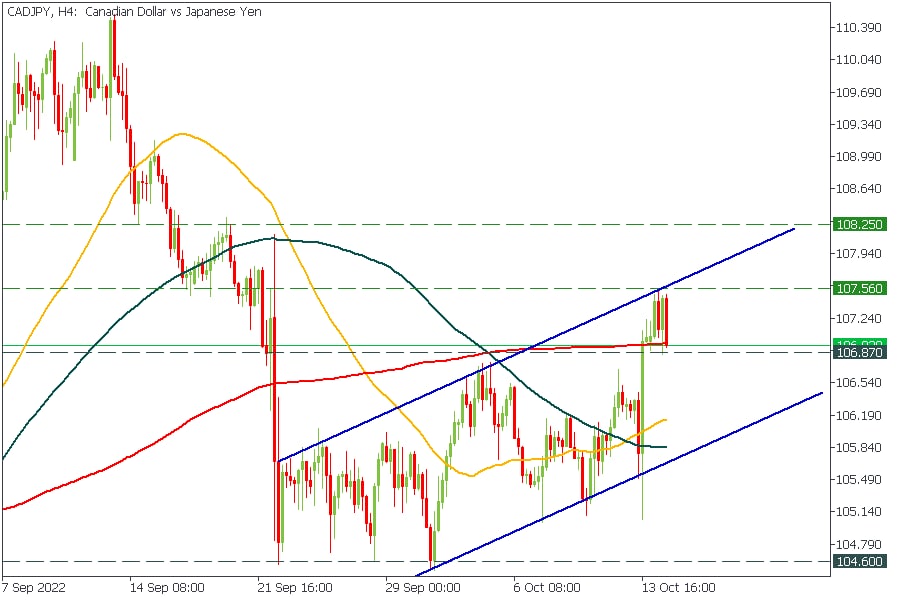
🔥CADJPY might be bearish!
On the M15 timeframe, CADJPY has formed a "head and shoulders" bearish pattern. If the price breaks below 106.87, you might sell it with the target at the lower channel's border.
Moreover, If the price breaks the lower channel's border, you might sell the pair again with the target at 104.60!
✅START TRADING ✅
🔥CADJPY might be bearish!
On the M15 timeframe, CADJPY has formed a "head and shoulders" bearish pattern. If the price breaks below 106.87, you might sell it with the target at the lower channel's border.
Moreover, If the price breaks the lower channel's border, you might sell the pair again with the target at 104.60!
✅START TRADING ✅
👍22🤡6🔥4👌3
TOP 5 Indicators for beginners👍🏻
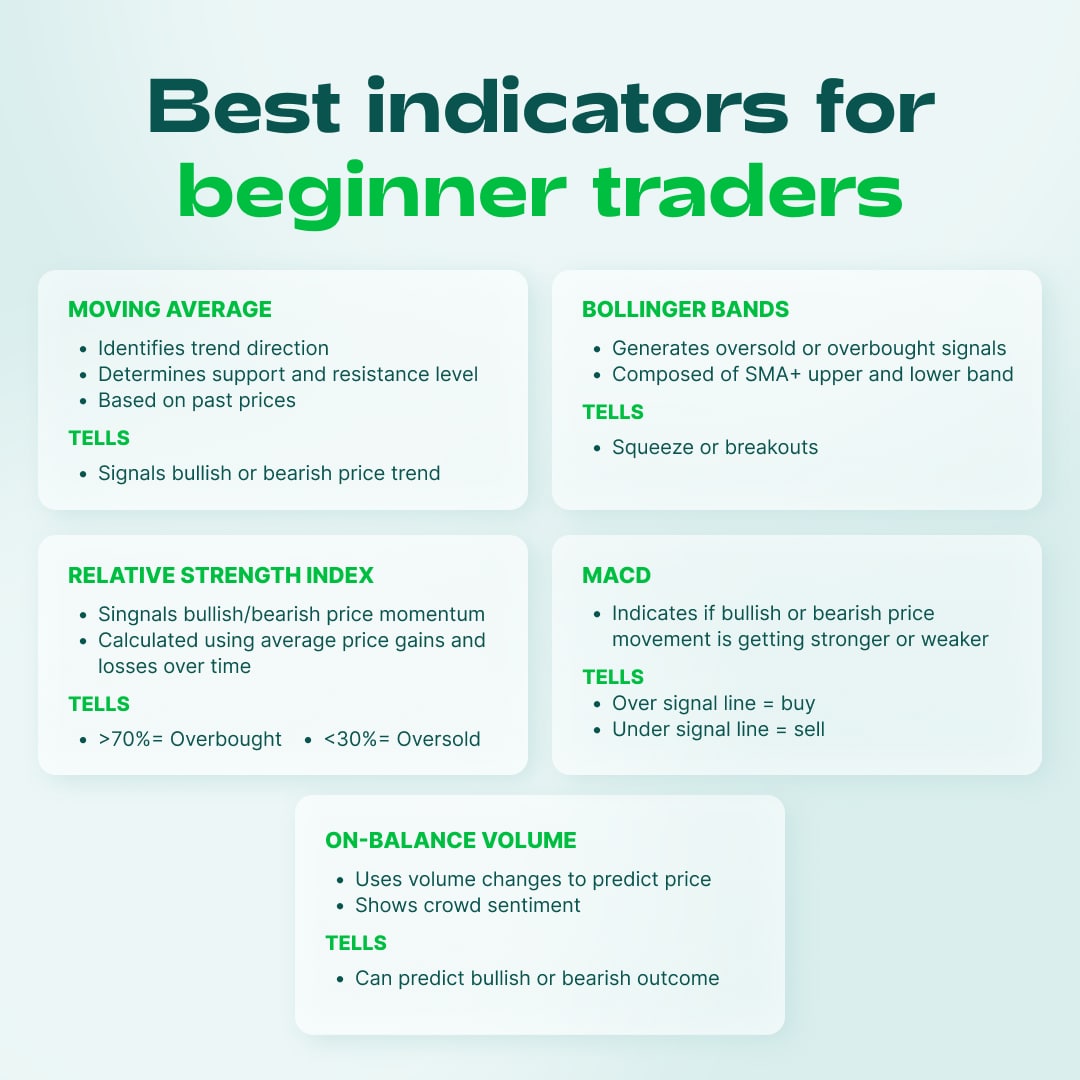
There are numerous indicators, and beginner traders can get confused by them! Today let’s discuss the five most popular indicators that are easy to use and apply to your technical analysis.💫
1️⃣Moving Average
This simple and clear indicator shows the trend direction and marks support and resistance levels. It’s based on past data and signals bullish or bearish trends!
2️⃣Bollinger Bands
Bollinger Bands are perfect for beginners. This indicator generates oversold and overbought signals and perfectly tells about squeezes and potential breakouts.
3️⃣Relative Strength Index
RSI is one of the most popular oscillators. RSI shows the bullish or bearish momentum, and it’s calculated using the average price gains and losses over time. Watch the 70 and 30 levels of the indicator to see if the market is oversold or overbought.
4️⃣MACD
MACD is another traders’ favorite. This indicator displays if buyers or sellers are getting stronger or weaker. It gives buy and sell signals, so don’t miss them!
5️⃣On-Balance Volume
On-Balance Volume uses volume changes to predict the price and shows the crowd sentiment. It’s great to predict the bullish or bearish outcome.
You can only choose indicators that work better for your strategy by trying different ones! Good luck!💫
There are numerous indicators, and beginner traders can get confused by them! Today let’s discuss the five most popular indicators that are easy to use and apply to your technical analysis.💫
1️⃣Moving Average
This simple and clear indicator shows the trend direction and marks support and resistance levels. It’s based on past data and signals bullish or bearish trends!
2️⃣Bollinger Bands
Bollinger Bands are perfect for beginners. This indicator generates oversold and overbought signals and perfectly tells about squeezes and potential breakouts.
3️⃣Relative Strength Index
RSI is one of the most popular oscillators. RSI shows the bullish or bearish momentum, and it’s calculated using the average price gains and losses over time. Watch the 70 and 30 levels of the indicator to see if the market is oversold or overbought.
4️⃣MACD
MACD is another traders’ favorite. This indicator displays if buyers or sellers are getting stronger or weaker. It gives buy and sell signals, so don’t miss them!
5️⃣On-Balance Volume
On-Balance Volume uses volume changes to predict the price and shows the crowd sentiment. It’s great to predict the bullish or bearish outcome.
You can only choose indicators that work better for your strategy by trying different ones! Good luck!💫
👍68❤🔥12🔥6😍5😢2
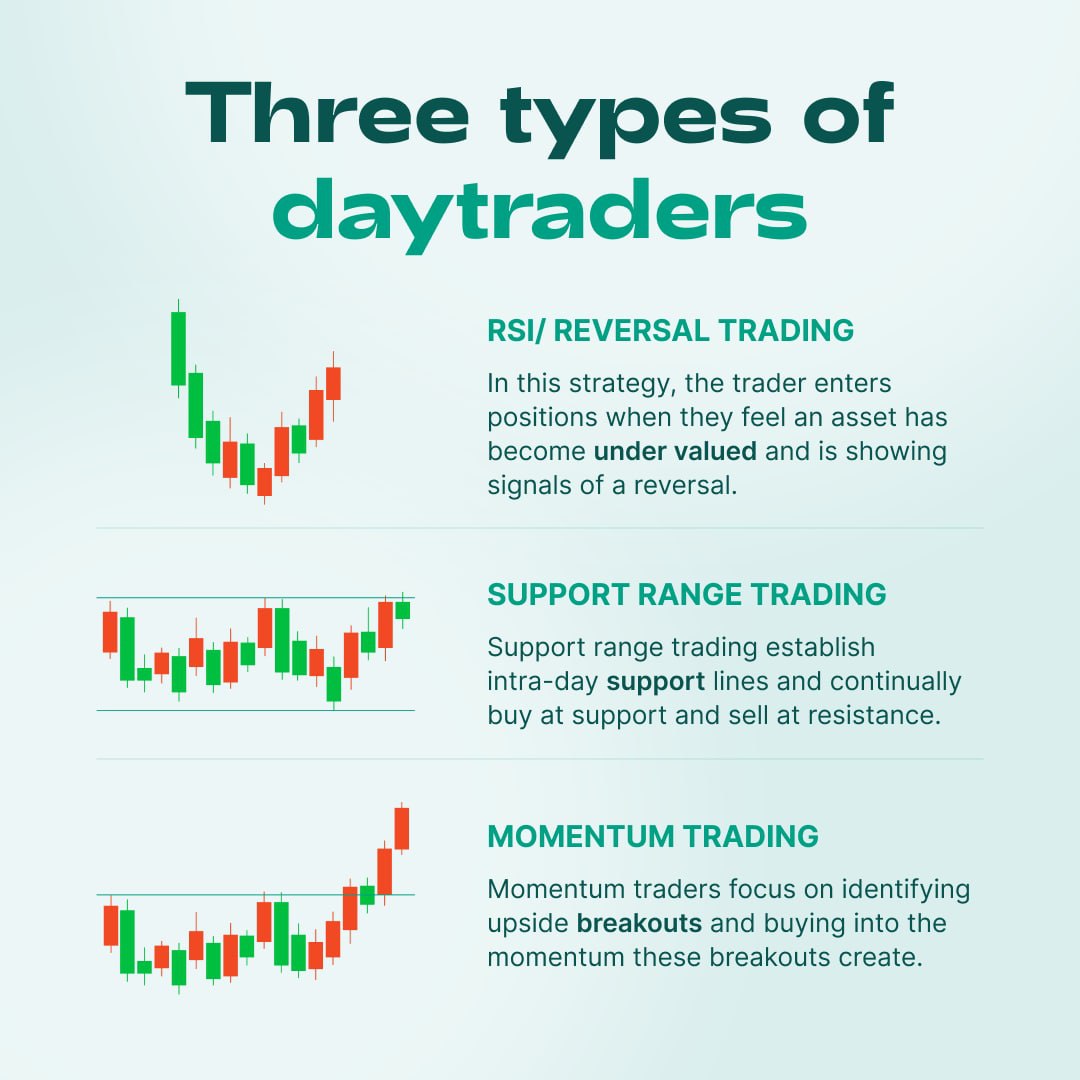
Three types of day traders ✨
Day traders have plenty of various approaches and strategies. How can they behave to make their trading session pleasant and productive? Let’s look through some ways. ☄️
1️⃣RSI/ Reversal trading
The most crucial thing in trading on reversals is seizing the right moment to trade! Check the indicators, like RSI, to see the reversal and open the order at the right time.
2️⃣Support range trading
If the price is in range, it gives a perfect chance to trade. As the prices consolidate between the two levels, you can predict where it will go next. The main rule is “buy at the support, sell at the resistance.”
3️⃣Momentum trading
Momentum trading is a great chance to get a profit. Try to identify breakouts and open the trade at this moment. The momentum indicator is perfect here!
How often do you practice intraday trading? Share in the comments!⬇️
Day traders have plenty of various approaches and strategies. How can they behave to make their trading session pleasant and productive? Let’s look through some ways. ☄️
1️⃣RSI/ Reversal trading
The most crucial thing in trading on reversals is seizing the right moment to trade! Check the indicators, like RSI, to see the reversal and open the order at the right time.
2️⃣Support range trading
If the price is in range, it gives a perfect chance to trade. As the prices consolidate between the two levels, you can predict where it will go next. The main rule is “buy at the support, sell at the resistance.”
3️⃣Momentum trading
Momentum trading is a great chance to get a profit. Try to identify breakouts and open the trade at this moment. The momentum indicator is perfect here!
How often do you practice intraday trading? Share in the comments!⬇️
👍75❤12🔥9❤🔥6🎉2
#GBPUSD
This trendline is likely to break👀
📁 The more touches we have on a particular trendline — the higher chances we have for a breakout. Usually, the fifth touch of the line is sure to bring us an excellent swing
💸 Still, we need to wait for a breakout and a confirmation. The pair needs to reach 1.1370 and higher to go higher. Take Profits are 1.1480 and 1.1630. Stop Loss below the yellow area
💬 Do you love trading GBPUSD? If yes, then why?
🚀 START TRADING🚀
This trendline is likely to break
🚀 START TRADING
Please open Telegram to view this post
VIEW IN TELEGRAM
👍54🔥13🥰6😍5🐳4❤3❤🔥2
#WeeklyReport
🔥What to watch on October 17 - 21?
🛢Oil market
XBRUSD and XTIUSD might experience massive volatility due to the Chinese GDP release on Tuesday, October 18. China is the second-largest economy in the world. Currently, the Chinese economy is facing a recession, affecting the oil market. Earlier today, China reported a 60% year-to-year air traffic decline, another sign of weakening economy. Therefore, we suggest selling oil if the actual GDP numbers underperform the forecast. If it happens, XBRUSD might decline to 77.00 per barrel.
🇯🇵Japanese Yen
Japan's Central Bank Governor is still super positive about a further soft monetary policy and economic stimulation. However, he also mentioned the Central Bank is ready to intervene in JPY. According to the technical analysis, levels 149.40, 151.32, 153.40, and 154.95 are the major resistance levels for USDJPY, where the Japanese central bank will most likely intervene.
🥇Gold
XAUUSD had an awful previous week. The price lost more than 3% and closed a totally bearish weekly candle. We expect the price to decline to the 1615 - 1622 support range at the beginning of this week. If the price breaks through this support, XAUUSD might keep falling toward 1563.00. However, if buyers defend the support range, we might see a massive local reversal for the yellow metal toward 1700.
🇺🇸🇨🇭USDCHF
The pair is trading under the global resistance range of 1.0060 - 1.0095. If the price breaks above, buy USDCHF with the target at 1.0220. However, if the price loses 0.9930 support, it will decline to 0.9840.
📈US100
The US stock market is struggling due to the US dollar's strength. However, the earnings season might change the situation. As experts' expectations are low, companies might easily overperform them and push US500, US30, and US100 higher. We suggest you trade US100 this week. If the price breaks above 11180, you might buy it with the target at 11600 and 12000. However, if companies' reports disappoint investors and the US100 breaks below the recent low, it might keep declining toward 9700.
🙏This week such companies as Bank of America, J&J, Netflix, IBM, and Alcoa will publish their earnings results. We will keep you informed!
Let's help each other and share your trade ideas for this week!
🔥What to watch on October 17 - 21?
🛢Oil market
XBRUSD and XTIUSD might experience massive volatility due to the Chinese GDP release on Tuesday, October 18. China is the second-largest economy in the world. Currently, the Chinese economy is facing a recession, affecting the oil market. Earlier today, China reported a 60% year-to-year air traffic decline, another sign of weakening economy. Therefore, we suggest selling oil if the actual GDP numbers underperform the forecast. If it happens, XBRUSD might decline to 77.00 per barrel.
🇯🇵Japanese Yen
Japan's Central Bank Governor is still super positive about a further soft monetary policy and economic stimulation. However, he also mentioned the Central Bank is ready to intervene in JPY. According to the technical analysis, levels 149.40, 151.32, 153.40, and 154.95 are the major resistance levels for USDJPY, where the Japanese central bank will most likely intervene.
🥇Gold
XAUUSD had an awful previous week. The price lost more than 3% and closed a totally bearish weekly candle. We expect the price to decline to the 1615 - 1622 support range at the beginning of this week. If the price breaks through this support, XAUUSD might keep falling toward 1563.00. However, if buyers defend the support range, we might see a massive local reversal for the yellow metal toward 1700.
🇺🇸🇨🇭USDCHF
The pair is trading under the global resistance range of 1.0060 - 1.0095. If the price breaks above, buy USDCHF with the target at 1.0220. However, if the price loses 0.9930 support, it will decline to 0.9840.
📈US100
The US stock market is struggling due to the US dollar's strength. However, the earnings season might change the situation. As experts' expectations are low, companies might easily overperform them and push US500, US30, and US100 higher. We suggest you trade US100 this week. If the price breaks above 11180, you might buy it with the target at 11600 and 12000. However, if companies' reports disappoint investors and the US100 breaks below the recent low, it might keep declining toward 9700.
🙏This week such companies as Bank of America, J&J, Netflix, IBM, and Alcoa will publish their earnings results. We will keep you informed!
Let's help each other and share your trade ideas for this week!
👍36🔥10❤3🐳1
#MarketNews
Good Monday, everyone! How's the start of the week? Let's brighten it up with the main headlines you need to know for trading!
⚡️ The gas flows fell to zero on the Yamal-Europe pipeline to Poland from Germany on Monday, while supplies of Russian gas to Europe via Ukraine were stable. Meanwhile, the gas price in Europe has fallen below $1400 for the first time since June 24 amid the reports of a new plan for a "dynamic price cap" proposed by the European Commission. A new mechanism will be discussed during the EU summit on October 20-21. XNGUSD broke the 200-day SMA and fell below 6.7.
🇬🇧Today, Liz Truss's new chancellor Jeremy Hunt is due to make a statement on measures to support financial stability. The news comes amid massive expectations that Liz Truss's package of unfunded tax cuts may be reversed. GBPUSD tries to overcome the descending trend line near 1.1300.
🇨🇳During China's 20th Party Congress, Chinese leader Xi Jinping said China's global power had increased while warning of challenges ahead. He also said China would win in the tensions with the US over technology.
🇯🇵As USDJPY has almost hit the 150 level, traders await possible interventions by Japanese officials.
🇺🇸According to the Conference Board measure of CEO Confidence, 98% of CEOs said they were preparing for a recession over the next year.
👏 Credit Suisse will pay $495 million to settle a case against it in the United States. Also, the group's Chairman announced the upcoming reforms in the bank. The bank will publish the details of its long-awaited strategic review on October 27.
❗️ This week, Bank of America, Goldman Sachs, Netflix, Johnson&Johnson, Tesla, IBM, Procter and Gamble, and Alcoa will publish their earnings results. Don't forget to check the forecasts for revenue and EPS beforehand.
🧐 What do you think about GBPUSD this week? Share in the comments!
Good Monday, everyone! How's the start of the week? Let's brighten it up with the main headlines you need to know for trading!
🇬🇧Today, Liz Truss's new chancellor Jeremy Hunt is due to make a statement on measures to support financial stability. The news comes amid massive expectations that Liz Truss's package of unfunded tax cuts may be reversed. GBPUSD tries to overcome the descending trend line near 1.1300.
🇨🇳During China's 20th Party Congress, Chinese leader Xi Jinping said China's global power had increased while warning of challenges ahead. He also said China would win in the tensions with the US over technology.
🇯🇵As USDJPY has almost hit the 150 level, traders await possible interventions by Japanese officials.
🇺🇸According to the Conference Board measure of CEO Confidence, 98% of CEOs said they were preparing for a recession over the next year.
Please open Telegram to view this post
VIEW IN TELEGRAM
👍18❤🔥5🔥5👏2🎉2🐳2
#USDJPY
🔥Buyers keep pushing USDJPY to new highs!
Right now, bulls are squeezing the pair to the 148.88 resistance level. Consider buying USDJPY after a breakout.
🎯Take-profit: 149.40
❗️Trade will be active only if the price breaks above 148.88.
✅START TRADING ✅
🔥Buyers keep pushing USDJPY to new highs!
Right now, bulls are squeezing the pair to the 148.88 resistance level. Consider buying USDJPY after a breakout.
🎯Take-profit: 149.40
❗️Trade will be active only if the price breaks above 148.88.
✅START TRADING ✅
👍29🔥12❤🔥2
🗓#calendar
KEY EVENTS FOR THE COMING WEEK:
Monday, October 17:
🇨🇳PRC - 20th Congress of the Communist Party - day 2
🇺🇸USA - NY Empire State Manufacturing Index (Oct) - 15:30 MT
🇺🇸USA - federal budget (Sep) - 21:00 MT
🇺🇸US - earnings season
Tuesday, October 18:
🇨🇳PRC - 20th Congress of the Communist Party - Day 3
🇨🇳PRC - GDP (Q3) - 05:00 MT
🇩🇪Germany - ZEW Economic Sentiment (Oct) - 12:00 MT
🇪🇺EU - ZEW Economic Sentiment (Oct) - 12:00 MT
🇺🇸USA - Industrial Production (Sep) -16:15 MT
🛢US Oil - API Reserves - 23:30 MT
🇺🇸US - earnings season
Wednesday, October 19:
🇨🇳PRC - 20th Congress of the Communist Party - Day 4
🇬🇧Britain - CPI Consumer Inflation (Sept) - 09:00 MT
🇪🇺EU - consumer inflation CPI (Sep) -12:00 MT
🇺🇸USA - Housing Starts (Sep) - 15:30 MT
🇨🇦Canada - consumer inflation CPI (Sep) -15:30 MT
🛢US Oil - EIA Reserves - 17:30 MT
🇺🇸US - earnings season
Thursday, October 20:
🇨🇳PRC - 20th Congress of the Communist Party - Day 5
🇩🇪Germany - PPI inflation (Sept) -09:00 MT
🇹🇷Turkey - Central Bank rate - 14:00 MT
🇺🇸USA - Initial Jobless Claims - 15:30 MT
🇺🇸USA - Philly Fed Manufacturing Index (Oct) - 15:30 MT
🇺🇸USA - Existing Home Sales (Sep) -17:00 MT
🛢Natural gas USA - EIA reserves - 17:30 MT
🇺🇸US - earnings season
Friday, October 21:
🇨🇳PRC - 20th Congress of the Communist Party - Day 6
🇪🇺EU - Consumer Confidence (Oct) -17:00 MT
🇺🇸US - earnings season
KEY EVENTS FOR THE COMING WEEK:
Monday, October 17:
🇨🇳PRC - 20th Congress of the Communist Party - day 2
🇺🇸USA - NY Empire State Manufacturing Index (Oct) - 15:30 MT
🇺🇸USA - federal budget (Sep) - 21:00 MT
🇺🇸US - earnings season
Tuesday, October 18:
🇨🇳PRC - 20th Congress of the Communist Party - Day 3
🇨🇳PRC - GDP (Q3) - 05:00 MT
🇩🇪Germany - ZEW Economic Sentiment (Oct) - 12:00 MT
🇪🇺EU - ZEW Economic Sentiment (Oct) - 12:00 MT
🇺🇸USA - Industrial Production (Sep) -16:15 MT
🛢US Oil - API Reserves - 23:30 MT
🇺🇸US - earnings season
Wednesday, October 19:
🇨🇳PRC - 20th Congress of the Communist Party - Day 4
🇬🇧Britain - CPI Consumer Inflation (Sept) - 09:00 MT
🇪🇺EU - consumer inflation CPI (Sep) -12:00 MT
🇺🇸USA - Housing Starts (Sep) - 15:30 MT
🇨🇦Canada - consumer inflation CPI (Sep) -15:30 MT
🛢US Oil - EIA Reserves - 17:30 MT
🇺🇸US - earnings season
Thursday, October 20:
🇨🇳PRC - 20th Congress of the Communist Party - Day 5
🇩🇪Germany - PPI inflation (Sept) -09:00 MT
🇹🇷Turkey - Central Bank rate - 14:00 MT
🇺🇸USA - Initial Jobless Claims - 15:30 MT
🇺🇸USA - Philly Fed Manufacturing Index (Oct) - 15:30 MT
🇺🇸USA - Existing Home Sales (Sep) -17:00 MT
🛢Natural gas USA - EIA reserves - 17:30 MT
🇺🇸US - earnings season
Friday, October 21:
🇨🇳PRC - 20th Congress of the Communist Party - Day 6
🇪🇺EU - Consumer Confidence (Oct) -17:00 MT
🇺🇸US - earnings season
👍25🔥6
🇺🇸#USD
🔥USD is ready to fly!
If the price breaks through the descending trend line, it might quickly reach the 113.60 resistance, pressing EURUSD, GBPUSD, and XAUUSD.
Moreover, we expect the US dollar index to break through 113.60 and reach 114.60, which might send risk assets to new lows.
🤔What is your opinion regarding the US dollar index?
✅START TRADING ✅
🔥USD is ready to fly!
If the price breaks through the descending trend line, it might quickly reach the 113.60 resistance, pressing EURUSD, GBPUSD, and XAUUSD.
Moreover, we expect the US dollar index to break through 113.60 and reach 114.60, which might send risk assets to new lows.
🤔What is your opinion regarding the US dollar index?
✅START TRADING ✅
🔥50👍20👎7💩2🤔1🥴1
#XAUUSD
🚀 Gold breakout!
📈 The metal broke through the resistance trendline. We will be waiting for a retest to happen before entering the BUY trade
💎 Still, after the trendline retest, we expect gold to reach $1680. If you enter the trade with us, don't forget to close 50-60% of the trade halfway and more your Stop Loss to decrease risks
💬 What do you think? Will gold rise?
💸 START TRADING 💸
Please open Telegram to view this post
VIEW IN TELEGRAM
👍59🔥20🤬11👎9❤🔥8🎉1💩1🕊1
#MarketNews
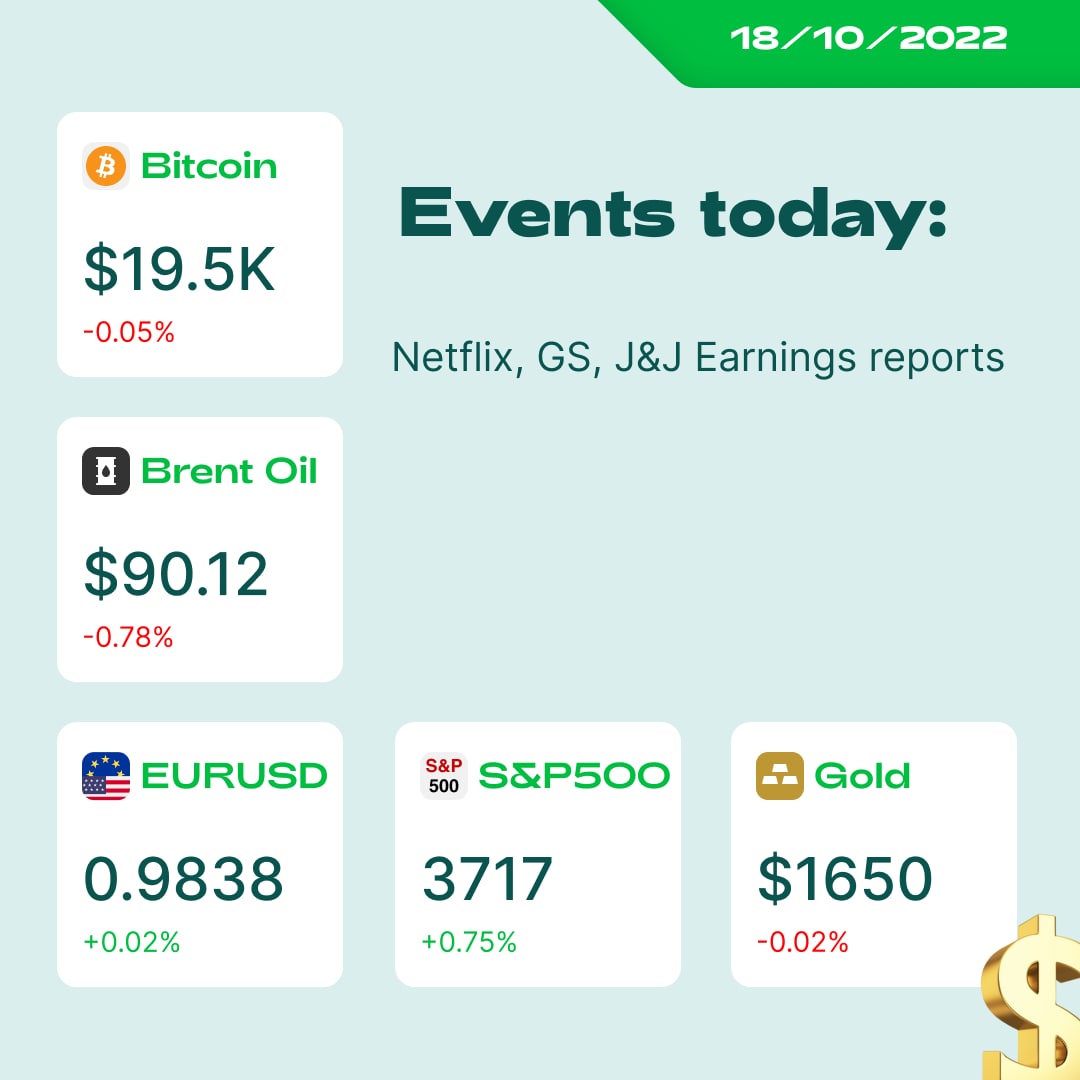
☀️Good afternoon, traders! Here are some news moving the markets right now!
🛢🇺🇸The Biden administration plans to sell oil from the Strategic Petroleum Reserve to lower fuel prices ahead of next month's congressional elections.
🇬🇧The Bank of England intends to further delay quantitative tightening until the market becomes calmer.
🇺🇸🇯🇵USDJPY reached 149. The highest level in 32 years.
🇺🇸JP Morgan strategists said they are cutting back on their overweight position in equities and trimming their underweight position in bonds due to increased risk that central banks will make a hawkish policy error.
🛢The European Union will not introduce a ceiling on gas prices yet amid political disagreements in the countries of the association and problems with fuel supplies.
🇺🇸US500 bounces from the 200-week moving average, which is a historic support for the price. The index is up by 1.5% today.
Read XAUUSD analysis: https://bit.ly/3eCc9vo
🤔What are you trading today?
☀️Good afternoon, traders! Here are some news moving the markets right now!
🛢🇺🇸The Biden administration plans to sell oil from the Strategic Petroleum Reserve to lower fuel prices ahead of next month's congressional elections.
🇬🇧The Bank of England intends to further delay quantitative tightening until the market becomes calmer.
🇺🇸🇯🇵USDJPY reached 149. The highest level in 32 years.
🇺🇸JP Morgan strategists said they are cutting back on their overweight position in equities and trimming their underweight position in bonds due to increased risk that central banks will make a hawkish policy error.
🛢The European Union will not introduce a ceiling on gas prices yet amid political disagreements in the countries of the association and problems with fuel supplies.
🇺🇸US500 bounces from the 200-week moving average, which is a historic support for the price. The index is up by 1.5% today.
Read XAUUSD analysis: https://bit.ly/3eCc9vo
🤔What are you trading today?
👍28🔥4🥰3❤🔥2🐳2😍1
🇬🇧🇺🇸#GBPUSD
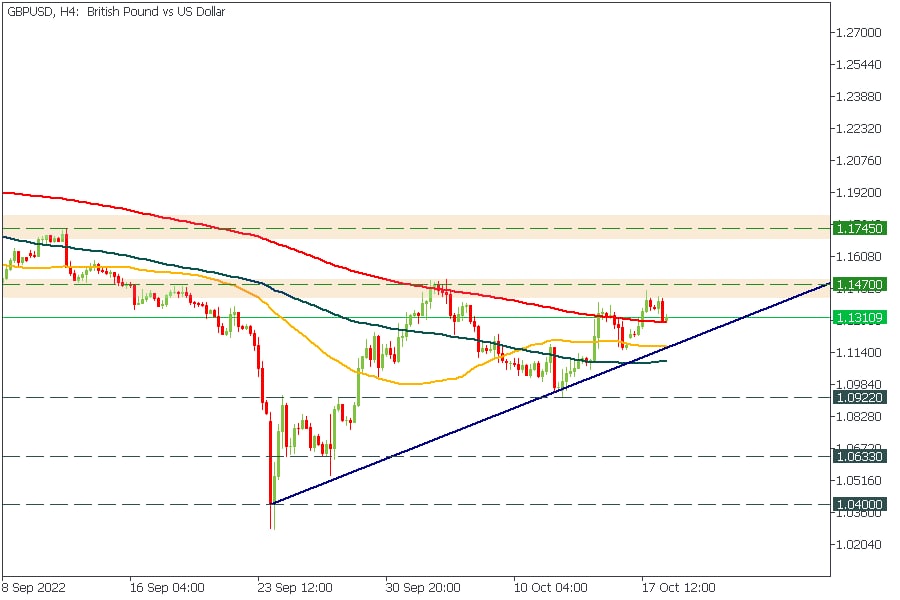
🔥GBPUSD middle-term analysis!
Buyers squeeze the price to 1.1470 resistance level! If they push the pair above this level, it will easily reach 1.1745.
However, if buyers lose the support (blue) trend line, the pair might make another swing toward year lows.
❓What level will GBPUSD reach first: 1.1745 or 1.0922❓
✅START TRADING ✅
🔥GBPUSD middle-term analysis!
Buyers squeeze the price to 1.1470 resistance level! If they push the pair above this level, it will easily reach 1.1745.
However, if buyers lose the support (blue) trend line, the pair might make another swing toward year lows.
❓What level will GBPUSD reach first: 1.1745 or 1.0922❓
✅START TRADING ✅
🔥15👍10
#EURUSD
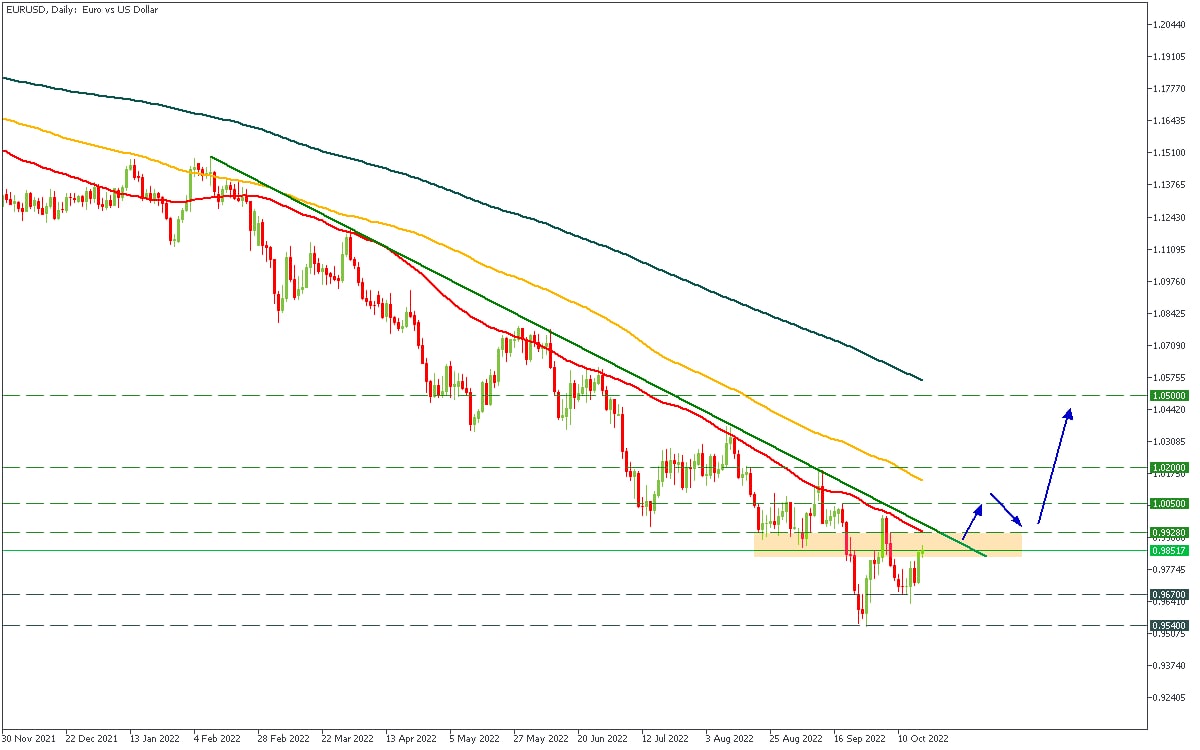
🚀 The EUR Wants to Surge Against the USD
👀 The most traded currency pair is moving under the resistance trendline for 194 trading sessions. It’s one of the most extended channels we’ve ever seen.
📈 Thus, the breakout should be massive, sending the pair through 50- and 100-daily moving averages. In this case, the resistances of 1.0050 and 1.0500 may be your mid-term targets.
🟨 Still, there is a yellow area to break before significant bullish swings. The EURUSD pair may fail to pass through the resistance again, moving below the 20-year low.
💭 What is your favorite EURUSD timeframe?
💚 START TRADING 💚
🚀 The EUR Wants to Surge Against the USD
👀 The most traded currency pair is moving under the resistance trendline for 194 trading sessions. It’s one of the most extended channels we’ve ever seen.
📈 Thus, the breakout should be massive, sending the pair through 50- and 100-daily moving averages. In this case, the resistances of 1.0050 and 1.0500 may be your mid-term targets.
🟨 Still, there is a yellow area to break before significant bullish swings. The EURUSD pair may fail to pass through the resistance again, moving below the 20-year low.
💭 What is your favorite EURUSD timeframe?
💚 START TRADING 💚
👍29❤12🔥5😍3🏆2👎1🐳1
🇪🇺🇨🇦#EURCAD
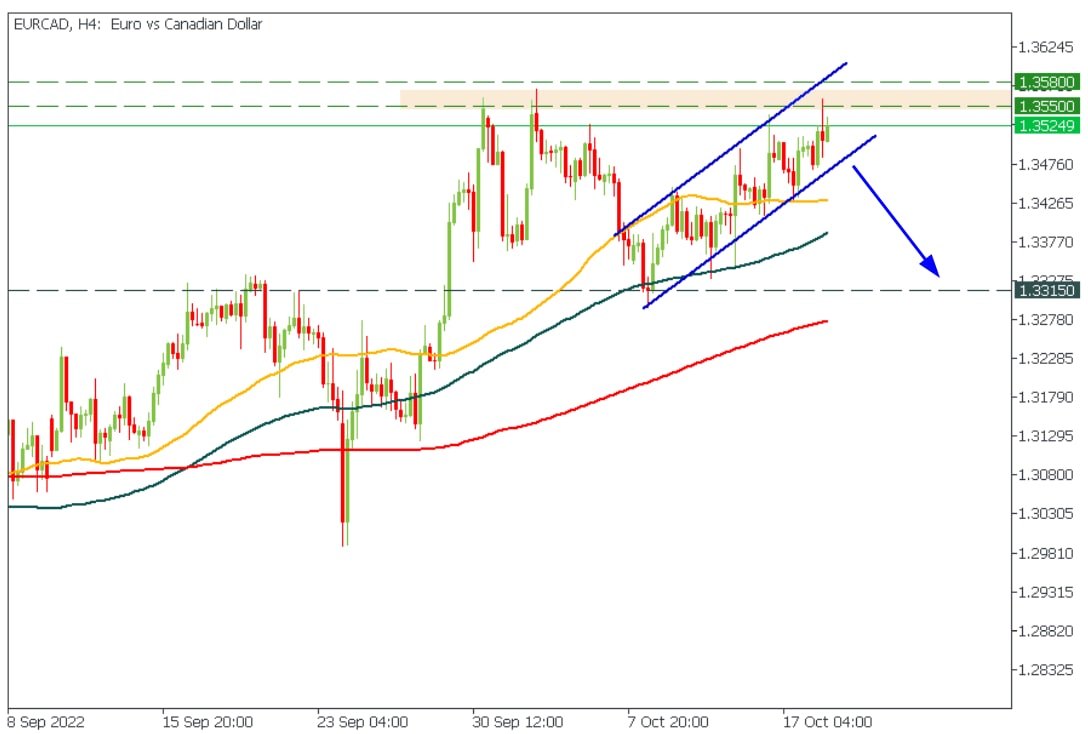
🔥EURCAD might drop soon!
The price is moving toward the 1.3550 - 1.3580 resistance range inside the rising channel. Consider selling the pair inside the resistance range or after the price breaks through the channel's lower border!
🎯Target: 1.3315
✅START TRADING ✅
🔥EURCAD might drop soon!
The price is moving toward the 1.3550 - 1.3580 resistance range inside the rising channel. Consider selling the pair inside the resistance range or after the price breaks through the channel's lower border!
🎯Target: 1.3315
✅START TRADING ✅
🔥23👍12❤10🤬5👎1👏1
🇺🇸#US100
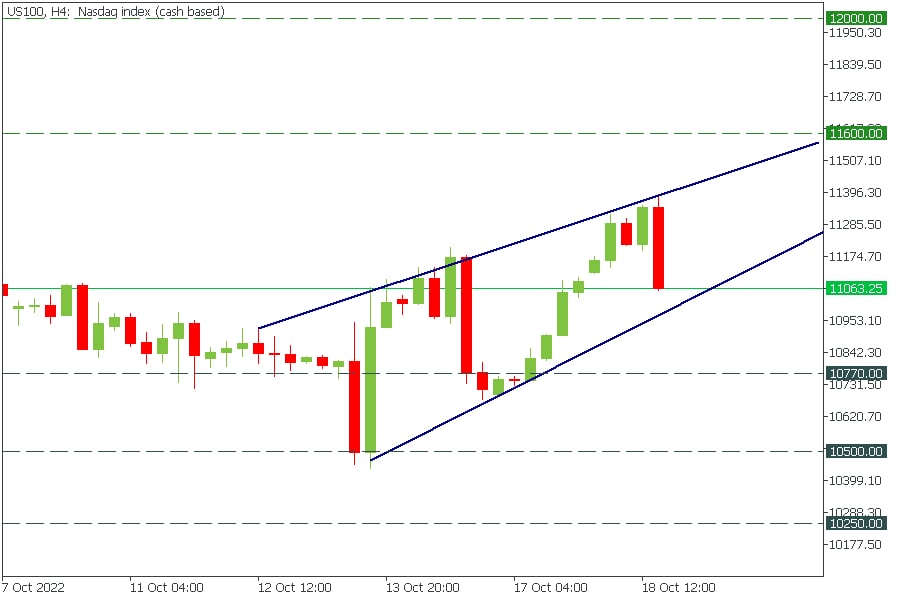
🔥US100 is bearish!
Pattern: bearish wedge
Trade: Sell after the price breaks through the wedge's lower border.
TP: 10770; 10500; 10250.
✅START TRADING ✅
🔥US100 is bearish!
Pattern: bearish wedge
Trade: Sell after the price breaks through the wedge's lower border.
TP: 10770; 10500; 10250.
✅START TRADING ✅
🤬21👍12🔥9🥰4💩3🎉1
🇬🇧🇨🇦#GBP #CAD
🔥Big volatility is coming today!
Today, the UK Office for National Statistics will publish its Consumer Price Index (CPI) at 09:00 GMT+3. Moreover, Statistics Canada will release the Consumer Price Index (CPI) at 15:30 GMT+3.
🤔Why is it so important?
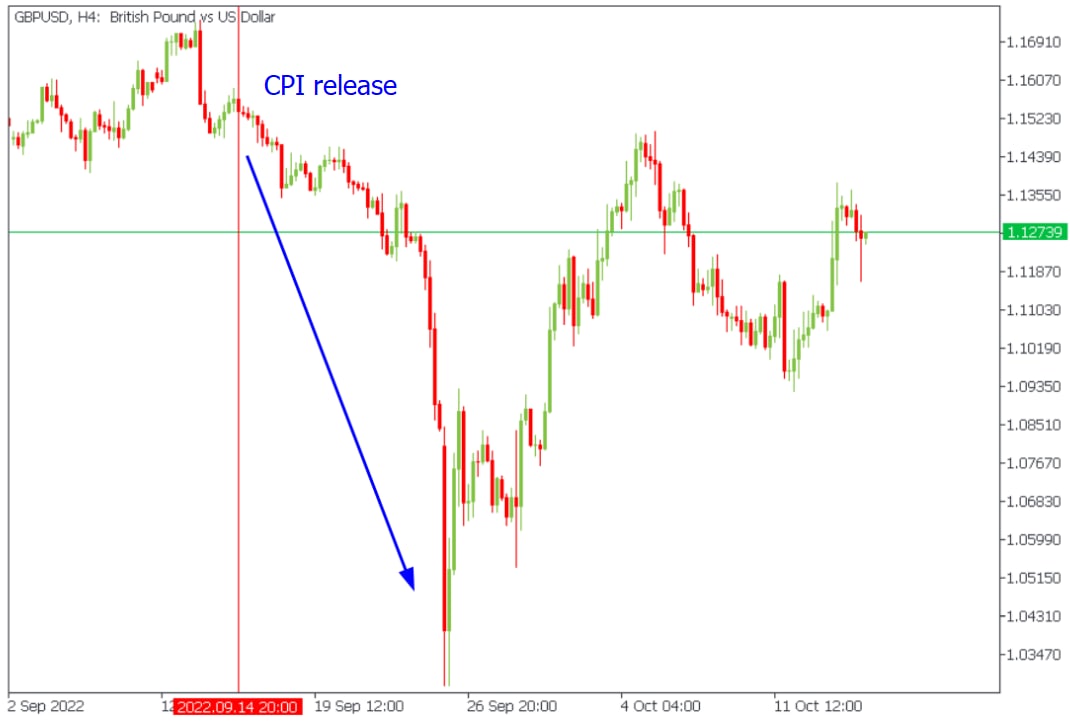
Both of these countries reported better-than-expected results for August 2022. As a result, GBP and CAD dropped significantly against the USD.
⏺The UK Office for National Statistics reported a 9.9% y/y inflation change in August against the 10.0% expected. GBPUSD lost 10 000 points within the next eight days.
⏺Statistics Canada announced a 4.8% y/y median CPI change against the 5.1% expected. As a result, USDCAD gained 6000 points within the next eight days.
What are your ideas about GBP and CAD today?
✅START TRADING ✅
🔥Big volatility is coming today!
Today, the UK Office for National Statistics will publish its Consumer Price Index (CPI) at 09:00 GMT+3. Moreover, Statistics Canada will release the Consumer Price Index (CPI) at 15:30 GMT+3.
🤔Why is it so important?
Both of these countries reported better-than-expected results for August 2022. As a result, GBP and CAD dropped significantly against the USD.
⏺The UK Office for National Statistics reported a 9.9% y/y inflation change in August against the 10.0% expected. GBPUSD lost 10 000 points within the next eight days.
⏺Statistics Canada announced a 4.8% y/y median CPI change against the 5.1% expected. As a result, USDCAD gained 6000 points within the next eight days.
What are your ideas about GBP and CAD today?
✅START TRADING ✅
👍25🔥9❤5
🇪🇺🇺🇸#EURUSD
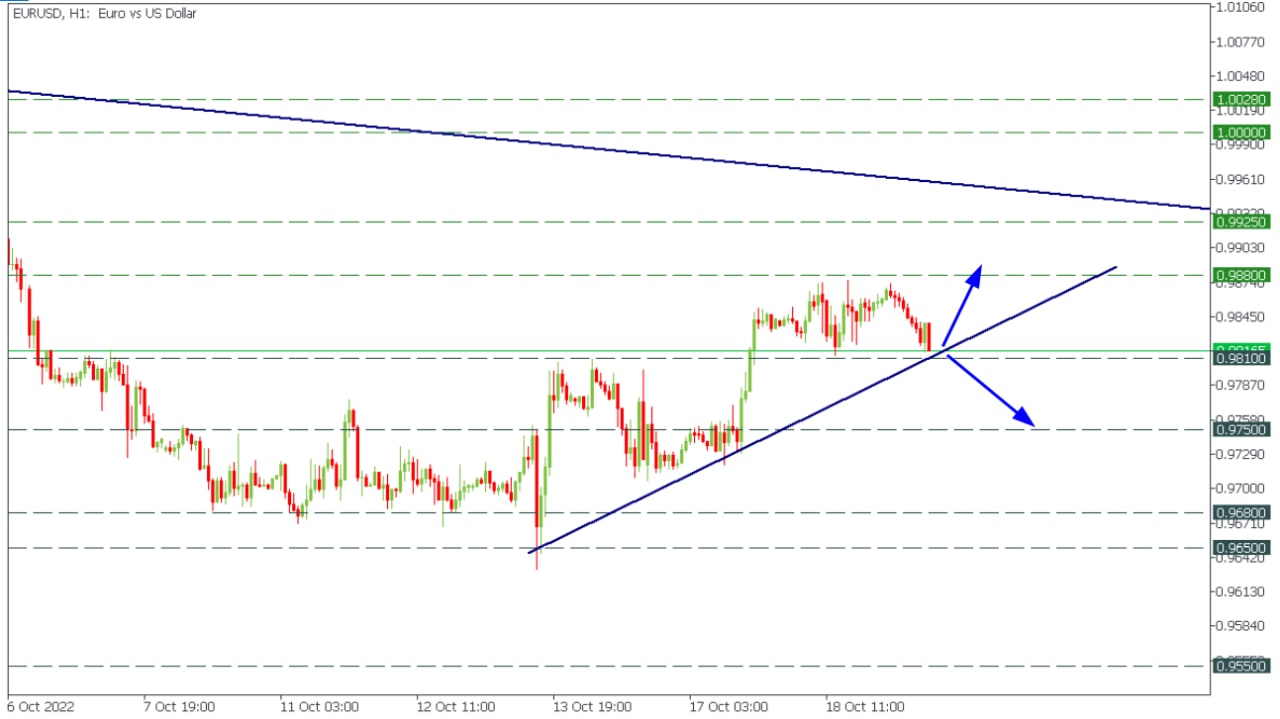
🔥EURUSD is testing the support line!
The price is trading right he cross point of the rising support line and the 0.9810 support level!
Watch the price reaction!
☝️If it bounces buy EURUSD with the targets at 0.9880 and 0.9925!
👇In case of breakout, sell the pair with the targets at 0.9750 and 0.9680!
✅START TRADING ✅
🔥EURUSD is testing the support line!
The price is trading right he cross point of the rising support line and the 0.9810 support level!
Watch the price reaction!
☝️If it bounces buy EURUSD with the targets at 0.9880 and 0.9925!
👇In case of breakout, sell the pair with the targets at 0.9750 and 0.9680!
✅START TRADING ✅
🔥21👍13❤5🥰2😁2