🇺🇸#US500
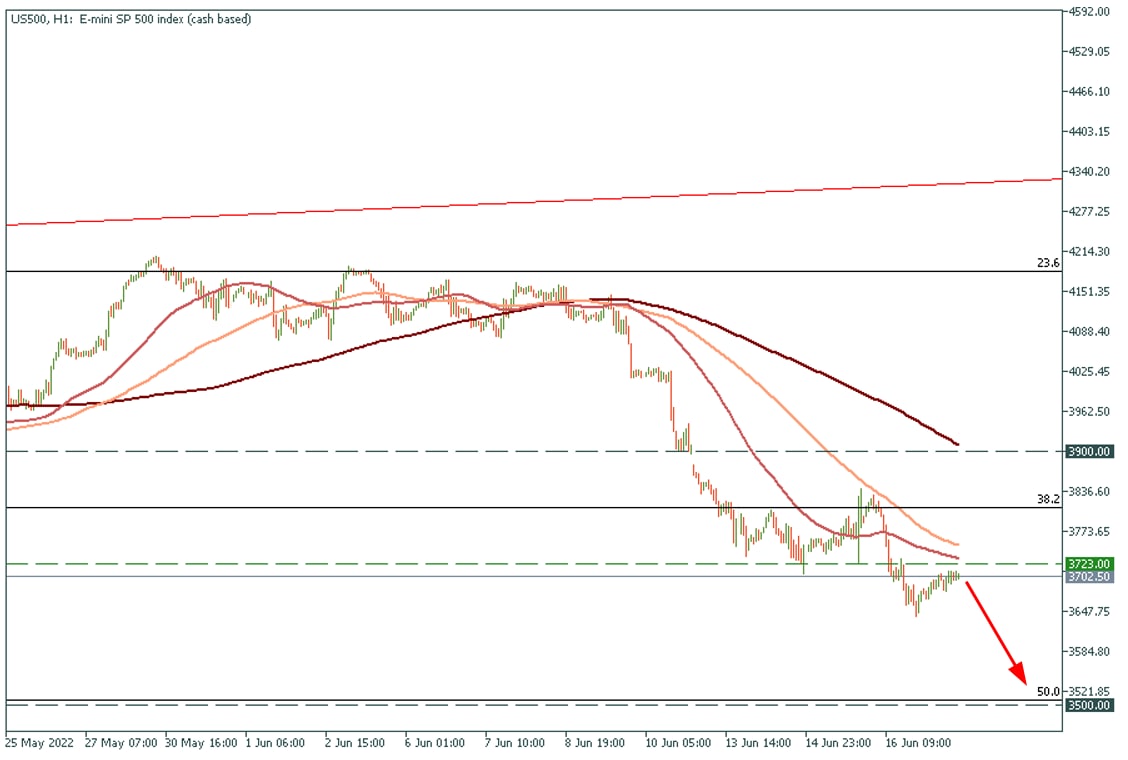
🔥US500 keeps going down!
The price is retesting the 3723 level from below. Consider looking for a SELL trade.
Target: 3500
Stop: If the H1 candle closes above 3740
Risk-reward: 1:5
✅START TRADING✅
🔥US500 keeps going down!
The price is retesting the 3723 level from below. Consider looking for a SELL trade.
Target: 3500
Stop: If the H1 candle closes above 3740
Risk-reward: 1:5
✅START TRADING✅
👍16🔥3🥰2👎1
#FBSTradingMarathon
Winners & Prizes
🎉The FBS Marathon: Gold Edition is over! Thank you everyone for participation! We really appreciate it! Now it’s time to congratulate our winners! 🎉
😌This time the marathon was vivid and exciting! Let’s honor our winners!
🏆On the 3rd place, Waheed Opeyemi Omodunbi from Nigeria with 66999 points of profit! Congrats, $200 from FBS are yours!
🏆On the 2nd place, Yubaidah from Indonesia with 76804 points of profit! Wow, you'll receive $300 from FBS!
🏆And on the 1st place, Leonardo Augusto Rodrigues Barroso from Brasil with 232108 points of profit! Amazing, you'll get $500 on your FBS account!
🎉Congratulations, guys!✨
🎓Also, Andile Nomsolwane from South Africa gets a private consultation with an FBS analyst.
➡️Soon we’ll give away $100 randomly among the participants who fulfilled all conditions of the contest. Stay tuned😉
💥Congratulations to all the winners and those who made a profit! We really hope that you had fun and gain experience in gold trading!
Leave 🔥 reaction if you wait for the next marathon~
Winners & Prizes
🎉The FBS Marathon: Gold Edition is over! Thank you everyone for participation! We really appreciate it! Now it’s time to congratulate our winners! 🎉
😌This time the marathon was vivid and exciting! Let’s honor our winners!
🏆On the 3rd place, Waheed Opeyemi Omodunbi from Nigeria with 66999 points of profit! Congrats, $200 from FBS are yours!
🏆On the 2nd place, Yubaidah from Indonesia with 76804 points of profit! Wow, you'll receive $300 from FBS!
🏆And on the 1st place, Leonardo Augusto Rodrigues Barroso from Brasil with 232108 points of profit! Amazing, you'll get $500 on your FBS account!
🎉Congratulations, guys!✨
🎓Also, Andile Nomsolwane from South Africa gets a private consultation with an FBS analyst.
➡️Soon we’ll give away $100 randomly among the participants who fulfilled all conditions of the contest. Stay tuned😉
💥Congratulations to all the winners and those who made a profit! We really hope that you had fun and gain experience in gold trading!
Leave 🔥 reaction if you wait for the next marathon~

🔥98👍40❤12👏10🎉7🥰3
🇯🇵#JPY
🔥Will Yen keep its way down?
📈On Wednesday, June 15, USDJPY hit the highest level since January 2002 at 135.57. Analysts believe the Japanese currency can break even lower against the USD. Thus, USDJPY may reach the 145 level by the year-end.
Want to learn more about the future of the Japanese yen?
▶️Read the article: https://bit.ly/39vbskY
🔥Will Yen keep its way down?
📈On Wednesday, June 15, USDJPY hit the highest level since January 2002 at 135.57. Analysts believe the Japanese currency can break even lower against the USD. Thus, USDJPY may reach the 145 level by the year-end.
Want to learn more about the future of the Japanese yen?
▶️Read the article: https://bit.ly/39vbskY

❤22👍13🔥9😁4🤔4👏3
🇺🇸🇨🇦#USDCAD
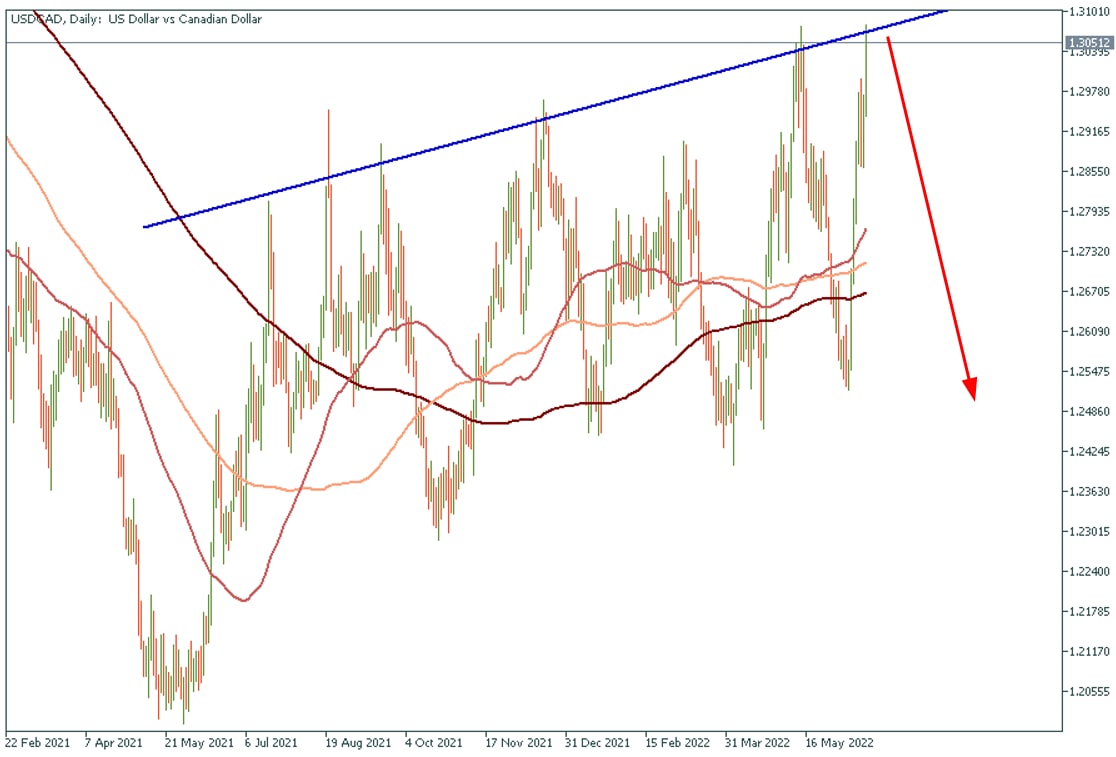
🔥Huge sell opportunity!
Pair: USDCAD
Trade: Sell
Reason: The price has reached the resistance trendline
✅START TRADING✅
🔥Huge sell opportunity!
Pair: USDCAD
Trade: Sell
Reason: The price has reached the resistance trendline
✅START TRADING✅
👍68🔥26👏8😢6❤4
#Education
🔥An amazing Stochastic oscillator!
👋Hello, dear traders! Let’s talk about this week’s indicator- it’s stochastic! Why is it so great? Let’s see.
The Stochastic indicator is actively used among traders all over the world. It evaluates the market’s momentum and compares the closing price to a price over a certain period of time. The idea behind the indicator is that in bullish market prices will close near the high, and in a bearish market prices close near the low.
The Stochastics can show when the asset you trade is overbought or oversold. It signals when the market’s momentum is slowing down. This, in turn, means that a change in trend is likely. As a result, the observation of the indicator may provide you with trade signals and ideas.
🤔How to trade using a stochastic oscillator?
1) Seize the moment when the 2-period EMA crosses above 4-period EMA.
2) Look at the stochastic- it should leave the oversold zone and move higher.
3) Place a long entry at the high of the previous candle.
4) Set a Stop Loss below the candlestick low after the crossover.
5) Wait until stochastic oscillator crosses in the overbought zone.
6) Exit the trade here!
The Stochastic Oscillator is a powerful tool of technical analysis!
✅Watch this video to learn more: https://youtu.be/SFG-2g4wwS8
🔥An amazing Stochastic oscillator!
👋Hello, dear traders! Let’s talk about this week’s indicator- it’s stochastic! Why is it so great? Let’s see.
The Stochastic indicator is actively used among traders all over the world. It evaluates the market’s momentum and compares the closing price to a price over a certain period of time. The idea behind the indicator is that in bullish market prices will close near the high, and in a bearish market prices close near the low.
The Stochastics can show when the asset you trade is overbought or oversold. It signals when the market’s momentum is slowing down. This, in turn, means that a change in trend is likely. As a result, the observation of the indicator may provide you with trade signals and ideas.
🤔How to trade using a stochastic oscillator?
1) Seize the moment when the 2-period EMA crosses above 4-period EMA.
2) Look at the stochastic- it should leave the oversold zone and move higher.
3) Place a long entry at the high of the previous candle.
4) Set a Stop Loss below the candlestick low after the crossover.
5) Wait until stochastic oscillator crosses in the overbought zone.
6) Exit the trade here!
The Stochastic Oscillator is a powerful tool of technical analysis!
✅Watch this video to learn more: https://youtu.be/SFG-2g4wwS8

👍73🔥14❤11👏8🎉4🤩3👎2🥰1
🙂 The most important trading emotion
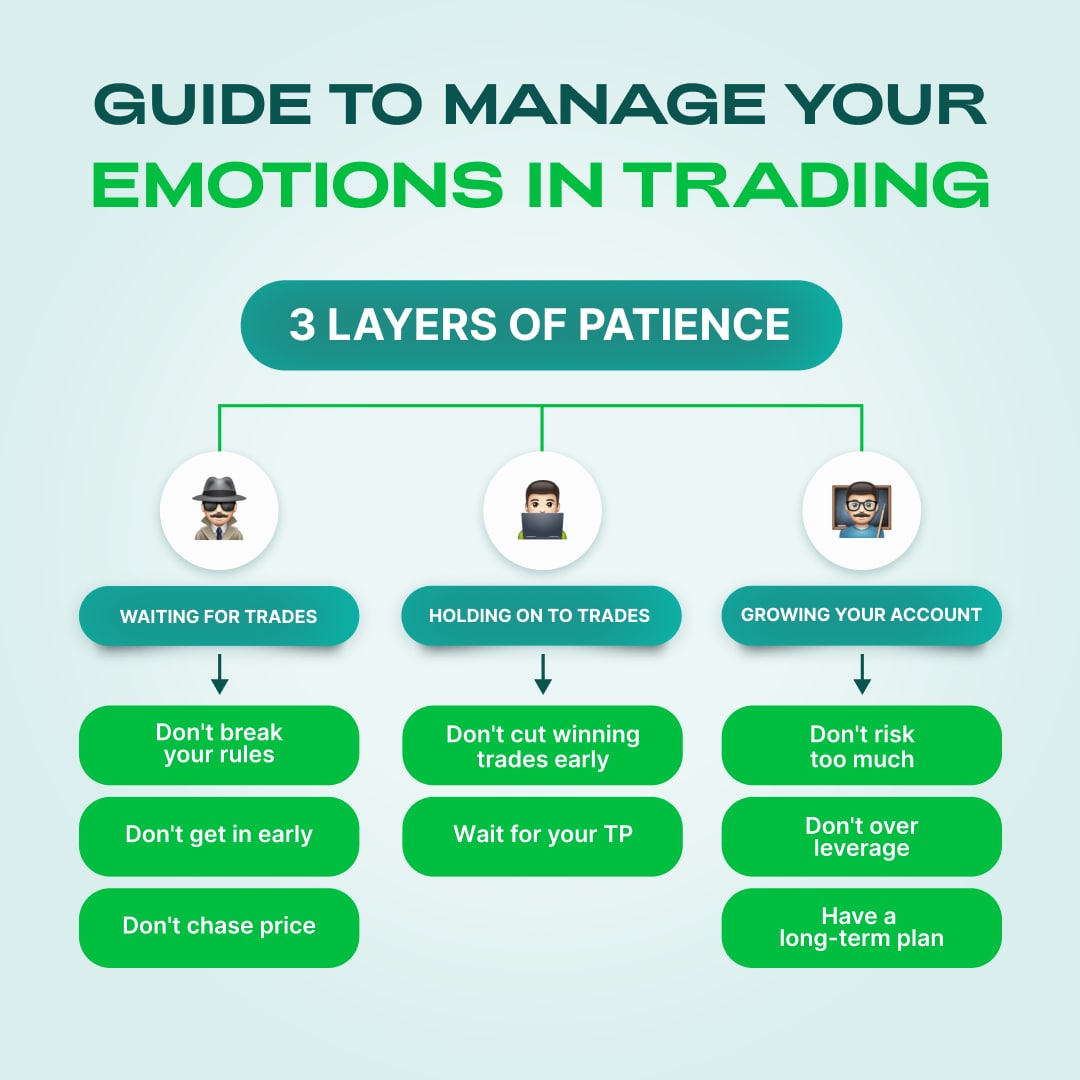
💭 There are three layers of patience that traders need to be aware of. Let’s talk about them!
1️⃣ First, while you’re waiting to enter the trade, remember: don’t break the rules you obeyed to follow to accomplish your order; don’t get into the trade too early, double check the trend confirmation! Don’t chase the price- it runs too fast to keep up with it.
2️⃣Then, when you hold on to your traders, don’t rush- if the price goes up, hold it to the max! At least wait for your Take Profit to work out.
3️⃣ Finally, in order to grow your account in general, try not to risk too much; don’t trade with too big leverage because, at one moment, you can win a lot and lose a lot at once; and the last, but not the least, have a long-term plan and stick to it as much as possible. Try to see everything in perspective and achieve your goal.
🔥 Don’t let your emotions disturb you from profitable trading!
Learn about trading psychology with FBS: https://fbs.com/analytics/guidebooks/traders-psychology-59?utm_source=telegram&utm_medium=smm&utm_campaign=fbsanalytics&utm_content=guidebook
💭 There are three layers of patience that traders need to be aware of. Let’s talk about them!
1️⃣ First, while you’re waiting to enter the trade, remember: don’t break the rules you obeyed to follow to accomplish your order; don’t get into the trade too early, double check the trend confirmation! Don’t chase the price- it runs too fast to keep up with it.
2️⃣Then, when you hold on to your traders, don’t rush- if the price goes up, hold it to the max! At least wait for your Take Profit to work out.
3️⃣ Finally, in order to grow your account in general, try not to risk too much; don’t trade with too big leverage because, at one moment, you can win a lot and lose a lot at once; and the last, but not the least, have a long-term plan and stick to it as much as possible. Try to see everything in perspective and achieve your goal.
🔥 Don’t let your emotions disturb you from profitable trading!
Learn about trading psychology with FBS: https://fbs.com/analytics/guidebooks/traders-psychology-59?utm_source=telegram&utm_medium=smm&utm_campaign=fbsanalytics&utm_content=guidebook
👍108❤45🔥12🥰7😁7👏6
#MarketNews
☀️Good day, FBS traders! Last week was full of significant events and we hope you've made some profit!
Here is news, which move the market right now!
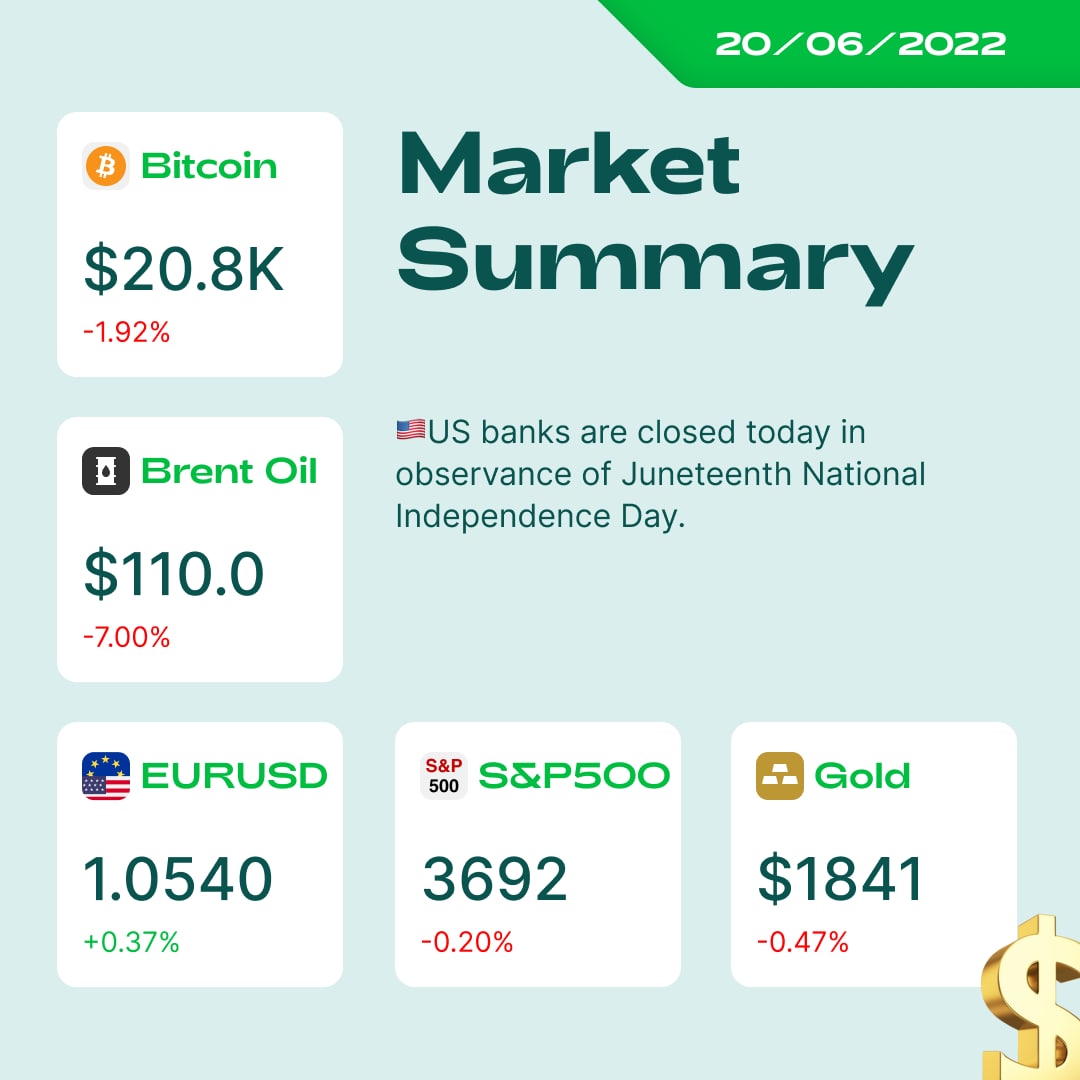
🇪🇺EU foreign ministers to discuss 7th package of sanctions against Russia today, including further energy measures.
☢️Analysts' forecasts do not look too optimistic: BTC may go below $14 000, and a bullish cycle should not be expected before the end of 2023.
🇨🇳Analysts believe that the growth of the Chinese economy in 2022 will be more than 4.0% against the projected 2.6% for the United States.
🥇XAUUSD is trading under the 200-day moving average. The price might decline to $1810 during this week.
🇪🇺🇺🇸EURUSD is flirting with the 50-period moving average. If the price gets rejected, it might decline to 1.046.
🤔What are you trading today?
☀️Good day, FBS traders! Last week was full of significant events and we hope you've made some profit!
Here is news, which move the market right now!
🇪🇺EU foreign ministers to discuss 7th package of sanctions against Russia today, including further energy measures.
☢️Analysts' forecasts do not look too optimistic: BTC may go below $14 000, and a bullish cycle should not be expected before the end of 2023.
🇨🇳Analysts believe that the growth of the Chinese economy in 2022 will be more than 4.0% against the projected 2.6% for the United States.
🥇XAUUSD is trading under the 200-day moving average. The price might decline to $1810 during this week.
🇪🇺🇺🇸EURUSD is flirting with the 50-period moving average. If the price gets rejected, it might decline to 1.046.
🤔What are you trading today?
👍42🔥10👏2
☢️#Bitcoin
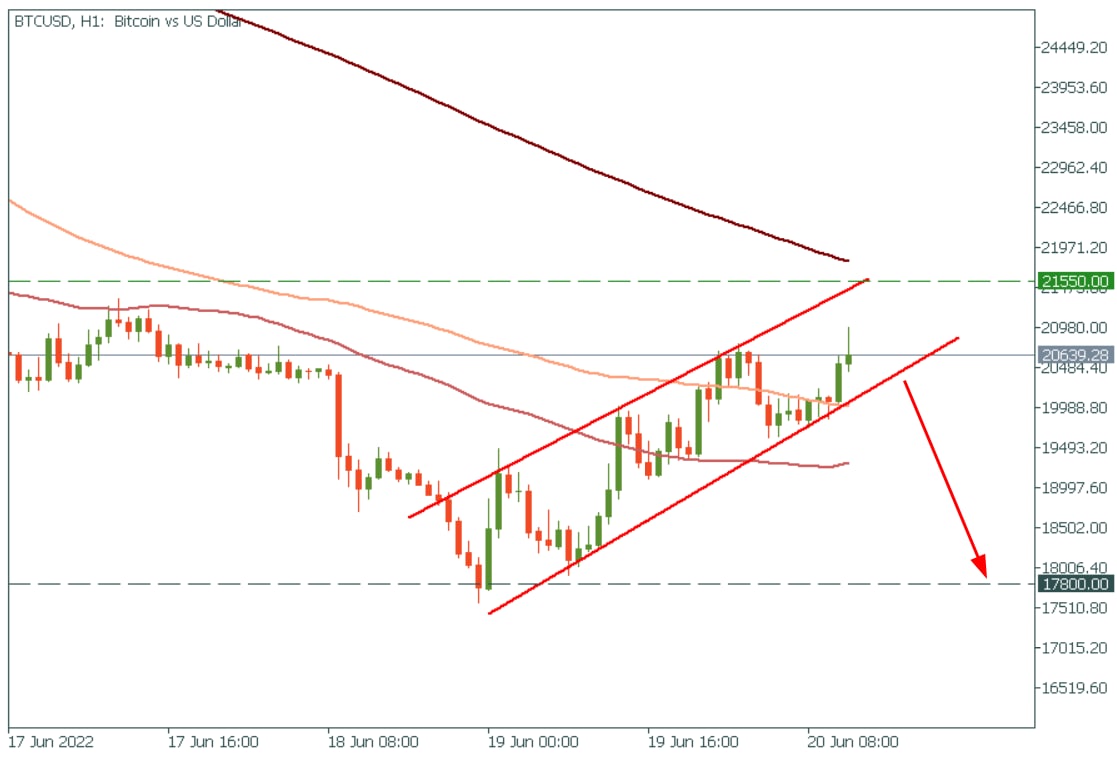
BTCUSD is moving in the rising channel. Traders might open a SELL trade when the price breaks through the lower channel's border.
Trade: SELL
Target: $17 800
Entry point: After the breakout
✅START TRADING✅
BTCUSD is moving in the rising channel. Traders might open a SELL trade when the price breaks through the lower channel's border.
Trade: SELL
Target: $17 800
Entry point: After the breakout
✅START TRADING✅
🔥31👍23👎6
🛢 #XBRUSD 💵
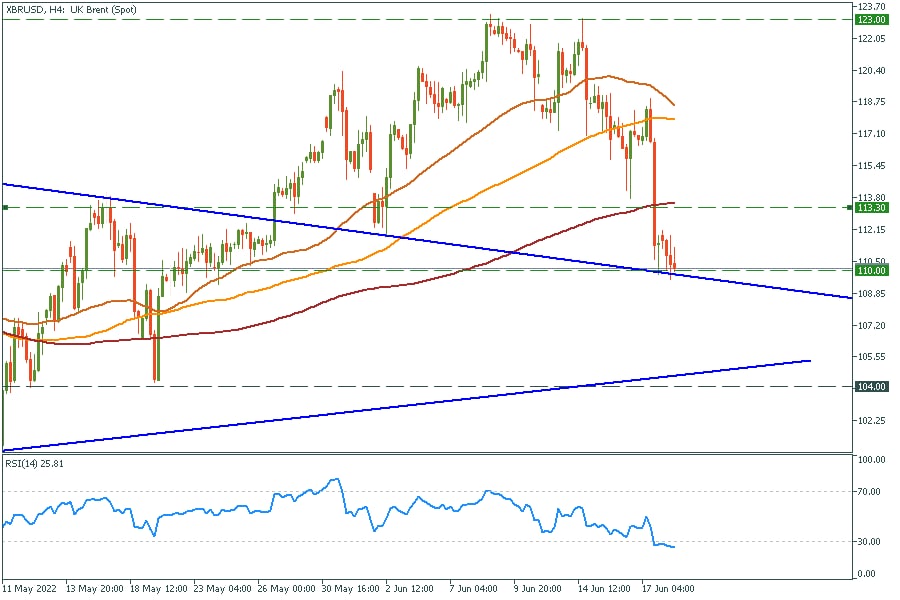
🗓 Earlier on our stream we gave a short signal for the oil market. Since that, XBRUSD has lost 7% and now it's time for the price to make the next move
👀 The Brent oil reached the trendline, and the RSI is in the oversold zone. As long as the price is above the support of $110.00, we may expect a bounce from this area
✅ Entry: $110.00-110.50
📈 Take profit: $113.00-113.30
📉 Stop loss: $108.90 and lower
Are you in the game?
🟩 START TRADING 🟩
🗓 Earlier on our stream we gave a short signal for the oil market. Since that, XBRUSD has lost 7% and now it's time for the price to make the next move
👀 The Brent oil reached the trendline, and the RSI is in the oversold zone. As long as the price is above the support of $110.00, we may expect a bounce from this area
✅ Entry: $110.00-110.50
📈 Take profit: $113.00-113.30
📉 Stop loss: $108.90 and lower
Are you in the game?
🟩 START TRADING 🟩
👍48❤7🔥6🥰3
🔥Last week was shocking!
The US dollar gained more than 2% against other currencies ahead of the 75-basis points rate hike by the Federal Reserve on Wednesday but dropped after the announcement. As a result, EURUSD bounced off the 1.0350 support and reached 1.0550 by Friday. The US stock market lost its global support. US500 plunged below 3800, while US100 broke through the 11 700 support level. The oil market has cooled down. XBRUSD plunged to 110.70 support, the 50-day moving average.
☺️Do you wonder what to trade this week?
Read the article and get the best trade ideas: https://bit.ly/3ObvQ9W
The US dollar gained more than 2% against other currencies ahead of the 75-basis points rate hike by the Federal Reserve on Wednesday but dropped after the announcement. As a result, EURUSD bounced off the 1.0350 support and reached 1.0550 by Friday. The US stock market lost its global support. US500 plunged below 3800, while US100 broke through the 11 700 support level. The oil market has cooled down. XBRUSD plunged to 110.70 support, the 50-day moving average.
☺️Do you wonder what to trade this week?
Read the article and get the best trade ideas: https://bit.ly/3ObvQ9W

👍39❤5👏2
#MarketNews
👋🏻Hello, our dear traders! The trading week is continuing and let’s see what we need to know by now:
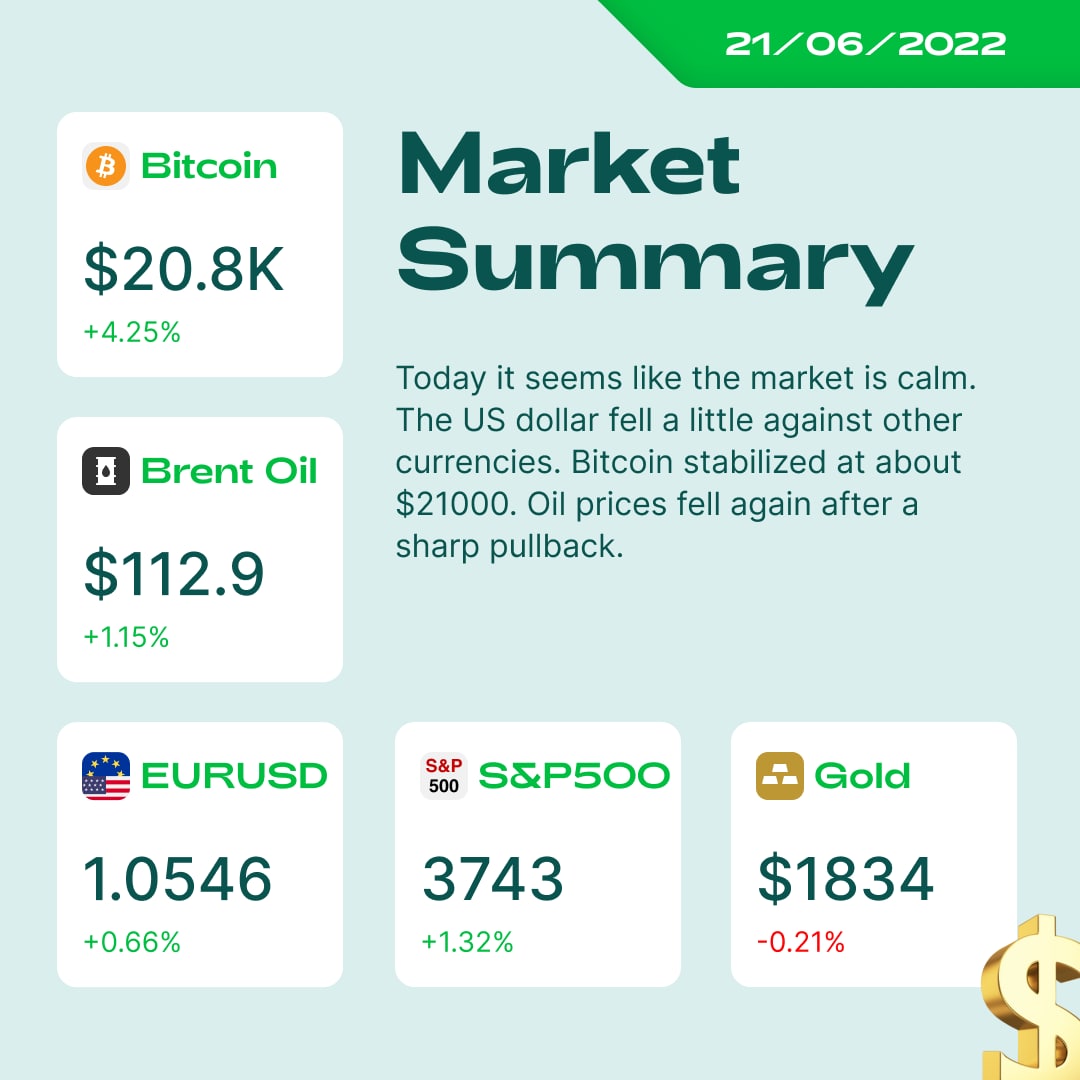
🛢Oil prices rose as traders weighed the chances of a recession in the US amid a tightening of the Federal Reserve, and President Joe Biden opposed the idea that the world's largest economy is in danger of recession. At the moment, XBRUSD is $112.
🇺🇸The US dollar index fell 0.59%, as well as EURUSD gained 0.68%.
🇯🇵The Japanese yen hovered near a 24-year low and remained under intense pressure as the BOJ stubbornly stuck to its ultra-dovish policy, even as all its developed-country counterparts took steps to tighten. USDJPY is above $135.
☢️Bitcoin held above $20,000 after a turbulent period for cryptocurrencies.
🇪🇺🇺🇦All EU countries supported the granting of candidate status to Ukraine. The decision will be announced at the summit on June 23-24.
🚗According to the report, Tesla will be banned from entering a resort town in China where the Communist Party's summer camp is being held.
Don’t miss:
15:30 CAD Core Retail Sales m/m
Have a profitable day!
👋🏻Hello, our dear traders! The trading week is continuing and let’s see what we need to know by now:
🛢Oil prices rose as traders weighed the chances of a recession in the US amid a tightening of the Federal Reserve, and President Joe Biden opposed the idea that the world's largest economy is in danger of recession. At the moment, XBRUSD is $112.
🇺🇸The US dollar index fell 0.59%, as well as EURUSD gained 0.68%.
🇯🇵The Japanese yen hovered near a 24-year low and remained under intense pressure as the BOJ stubbornly stuck to its ultra-dovish policy, even as all its developed-country counterparts took steps to tighten. USDJPY is above $135.
☢️Bitcoin held above $20,000 after a turbulent period for cryptocurrencies.
🇪🇺🇺🇦All EU countries supported the granting of candidate status to Ukraine. The decision will be announced at the summit on June 23-24.
🚗According to the report, Tesla will be banned from entering a resort town in China where the Communist Party's summer camp is being held.
Don’t miss:
15:30 CAD Core Retail Sales m/m
Have a profitable day!
👍30🔥3
🇪🇺🇺🇸#Interesting #EURUSD
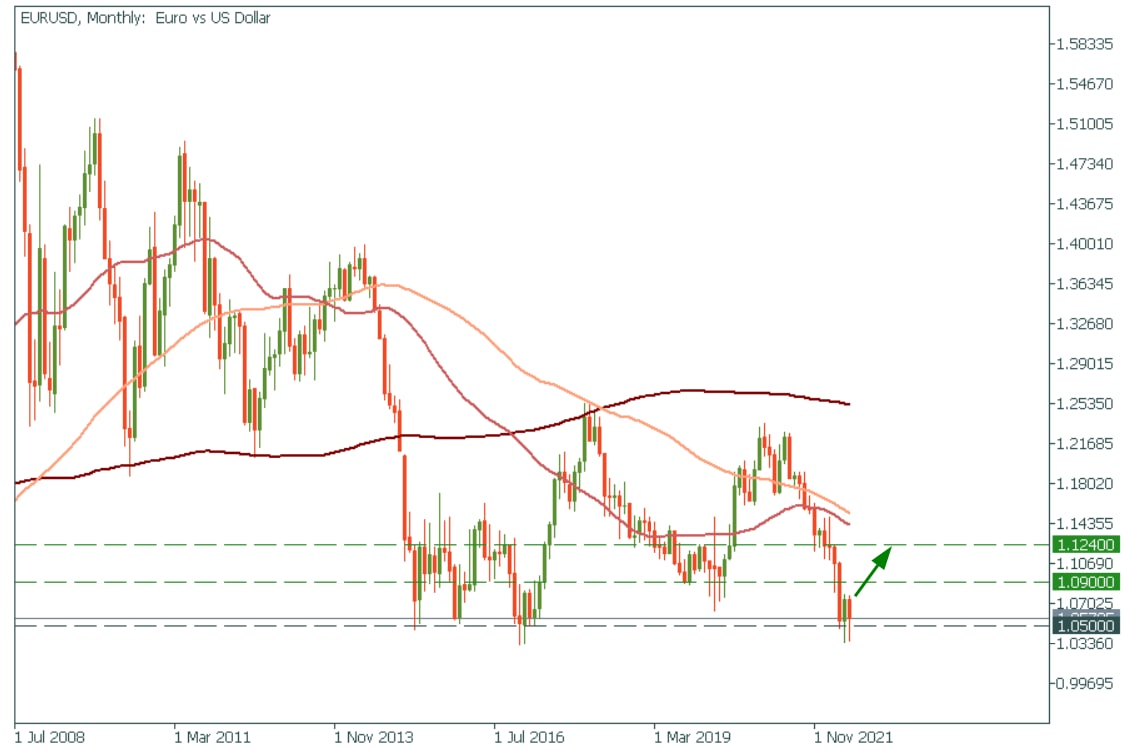
🔥EURUSD bounces off the 1.0550 support level on the monthly chart!
🤔Is Bear trend over?
🔥EURUSD bounces off the 1.0550 support level on the monthly chart!
🤔Is Bear trend over?
🔥26❤7👍6
🥇#GOLD
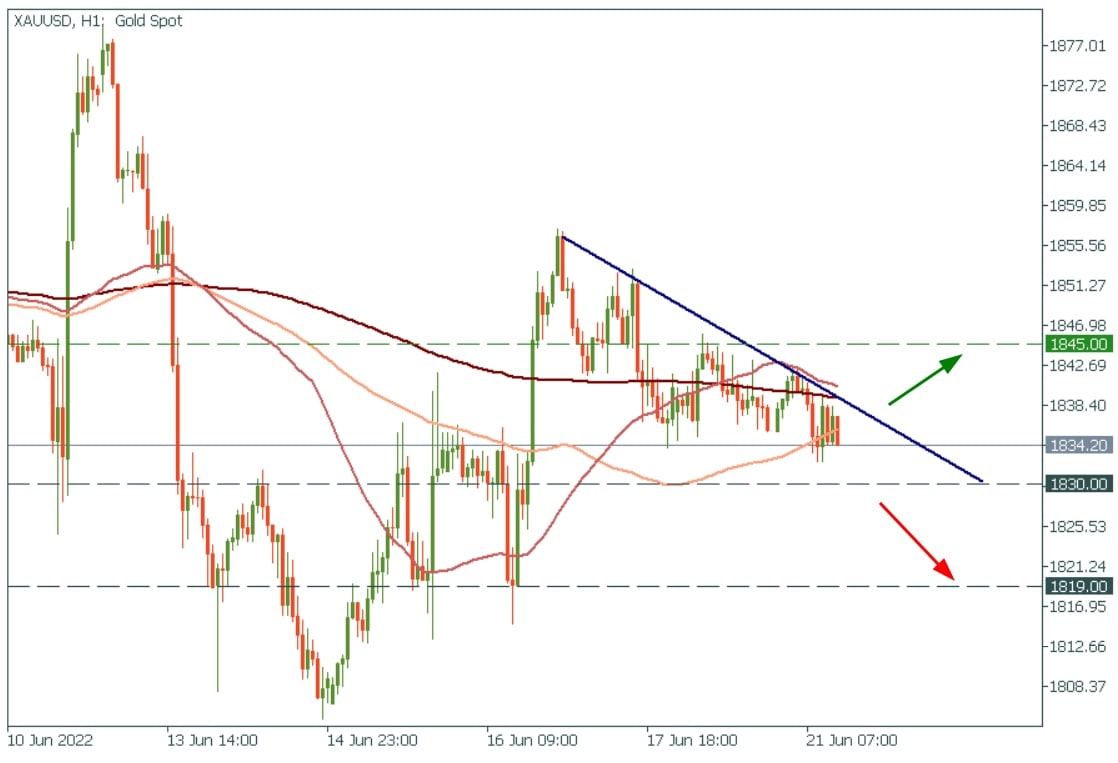
🔥Sellers are pressing XAUUSD to the $1830 support level!
🟢If the price breaks through the descending trend line, buy gold with the target at $1845!
🔴On the other hand. If the price breaks through $1830, sell gold with the target at $1820!
✅START TRADING✅
🔥Sellers are pressing XAUUSD to the $1830 support level!
🟢If the price breaks through the descending trend line, buy gold with the target at $1845!
🔴On the other hand. If the price breaks through $1830, sell gold with the target at $1820!
✅START TRADING✅
👍37🔥22
#Education
ABC of breakouts😎
How often do you notice an upcoming breakout? We’re sure that almost in every trade! Let’s talk about it today.✨
Breakout is a price movement outside a predefined support and resistance zone. Breakouts happen under certain market conditions, when asset price either rises above resistance or falls below support.
There are two main types of breakouts:
🟢True
Most times, when a price breaks a critical level, it goes on in this direction. If this rule works, it’s a real breakout. If you decide to follow the direction of a breakout, do it cautiously because you’re taking a high risk. Learn more about the peculiarities of trading a real breakout and manage risks before you decide on a trade.
🔴False
When after the break the price movement goes back to its previous state and fixes there, you deal with a false breakout. As practice shows, false breakouts can occur in the market often enough. If you trade false breakouts, the possibility of a good trade will increase if you trade in the direction of a trend.
Once you learn to determine the signs of the breakouts in the market, you’ll earn extra chances for potentially good trades. Find out how to trade breakouts.
How often do you trade breakout? ⬇️Answer the poll below!⬇️
ABC of breakouts😎
How often do you notice an upcoming breakout? We’re sure that almost in every trade! Let’s talk about it today.✨
Breakout is a price movement outside a predefined support and resistance zone. Breakouts happen under certain market conditions, when asset price either rises above resistance or falls below support.
There are two main types of breakouts:
🟢True
Most times, when a price breaks a critical level, it goes on in this direction. If this rule works, it’s a real breakout. If you decide to follow the direction of a breakout, do it cautiously because you’re taking a high risk. Learn more about the peculiarities of trading a real breakout and manage risks before you decide on a trade.
🔴False
When after the break the price movement goes back to its previous state and fixes there, you deal with a false breakout. As practice shows, false breakouts can occur in the market often enough. If you trade false breakouts, the possibility of a good trade will increase if you trade in the direction of a trend.
Once you learn to determine the signs of the breakouts in the market, you’ll earn extra chances for potentially good trades. Find out how to trade breakouts.
How often do you trade breakout? ⬇️Answer the poll below!⬇️

👍23🔥19😁1
How often do you trade breakout?
Anonymous Poll
37%
Always🤘🏻
34%
From time to time👌🏻
17%
Hardly ever🙌🏻
12%
That’s not for me☝🏻
👍19🥰12🔥6🤔5👎2
🇺🇸🇯🇵#USDJPY
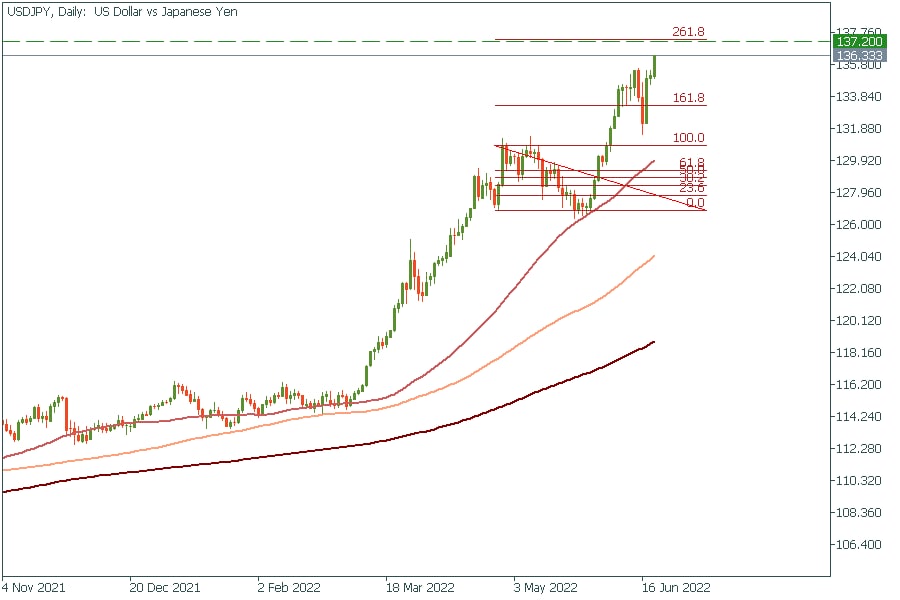
🔥Show must go on!
According to the Fibonacci Retracement, the next target for USDJPY is 137.20!
✅START TRADING✅
🔥Show must go on!
According to the Fibonacci Retracement, the next target for USDJPY is 137.20!
✅START TRADING✅
👍47🔥16❤8👏2