
🇨🇭🇪🇺🇺🇸🇯🇵#Interesting #USDJPY #EURCHF #USDCHF
🔥⚡️Something big is coming for the Swiss frank!
By comparing USDJPY and EURCHF monthly charts, we found out that the global bullish trend for CHF is about to finish. USDCHF also signals an upcoming global reversal!
Do you want to know what is going on first?
Hit 100 ❤️ under this post, and we will make an extensive outlook on these currency pairs!
🔥⚡️Something big is coming for the Swiss frank!
By comparing USDJPY and EURCHF monthly charts, we found out that the global bullish trend for CHF is about to finish. USDCHF also signals an upcoming global reversal!
Do you want to know what is going on first?
Hit 100 ❤️ under this post, and we will make an extensive outlook on these currency pairs!
❤205👍27🔥6
🇪🇺🇺🇸#Interesting #EURUSD
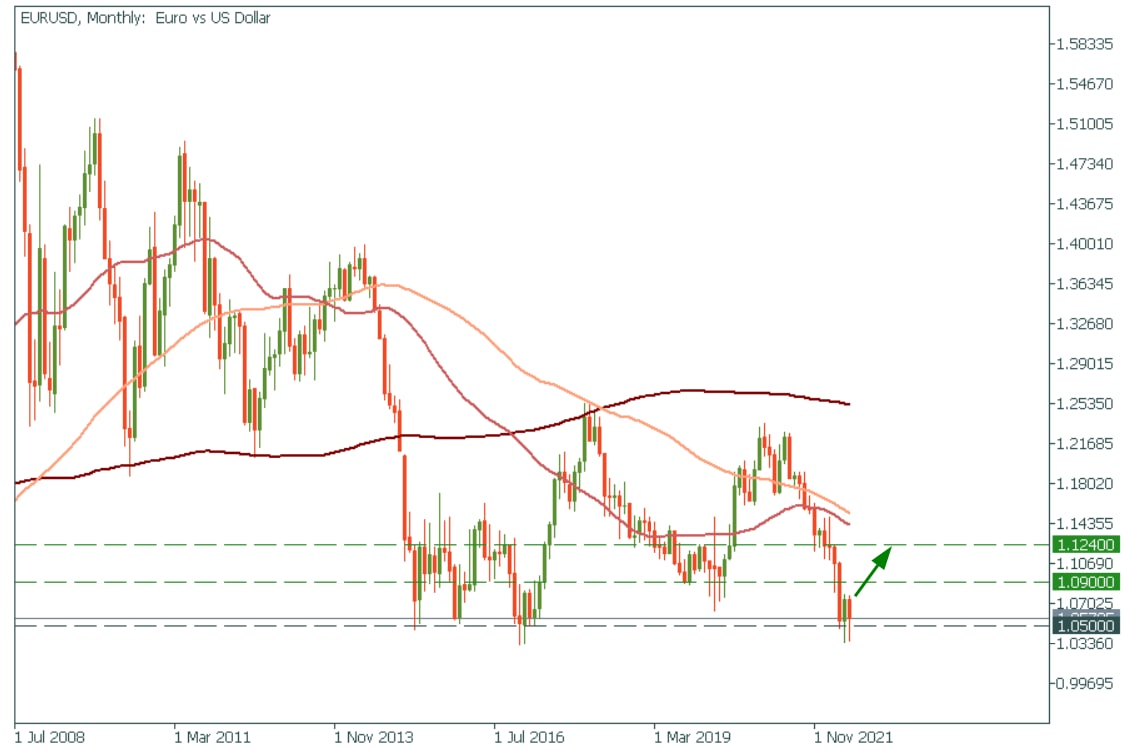
🔥EURUSD bounces off the 1.0550 support level on the monthly chart!
🤔Is Bear trend over?
🔥EURUSD bounces off the 1.0550 support level on the monthly chart!
🤔Is Bear trend over?
🔥26❤7👍6
🥇#XAUUSD #Interesting
🔥Gold reached the critical global resistance!
If you check the weekly timeframe, you can notice that the level of $1747 is extremely important! Both, buyers and sellers experience problems breaking through this level from the first try. The H4 timeframe also confirms its strengthens.
👆That's why we suggest you be very careful with buying XAUUSD right now. Gold will be bullish, if the H4 candle closes above 1748. Until then, traders should be looking for SELL opportunities!
🟩START TRADING🟩
🔥Gold reached the critical global resistance!
If you check the weekly timeframe, you can notice that the level of $1747 is extremely important! Both, buyers and sellers experience problems breaking through this level from the first try. The H4 timeframe also confirms its strengthens.
👆That's why we suggest you be very careful with buying XAUUSD right now. Gold will be bullish, if the H4 candle closes above 1748. Until then, traders should be looking for SELL opportunities!
🟩START TRADING🟩
👍53🔥9❤6👏3
🇺🇸#USD #Interesting
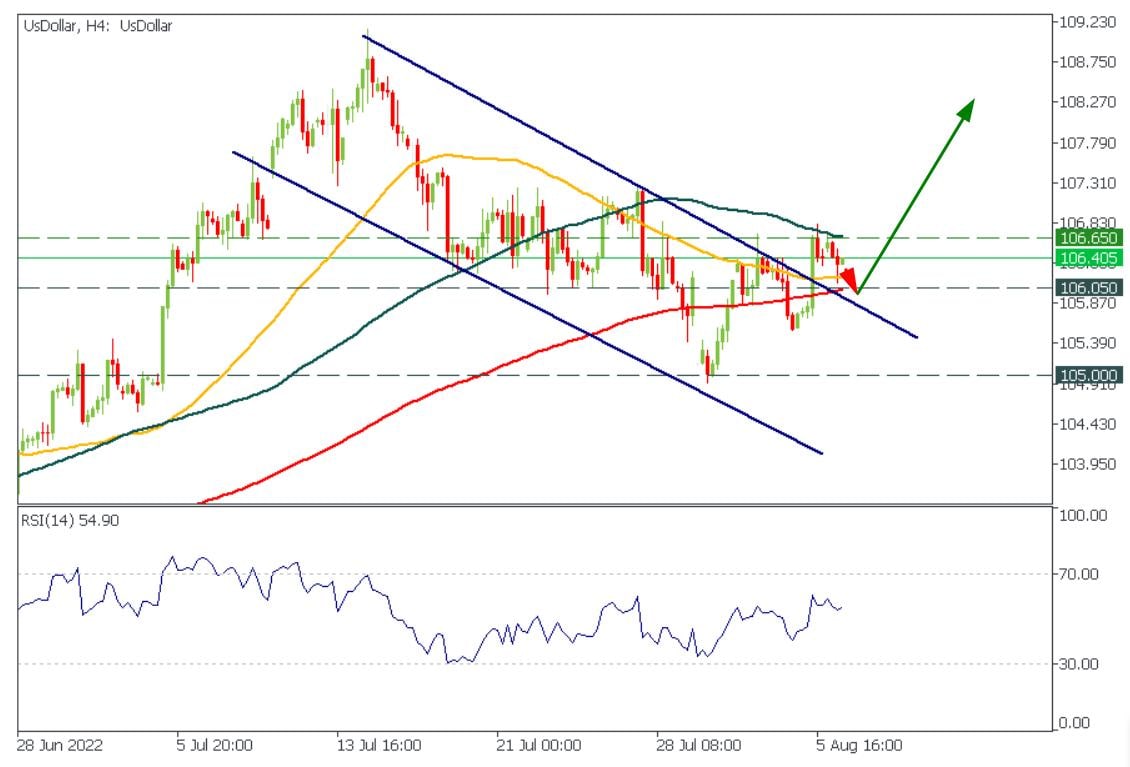
🔥The US dollar is getting ready for a pump!
On Friday, the US dollar index (DXY) broke through the upper border of the bullish flag, and today the price retested the breakout!
It means that during this week, we might see a significant plunge in EURUSD, XAUUSD, and GBPUSD.
On the other hand, USDJPY might work the best for bulls!
Key levels for the US dollar index:
Support - 106.05
Resistance - 106.65
Which pair should we look at closely? Write in the comments!
🔥The US dollar is getting ready for a pump!
On Friday, the US dollar index (DXY) broke through the upper border of the bullish flag, and today the price retested the breakout!
It means that during this week, we might see a significant plunge in EURUSD, XAUUSD, and GBPUSD.
On the other hand, USDJPY might work the best for bulls!
Key levels for the US dollar index:
Support - 106.05
Resistance - 106.65
Which pair should we look at closely? Write in the comments!
🔥20👍9👏2
🇺🇸📈#Stocks #USD #XAUUSD #Interesting
🔥💥The US stock market might stay under pressure, and the US dollar can increase further.
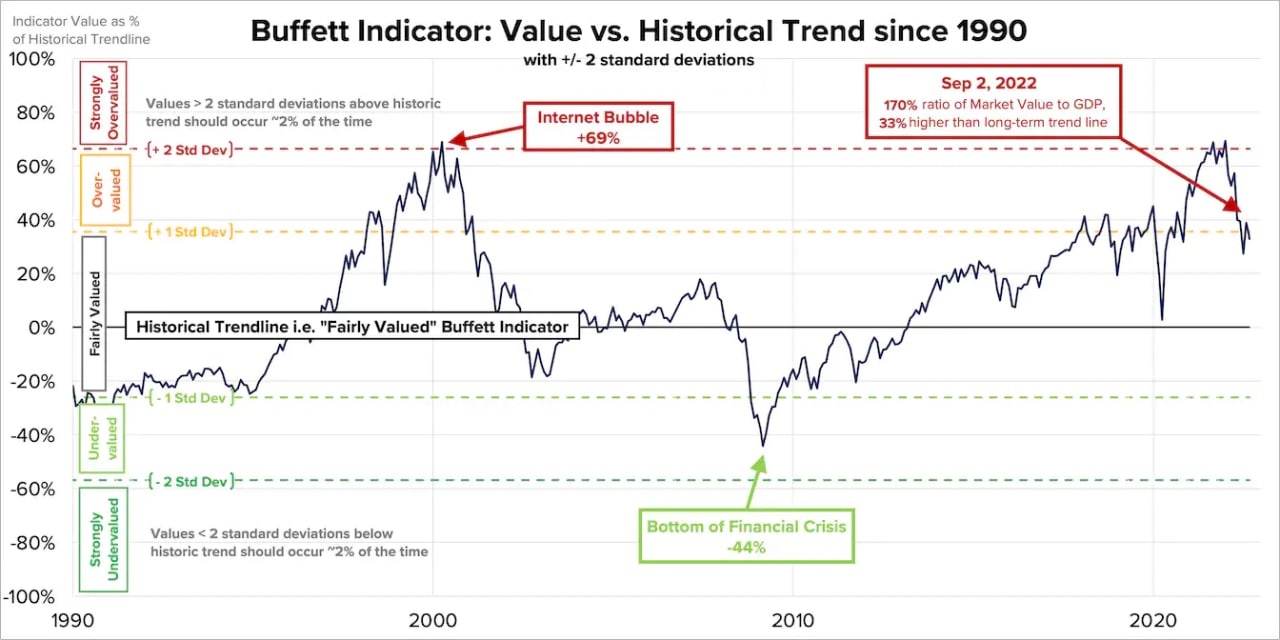
👆The Buffett Indicator is the total United States stock market valuation ratio to GDP. As of September 2, 2022, we calculate the Buffett Indicator as:
Aggregate US Market Value: $42.5T
Annualized GDP: $25.0T
Buffett Indicator: $42.5T ÷ $25.0T = 170%
The actual result is 33% higher than the long-term trend! Usually, market reverse inside the +10% - -20% range. Thus, this bear market can bring US500 to at least 3000 and US100 to 9000.
💚 START TRADING 💚
🔥💥The US stock market might stay under pressure, and the US dollar can increase further.
👆The Buffett Indicator is the total United States stock market valuation ratio to GDP. As of September 2, 2022, we calculate the Buffett Indicator as:
Aggregate US Market Value: $42.5T
Annualized GDP: $25.0T
Buffett Indicator: $42.5T ÷ $25.0T = 170%
The actual result is 33% higher than the long-term trend! Usually, market reverse inside the +10% - -20% range. Thus, this bear market can bring US500 to at least 3000 and US100 to 9000.
💚 START TRADING 💚
👍24🔥14😁2