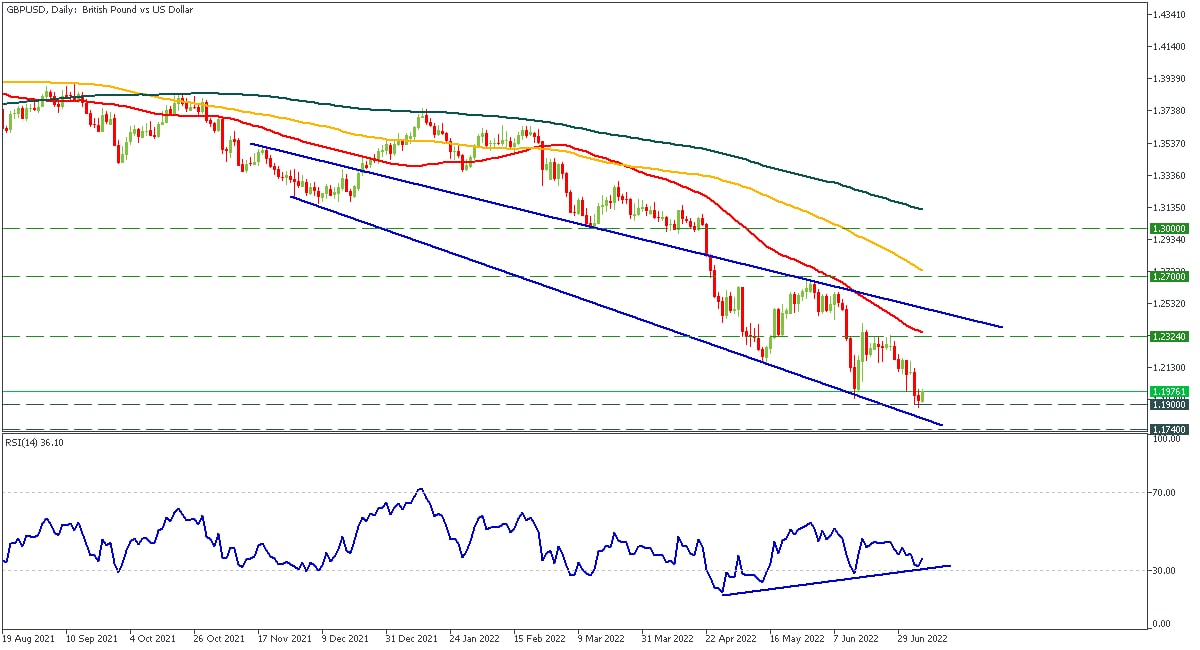
🇬🇧 #GBPUSD 🇺🇸
📈 The pair made a double divergence on the RSI. Also, we are close to the support trendline.
🚀 Our outlook on the British pound is bullish. The currency may rise to the 1.2324 resistance. Moreover, it may go even higher if the market feels positive on Boris Jonson resignation.
🤔Are you bullish on the GBP?
🟩 START TRADING 🟩
📈 The pair made a double divergence on the RSI. Also, we are close to the support trendline.
🚀 Our outlook on the British pound is bullish. The currency may rise to the 1.2324 resistance. Moreover, it may go even higher if the market feels positive on Boris Jonson resignation.
🤔Are you bullish on the GBP?
🟩 START TRADING 🟩
😍31👍16🔥12🤔11🥰2👏1
#Education
ABC of Economic Calendar🎓
Hello, traders! It’s time for our educational section! Today, let’s have a look at the economic calendar.
📆For each date, you can see a list of scheduled economic releases related to one of the major Forex currencies. Pay attention to the release time – set it for your time zone. You can see that all events have different impact: the higher this impact is, the stronger move of the market is expected, so you can focus on the most important events.
▪️Most news in the calendar represents economic indicators and have numerical values. The previous reading is seen in advance. The forecast is the median forecast of 20-240 economists surveyed by big agencies like Bloomberg, Reuters, etc. The actual reading is published by the official source (the nation’s statistics agency or an analytical center).
▪️For most indicators, if the actual reading is higher than the forecast one, it’s positive for the currency in question. Unemployment indicators are the exception: for them the lower the reading, the better for the currency.
How to use Calendar in your trading?
▪️By the way, there are different ways to use the economic calendar. Some market players trade “the news". It means that traders open positions in accordance with their expectations for a change in economic indicators (for example, eurozone GDP is expected to improve – they buy the euro). Others, on the contrary, avoid the news as trading them is associated with risks of too rapid price movements. Such traders prefer to wait until the market “digests” the news and enter the already shaped trend.
▪️No matter what strategy you choose, we strongly recommend you follow the news in order to be aware of the market moving impulses. Some data releases increase volatility and cause sudden moves on the market. The best example is the US nonfarm payrolls (NFP). The release of this indicator may lead to the unexpected closure of your position under a stop-loss order.
❓Do you follow economic news? Share in the comments! ⬇️
ABC of Economic Calendar🎓
Hello, traders! It’s time for our educational section! Today, let’s have a look at the economic calendar.
📆For each date, you can see a list of scheduled economic releases related to one of the major Forex currencies. Pay attention to the release time – set it for your time zone. You can see that all events have different impact: the higher this impact is, the stronger move of the market is expected, so you can focus on the most important events.
▪️Most news in the calendar represents economic indicators and have numerical values. The previous reading is seen in advance. The forecast is the median forecast of 20-240 economists surveyed by big agencies like Bloomberg, Reuters, etc. The actual reading is published by the official source (the nation’s statistics agency or an analytical center).
▪️For most indicators, if the actual reading is higher than the forecast one, it’s positive for the currency in question. Unemployment indicators are the exception: for them the lower the reading, the better for the currency.
How to use Calendar in your trading?
▪️By the way, there are different ways to use the economic calendar. Some market players trade “the news". It means that traders open positions in accordance with their expectations for a change in economic indicators (for example, eurozone GDP is expected to improve – they buy the euro). Others, on the contrary, avoid the news as trading them is associated with risks of too rapid price movements. Such traders prefer to wait until the market “digests” the news and enter the already shaped trend.
▪️No matter what strategy you choose, we strongly recommend you follow the news in order to be aware of the market moving impulses. Some data releases increase volatility and cause sudden moves on the market. The best example is the US nonfarm payrolls (NFP). The release of this indicator may lead to the unexpected closure of your position under a stop-loss order.
❓Do you follow economic news? Share in the comments! ⬇️

👍53❤9🔥5👏4
☢️#BTCUSD
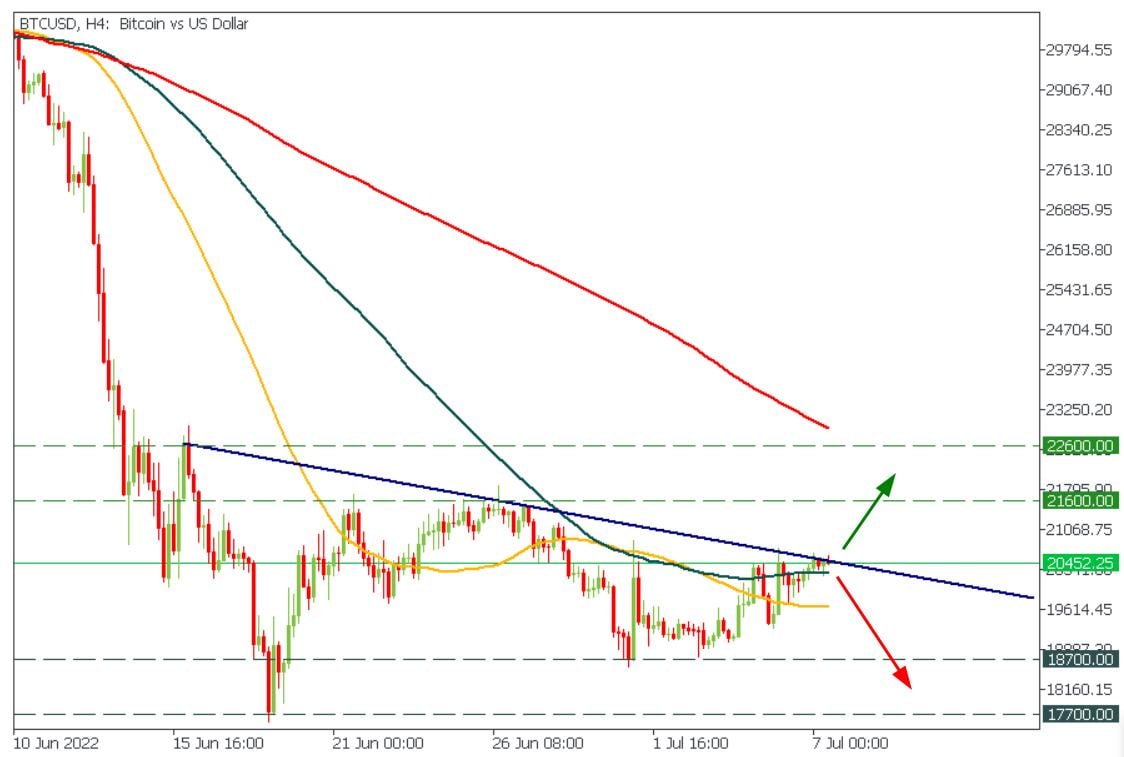
🔥Bitcoin has reached the descending trendline!
The breakout will open the way up to $21 600 and and $22 600.
On the other hand, if the breakout doesn't happen, the price will plunge to $18 700 and $17 700.
🟩 START TRADING 🟩
🔥Bitcoin has reached the descending trendline!
The breakout will open the way up to $21 600 and and $22 600.
On the other hand, if the breakout doesn't happen, the price will plunge to $18 700 and $17 700.
🟩 START TRADING 🟩
👍17🔥11🥰1
👋Hello, traders!
😎Be ready for this week’s indicator. We’ll talk about a momentum indicator!
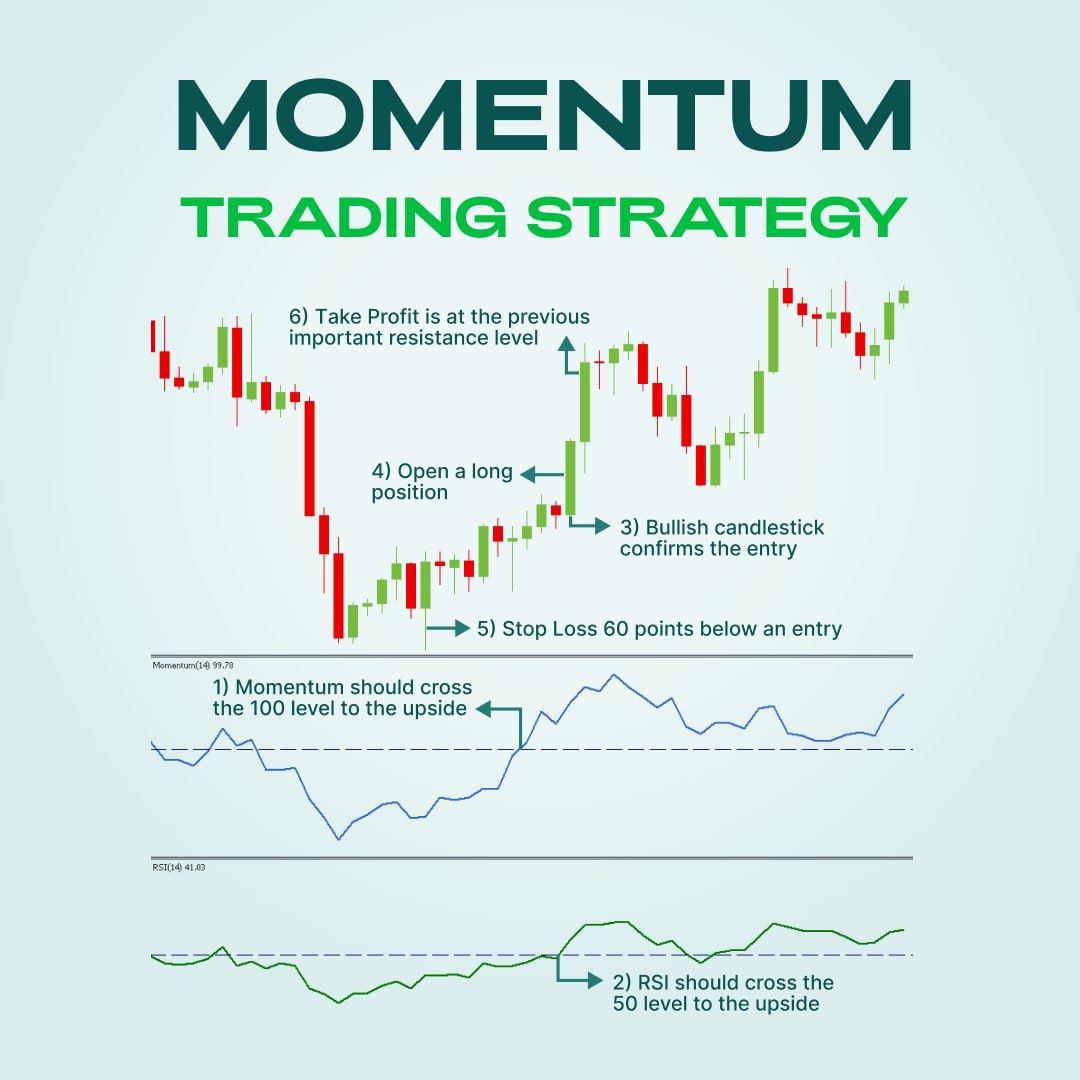
The Momentum technical indicator measures the amount that an asset’s price has changed over a given period of time. The indicator’s formula compares the most recent closing price to a previous closing price. If Momentum reaches extremely high or low values (relative to its historical values), the odds are that the current uptrend/down will continue. Extreme levels of the indicator mean that there’s enough momentum behind a trend to keep the price going.
Even though Momentum is an useful tool by itself, it’s better to use it in combination with other instruments. Let’s see the example of a trading strategy – Momentum and RSI combination. It’s better to use H4 timeframe for that.
✅First, notice the moment when Momentum crosses the 100 level to the upside.
✅At the same time, RSI should cross the 50 level to the upside.
✅Next, see how a Bullish candlestick confirms the entry.
✅So, it’s time to open a long position. Don’t forget to set Stop Loss 60 points below the entry.
✅Finally, your target is the previous important resistance level. Set Take profit there.
🕊We hope that the indicator will help you to gain the maximum profit!
Read more: https://bit.ly/3yEM0Cn
😎Be ready for this week’s indicator. We’ll talk about a momentum indicator!
The Momentum technical indicator measures the amount that an asset’s price has changed over a given period of time. The indicator’s formula compares the most recent closing price to a previous closing price. If Momentum reaches extremely high or low values (relative to its historical values), the odds are that the current uptrend/down will continue. Extreme levels of the indicator mean that there’s enough momentum behind a trend to keep the price going.
Even though Momentum is an useful tool by itself, it’s better to use it in combination with other instruments. Let’s see the example of a trading strategy – Momentum and RSI combination. It’s better to use H4 timeframe for that.
✅First, notice the moment when Momentum crosses the 100 level to the upside.
✅At the same time, RSI should cross the 50 level to the upside.
✅Next, see how a Bullish candlestick confirms the entry.
✅So, it’s time to open a long position. Don’t forget to set Stop Loss 60 points below the entry.
✅Finally, your target is the previous important resistance level. Set Take profit there.
🕊We hope that the indicator will help you to gain the maximum profit!
Read more: https://bit.ly/3yEM0Cn
👍57❤15🔥12👏6🤯1
FBS Analytics
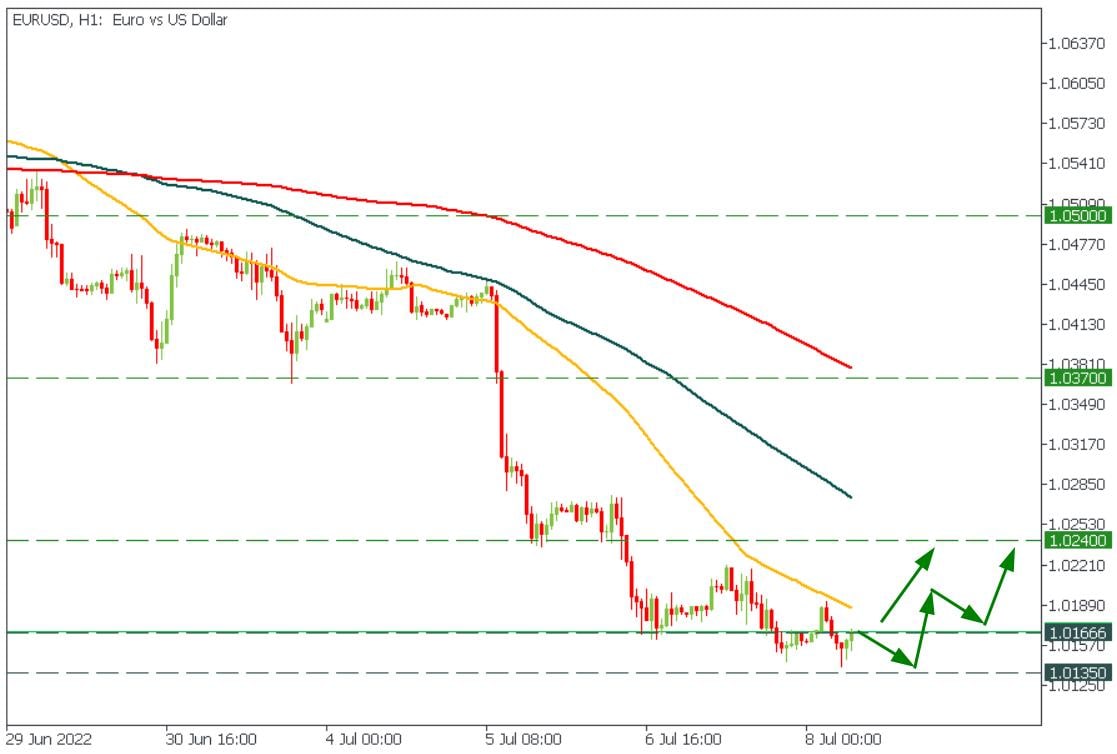
🇪🇺🇺🇸#EURUSD 🔥Nice and soft reversal is coming in EURUSD! 🎯The target is 1.0240! 🟩 START TRADING 🟩
Fails always happen. We will come back with better ideas next time🙌
👍64👎19❤12😁12😢11👏3😱3
NFP is back!🤩
The US will announce average hourly earnings, nonfarm employment change (NFP), and the unemployment rate on July 8, at 15:30 MT time.
NFP is traders’ favorite economic event, as the market reacts brightly in it every time. This time the data is published against the backdrop of recession fears, so it’s interesting to see how the labour market behaves in this case.
❗️If NFP is higher than expected, the USD will rise.
❕If NFP is lower than expected, the USD will fall.
The unemployment rate situation is the opposite: the lower the indicator, the better for the US currency.
Don’t forget about GOLD! It will move as well.
🔥Join our stream to trade together on NFP! Good luck!
🟩 https://youtu.be/SJSOnYAJ6ks 🟩
The US will announce average hourly earnings, nonfarm employment change (NFP), and the unemployment rate on July 8, at 15:30 MT time.
NFP is traders’ favorite economic event, as the market reacts brightly in it every time. This time the data is published against the backdrop of recession fears, so it’s interesting to see how the labour market behaves in this case.
❗️If NFP is higher than expected, the USD will rise.
❕If NFP is lower than expected, the USD will fall.
The unemployment rate situation is the opposite: the lower the indicator, the better for the US currency.
Don’t forget about GOLD! It will move as well.
🔥Join our stream to trade together on NFP! Good luck!
🟩 https://youtu.be/SJSOnYAJ6ks 🟩
👍34🐳8❤4🥰3
🇺🇸 #USDCHF 🇨🇭
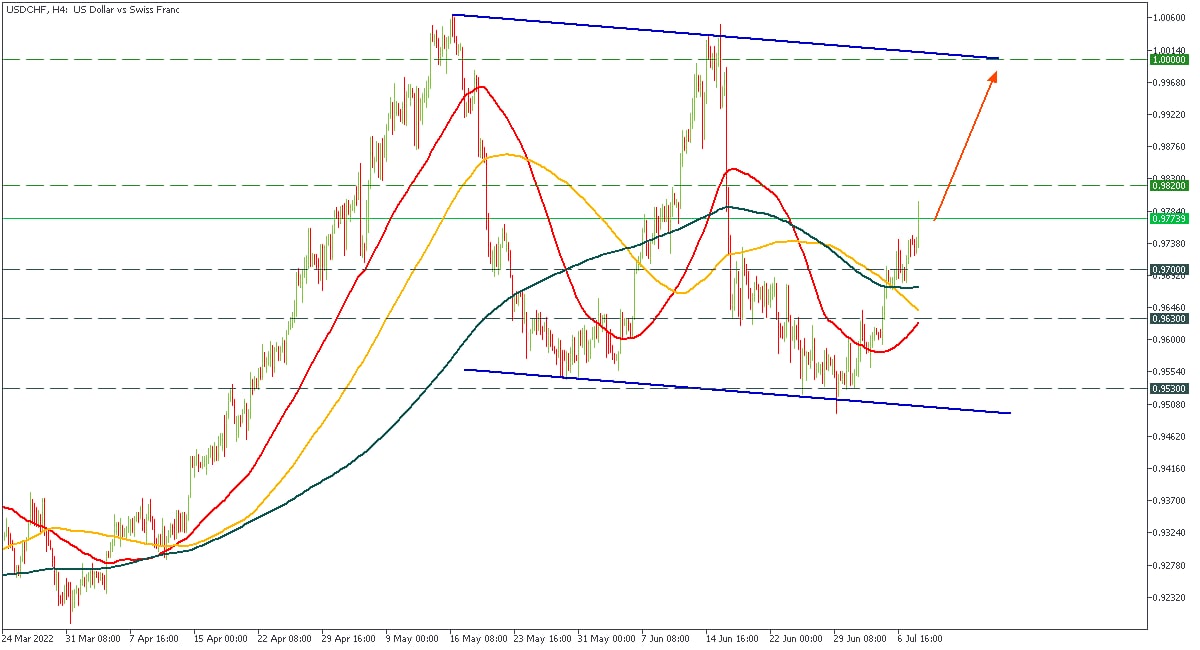
🎯 Is it possible for the pair to make another bullish movement without any pullbacks? We don't think so 🤷🏽♂️
🚀 Still, we may see a touch of the 1.0000 line, sooner or later
💭 Are you in the game?
🟩 START TRADING 🟩
🎯 Is it possible for the pair to make another bullish movement without any pullbacks? We don't think so 🤷🏽♂️
🚀 Still, we may see a touch of the 1.0000 line, sooner or later
💭 Are you in the game?
🟩 START TRADING 🟩
💯30👍21❤3🤔2
⚡️#EconomicCalendar
🔥 Nonfarm Payrolls (NFP)
Actual: 372К
Forecast: 260K
Previous: 390K
🔥 Unemployment rate
Actual: 3.6%
Forecast 3.6%
Previous 3.6%
🔥 Average Hourly Earnings
Actual:0.3%
Forecast 0.3%
Previous 0.3%
It's time to trade the USD and Gold!
👀Buy or sell? The answer is on the stream!
https://www.youtube.com/watch?v=SJSOnYAJ6ks
➡️TRADE NOW⬅️
🔥 Nonfarm Payrolls (NFP)
Actual: 372К
Forecast: 260K
Previous: 390K
🔥 Unemployment rate
Actual: 3.6%
Forecast 3.6%
Previous 3.6%
🔥 Average Hourly Earnings
Actual:0.3%
Forecast 0.3%
Previous 0.3%
It's time to trade the USD and Gold!
👀Buy or sell? The answer is on the stream!
https://www.youtube.com/watch?v=SJSOnYAJ6ks
➡️TRADE NOW⬅️
👍44🔥5🐳5❤4👏3🤯1
🇪🇺🇺🇸#EURUSD
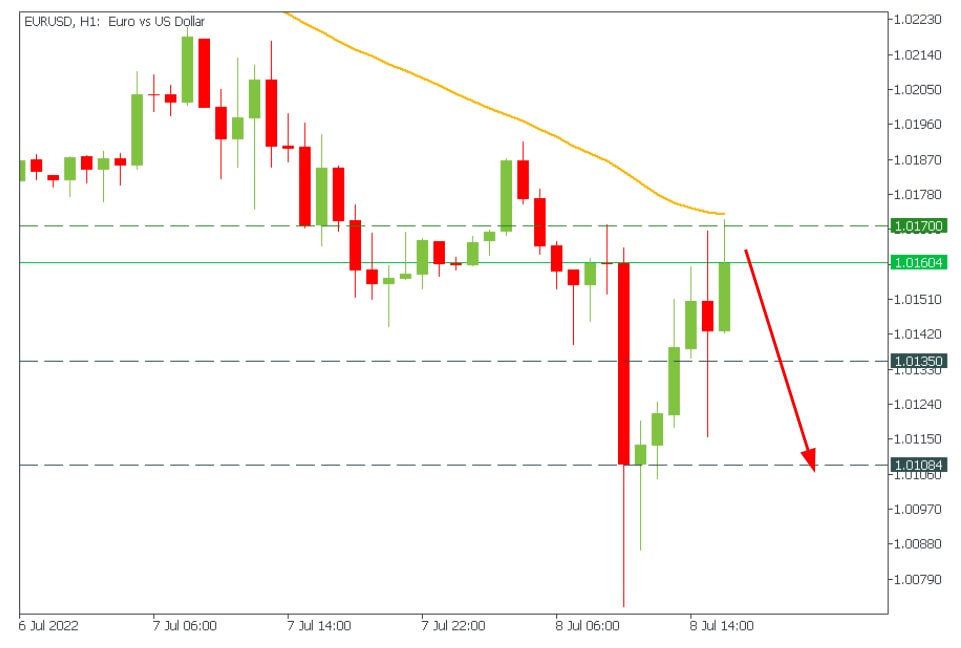
🔥It looks like buyers can't break through the 50-hour moving average!
We expect a decline!
🟩 START TRADING 🟩
🔥It looks like buyers can't break through the 50-hour moving average!
We expect a decline!
🟩 START TRADING 🟩
🔥31👍17👎11🎉5👏3😁3❤2
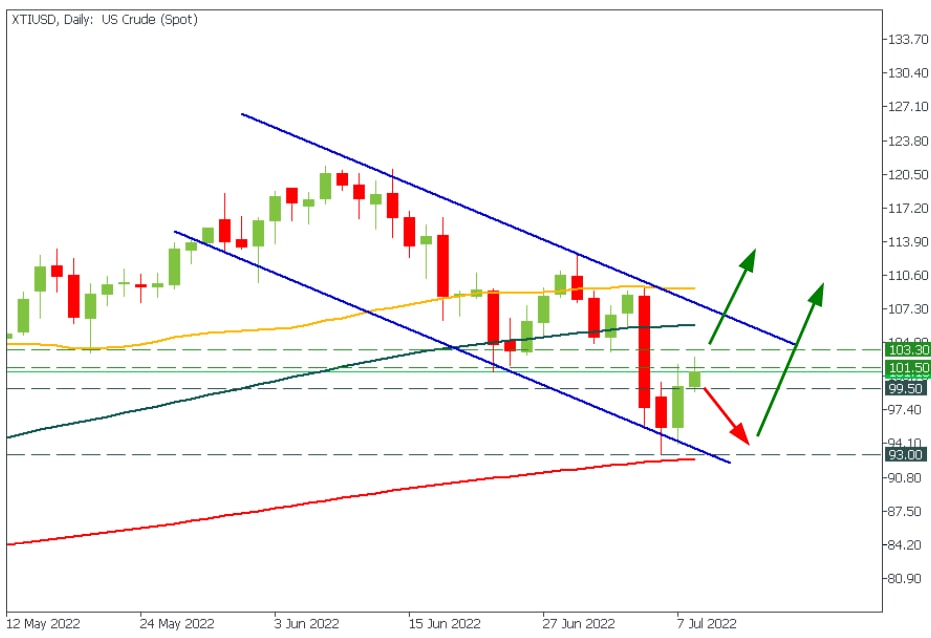
FBS Analytics
🇺🇸🇨🇦#USDCAD 🔥USDCAD also hit the target and reversed down - click! We are waiting for the strong downward impulse in this currency pair! 🟩 START TRADING 🟩
Gold mine right now! Bears are going to get some 💸
👍46🔥15❤7👎1
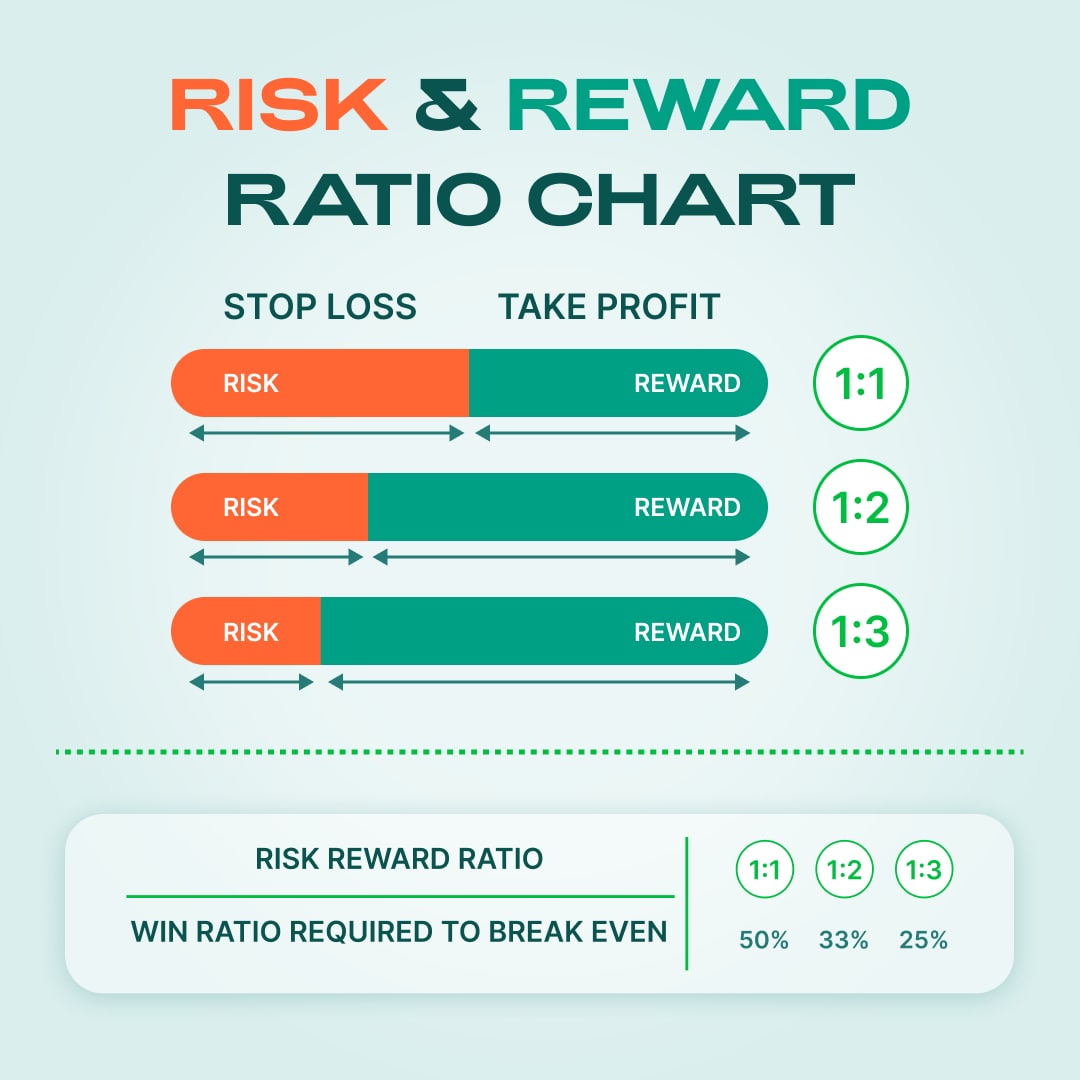
😱Risk to reward ratio!
❗️A risk to reward ratio is the amount of profit you plan to get on a position relative to what you are risking in case of a loss. Thus, if your Stop Loss equals to 10 points and your Take Profit is 30 points, your risk/reward ratio is 1:3.
🕊In order to increase your chances of getting profit, we recommend you to always have bigger reward than risk. The bigger the possible rewards, the more failed trades your account can withstand.
The risk/reward ratio to choose depends on your trading style and market conditions. There’s no universal solution here. We suggest keeping the reward higher than the risk for most trades. When trading in trend, risk/reward ratios can be 1:2 or 1:3. When trading in a range, 1:1 may be suitable.
Read more in this article: https://bit.ly/3yl1z1F
❗️A risk to reward ratio is the amount of profit you plan to get on a position relative to what you are risking in case of a loss. Thus, if your Stop Loss equals to 10 points and your Take Profit is 30 points, your risk/reward ratio is 1:3.
🕊In order to increase your chances of getting profit, we recommend you to always have bigger reward than risk. The bigger the possible rewards, the more failed trades your account can withstand.
The risk/reward ratio to choose depends on your trading style and market conditions. There’s no universal solution here. We suggest keeping the reward higher than the risk for most trades. When trading in trend, risk/reward ratios can be 1:2 or 1:3. When trading in a range, 1:1 may be suitable.
Read more in this article: https://bit.ly/3yl1z1F
👍116❤21🔥13🥰6😁4💩3

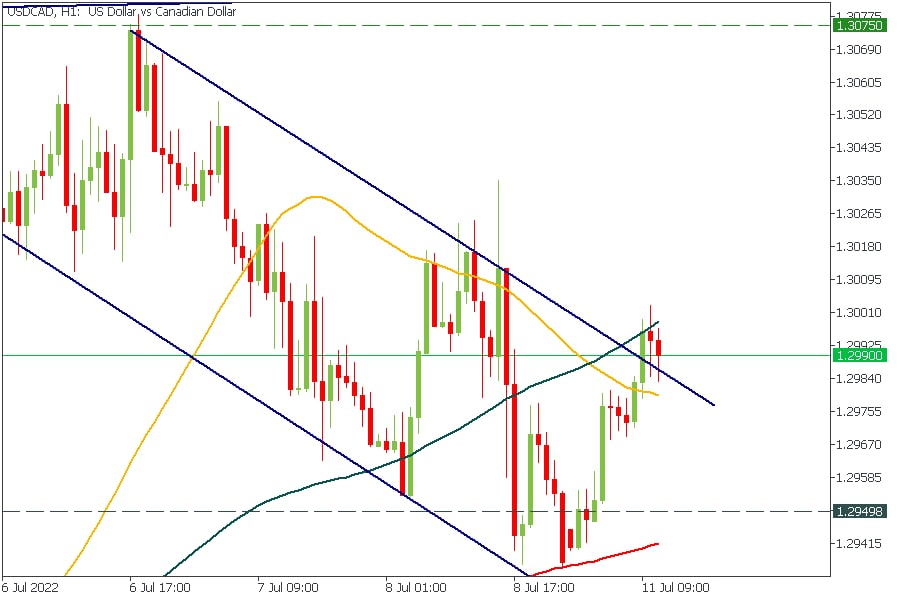
🇺🇸🇨🇦#USDCAD
👆USDCAD breaks through the upper border of the descending channel! At the moment the price is consolidating after the breakout! Good buy opportunity!
🟩 START TRADING 🟩
👆USDCAD breaks through the upper border of the descending channel! At the moment the price is consolidating after the breakout! Good buy opportunity!
🟩 START TRADING 🟩
❤18👍11🔥8🙏2
🔥Don't miss this earnings season, it's a great chance to profit on huge swings in price!
We prepared several trade ideas that you should definitely pay attention to, check the article to get the most 👀
🔽
https://bit.ly/3yzdCbE
🔼
We prepared several trade ideas that you should definitely pay attention to, check the article to get the most 👀
🔽
https://bit.ly/3yzdCbE
🔼

👍25❤8🔥5👌3👎1
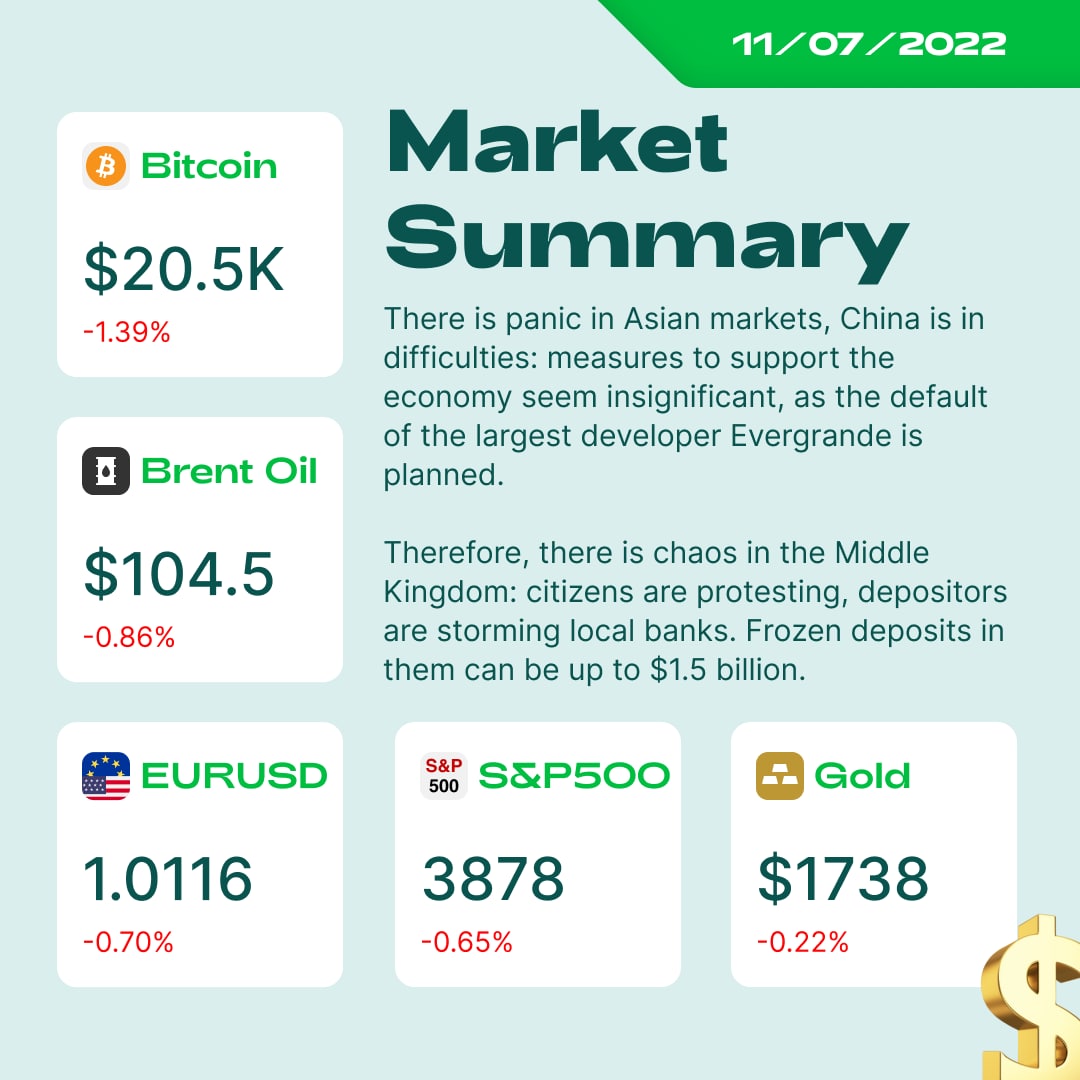
#MarketNews
🎉Hello, traders! Let’s see what’s on the market.
🇨🇳Wuhan has again become the center of the epidemic. The Chinese sounded the alarm: they do not understand where cholera came from. Mass disinfection began in the city.
🇯🇵The head of the Central Bank of Japan: the uncertainty in the economy is growing, it is necessary to continue with stimulating monetary policy. The Central Bank is ready to increase incentives if necessary.
🇩🇪🇪🇺According to Bloomberg economists, Eurozone recession risk rises from 30% to 45%: Germany, one of the most vulnerable members of the currency bloc, could face a recession with a 55% chance.
🇺🇸🏦Major US banks intend to report significant income from lending in connection with the increase in interest rates by the Fed.
🇫🇷French Ministry of Finance: Most likely, Russia will cut off gas supplies to Europe in response to EU sanctions.
☀️Have a great trading week!
🎉Hello, traders! Let’s see what’s on the market.
🇨🇳Wuhan has again become the center of the epidemic. The Chinese sounded the alarm: they do not understand where cholera came from. Mass disinfection began in the city.
🇯🇵The head of the Central Bank of Japan: the uncertainty in the economy is growing, it is necessary to continue with stimulating monetary policy. The Central Bank is ready to increase incentives if necessary.
🇩🇪🇪🇺According to Bloomberg economists, Eurozone recession risk rises from 30% to 45%: Germany, one of the most vulnerable members of the currency bloc, could face a recession with a 55% chance.
🇺🇸🏦Major US banks intend to report significant income from lending in connection with the increase in interest rates by the Fed.
🇫🇷French Ministry of Finance: Most likely, Russia will cut off gas supplies to Europe in response to EU sanctions.
☀️Have a great trading week!
👍23🔥10🌭4😍3❤2
Forwarded from FBS Analytics
The earnings season continues, and you still don't know how to trade stocks with FBS? 🤨
Let's fix this! 🙌
At first, you need to be sure that you have an account in either MetaTrader 5 or FBS Trader . FBS allows to trade stocks only through these programs.
✅ Check the economic calendar to see upcoming releases and their forecasts. You can use the calendar on our website or find one on the financial platforms. Choose what do you want to trade.
✅ If you want to make a deeper analysis of the company’s report to increase your profit probability, check the website of the company the stocks of which you plan to trade.
✅ Look at how the stock traded during the last couple of weeks. Compare the dynamics of the price with analysts’ forecasts in the earnings calendar. If the price rose too high, you might get ready to sell the stock on the news.
✅ Wait for the data to be published!
There is one main rule for trading on earnings that says:
✨If the figures outperform the forecasts, the stock will rise. If they are lower than the forecasts, the stock will fall.✨
But remember about the "Buy the rumor, sell the fact" scenario! The price can fall despite strong numbers if the market has already priced in the good outcome, and investors who bought the stock before the release start selling it afterward.
💚Now you are ready to trade stocks on earnings! If you still have questions, check the full guide
https://bit.ly/3KVfJvR
or write them in the comments ☺️
Let's fix this! 🙌
At first, you need to be sure that you have an account in either MetaTrader 5 or FBS Trader . FBS allows to trade stocks only through these programs.
✅ Check the economic calendar to see upcoming releases and their forecasts. You can use the calendar on our website or find one on the financial platforms. Choose what do you want to trade.
✅ If you want to make a deeper analysis of the company’s report to increase your profit probability, check the website of the company the stocks of which you plan to trade.
✅ Look at how the stock traded during the last couple of weeks. Compare the dynamics of the price with analysts’ forecasts in the earnings calendar. If the price rose too high, you might get ready to sell the stock on the news.
✅ Wait for the data to be published!
There is one main rule for trading on earnings that says:
✨If the figures outperform the forecasts, the stock will rise. If they are lower than the forecasts, the stock will fall.✨
But remember about the "Buy the rumor, sell the fact" scenario! The price can fall despite strong numbers if the market has already priced in the good outcome, and investors who bought the stock before the release start selling it afterward.
💚Now you are ready to trade stocks on earnings! If you still have questions, check the full guide
https://bit.ly/3KVfJvR
or write them in the comments ☺️

👍29❤10🥰6