
#MarketNews
✨Good Monday, everyone! This week is going to be interesting, because we have PMIs, Jackson Hole, and other interesting events coming up. Let’s review what interesting news has happened in the market so far.
🏦Traders await the Jackson Hole symposium, where the Fed Chair Jerome Powell is expected to provide a signal on further monetary policy steps on August 26.
📉EURUSD has started this week in red, inching closer to the parity level.
👀The gold (XAUUSD) is also moving down, the first support on the way of bears lies at 1725.
💵Indices have also been going lower since the start of Monday’s trading session. Nasdaq (US100) has been down more than 0.8%, while S&P500 (US500) has dropped by 0.7%.
📈USDCNH has surged to the levels of September 2020, above the 6.84 level. Now analysts see the possibility for the pair to go even higher to 7.00.
🧯The US gas (XNGUSD) has retested the 9.52 level since the start of the week. Will the price break above this resistance?
If you want to find out trade ideas for today, wait for a new weekly market outlook! Are you excited about it? Leave a ❤️ reaction, if you do!
✨Good Monday, everyone! This week is going to be interesting, because we have PMIs, Jackson Hole, and other interesting events coming up. Let’s review what interesting news has happened in the market so far.
🏦Traders await the Jackson Hole symposium, where the Fed Chair Jerome Powell is expected to provide a signal on further monetary policy steps on August 26.
📉EURUSD has started this week in red, inching closer to the parity level.
👀The gold (XAUUSD) is also moving down, the first support on the way of bears lies at 1725.
💵Indices have also been going lower since the start of Monday’s trading session. Nasdaq (US100) has been down more than 0.8%, while S&P500 (US500) has dropped by 0.7%.
📈USDCNH has surged to the levels of September 2020, above the 6.84 level. Now analysts see the possibility for the pair to go even higher to 7.00.
🧯The US gas (XNGUSD) has retested the 9.52 level since the start of the week. Will the price break above this resistance?
If you want to find out trade ideas for today, wait for a new weekly market outlook! Are you excited about it? Leave a ❤️ reaction, if you do!

❤57👍27🥰4
🇬🇧🇺🇸#GBPUSD
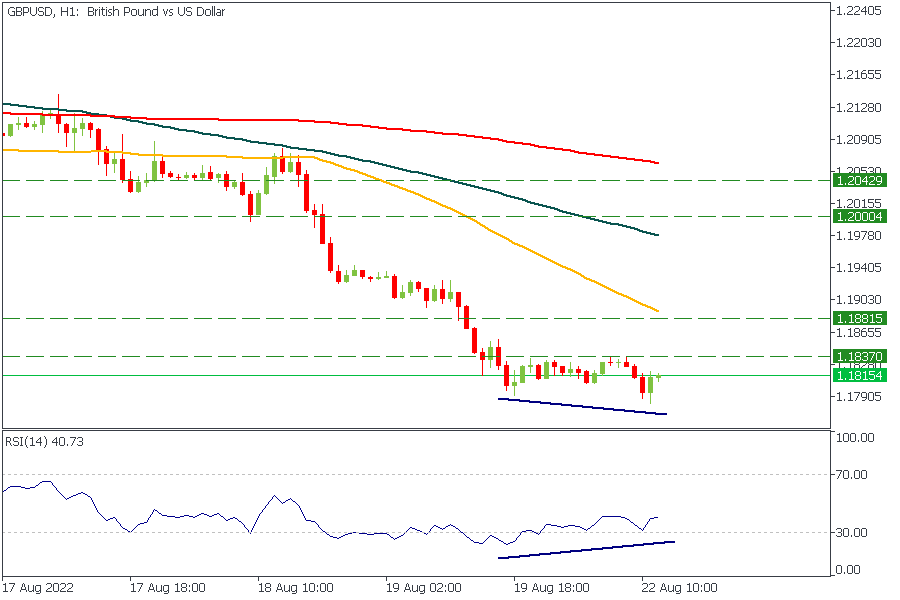
💥Bullish divergence has appeared on GBPUSD!
If the price breaks above 1.1837, consider buying with the target at 1.18815! (around 430 points profit)
🟩START TRADING🟩
💥Bullish divergence has appeared on GBPUSD!
If the price breaks above 1.1837, consider buying with the target at 1.18815! (around 430 points profit)
🟩START TRADING🟩
🔥33👍22🥰4
🇺🇸#Stocks #Crypto
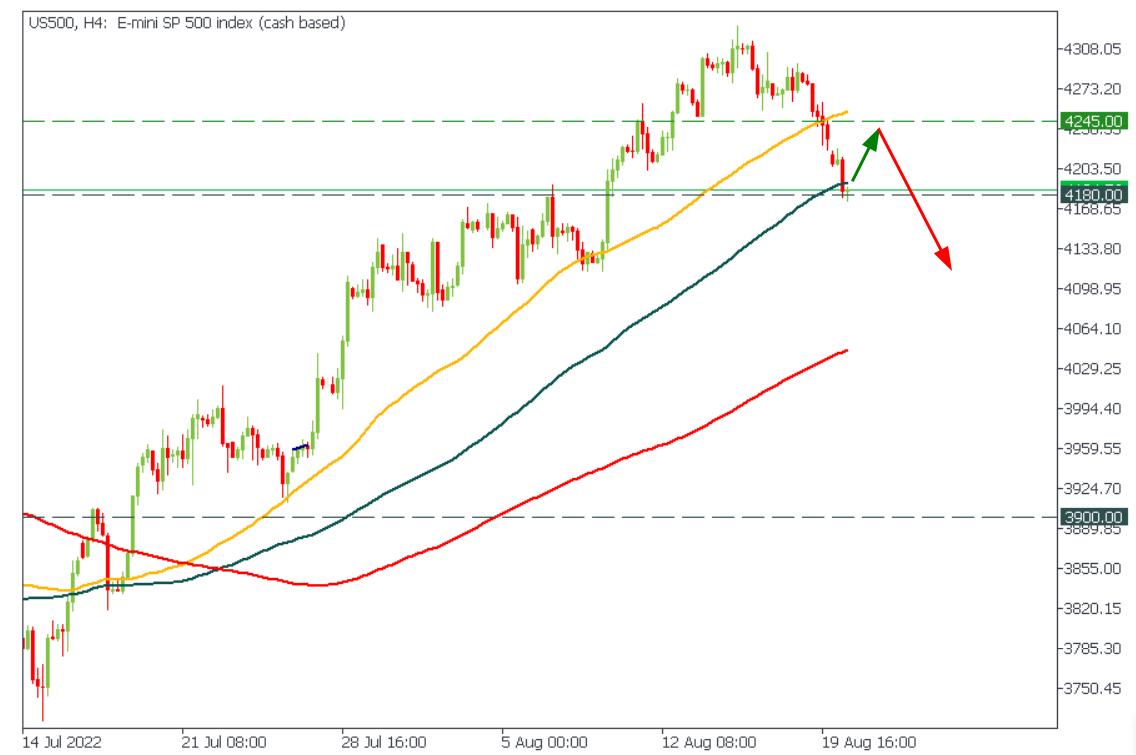
🔥Risk assets might pull back!
US500 has reached 4180 support. Currently, the price is consolidating above this level. You might consider buying US500 with the target at 4245 (1.5% potential profit) as the price might retest the 50-period moving average from below.
🟩START TRADING🟩
🔥Risk assets might pull back!
US500 has reached 4180 support. Currently, the price is consolidating above this level. You might consider buying US500 with the target at 4245 (1.5% potential profit) as the price might retest the 50-period moving average from below.
🟩START TRADING🟩
🔥16👍9🥰2
🛢#XBRUSD
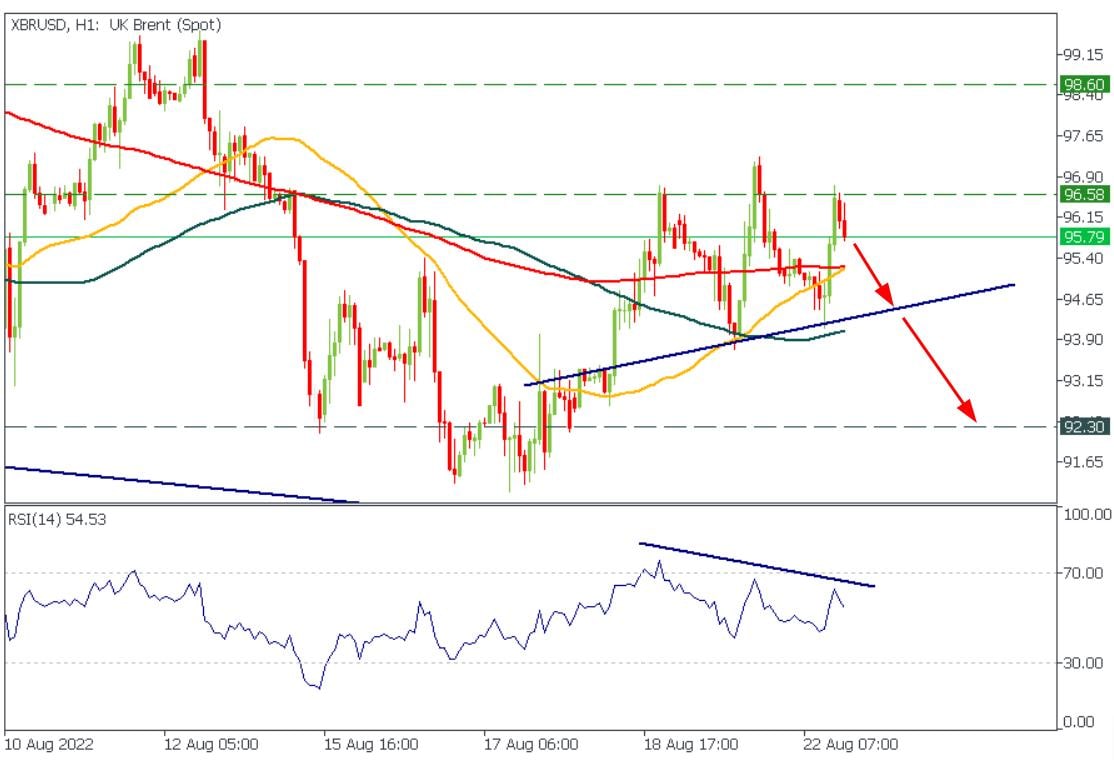
🔥Brent might fall again!
Currently, the price is forming a head-with-shoulders pattern with the bearish divergence on the RSI.
You might sell now, with the SL above 96.60, or you might sell after the neckline breakout.
TP: 92.30
🟩START TRADING🟩
🔥Brent might fall again!
Currently, the price is forming a head-with-shoulders pattern with the bearish divergence on the RSI.
You might sell now, with the SL above 96.60, or you might sell after the neckline breakout.
TP: 92.30
🟩START TRADING🟩
👍20❤6😢2✍1
What's your outlook for this week?
Anonymous Poll
38%
Gold up, USD down
36%
Gold down, USD up
9%
Gold up, USD up
7%
Gold down, USD down
10%
Everything sideways
👍19🔥6
#XAUUSD
🥇 Gold broke through the channel a while ago and made an accurate, clear retest yesterday. From the technical side, it's the strongest buy signal, but don't rush just now
📉USD is also feeling quite strong, reaching the last high of 109.00. I want to see a robust bearish reaction for the USD to be sure about the trade
✅ Still, it's a decent place to buy some gold with a stop loss of $1715. You may consider buying more on the $1772 breakout
💭 What's on your mind? Would you buy Gold from the current levels?
💚 START TRADING 💚
🥇 Gold broke through the channel a while ago and made an accurate, clear retest yesterday. From the technical side, it's the strongest buy signal, but don't rush just now
📉USD is also feeling quite strong, reaching the last high of 109.00. I want to see a robust bearish reaction for the USD to be sure about the trade
✅ Still, it's a decent place to buy some gold with a stop loss of $1715. You may consider buying more on the $1772 breakout
💭 What's on your mind? Would you buy Gold from the current levels?
💚 START TRADING 💚

👍33❤11👎9🔥6😢3🏆2
☀️ Good morning and have a fresh pack of news releases that will make your day:
🇪🇺 German Flash Manufacturing and Services PMI will come out today at 10:30 GMT+3. An hour later, the UK PMI will be released as well. Lower- than expected numbers would mean a contraction in the economy and weakens the underlying currency (the EUR and the GBP).
⛽️ European gas prices had reached an astonishing $3000 per metric ton, only $800 below the all-time-high. The US natural gas is also rising, edging to $9.95.
🇨🇳 China launched a 200-billion-yuan ($29 billion) bailout of the housing sector that is shrinking every day.
📉 More experts started to assume the US500 was in a bear market rally that won’t change the trend but give enough relief to market participants before an even deeper plunge.
🛢 Saidu Arabia’s minister said the oil market faces extreme volatility amid low liquidity. OPEC+ may need to tighten output to stabilize the market.
💸 Bitcoin Fear & Greed index fell below 30, indicating fear in the market, right after the main crypto decline to $21.0K.
💹 Hedge Funds are betting the Federal Reserve will stick to its hawkish way on Jackson Hole. The trade will benefit if Powell excludes dovish statements from his speech at the symposium.
💭Let’s share trade ideas in the comments! What is on your mind?
🇪🇺 German Flash Manufacturing and Services PMI will come out today at 10:30 GMT+3. An hour later, the UK PMI will be released as well. Lower- than expected numbers would mean a contraction in the economy and weakens the underlying currency (the EUR and the GBP).
⛽️ European gas prices had reached an astonishing $3000 per metric ton, only $800 below the all-time-high. The US natural gas is also rising, edging to $9.95.
🇨🇳 China launched a 200-billion-yuan ($29 billion) bailout of the housing sector that is shrinking every day.
📉 More experts started to assume the US500 was in a bear market rally that won’t change the trend but give enough relief to market participants before an even deeper plunge.
🛢 Saidu Arabia’s minister said the oil market faces extreme volatility amid low liquidity. OPEC+ may need to tighten output to stabilize the market.
💸 Bitcoin Fear & Greed index fell below 30, indicating fear in the market, right after the main crypto decline to $21.0K.
💹 Hedge Funds are betting the Federal Reserve will stick to its hawkish way on Jackson Hole. The trade will benefit if Powell excludes dovish statements from his speech at the symposium.
💭Let’s share trade ideas in the comments! What is on your mind?

👍33🔥5❤4
🛢#XBRUSD
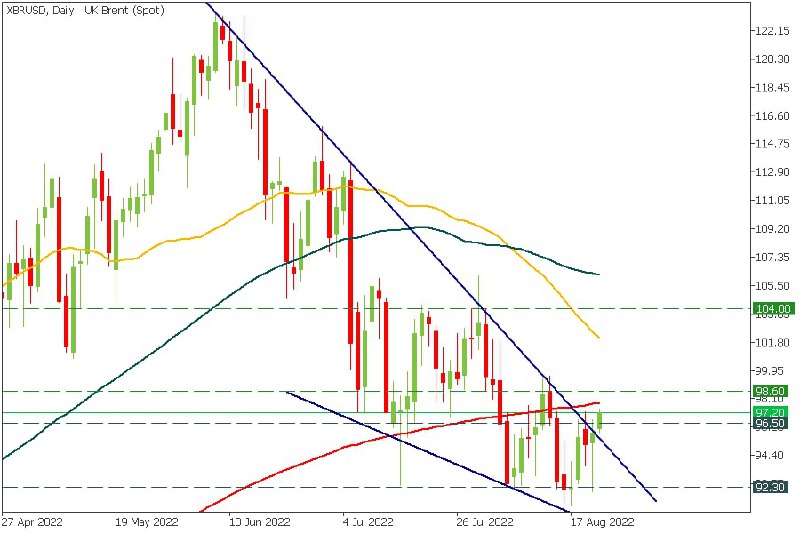
🔥Brent breaks out of the bullish rising wedge after Saudi Arabia's statement about a potential decrease in OPEC oil production.
❗️XBRUSD has also formed a double bottom pattern above the 92.30 support level, with the target at 104.00.
💪We believe XBRUSD might easily reach 104.00 after the breakout of the cross point of 98.60 horizontal level and the 200-period MA.
Entry: After a breakout of 200-period MA / 98.60
TP: 104.00
Potential profit: 5.40%
🤔Will you trade this movement?
💚 START TRADING 💚
🔥Brent breaks out of the bullish rising wedge after Saudi Arabia's statement about a potential decrease in OPEC oil production.
❗️XBRUSD has also formed a double bottom pattern above the 92.30 support level, with the target at 104.00.
💪We believe XBRUSD might easily reach 104.00 after the breakout of the cross point of 98.60 horizontal level and the 200-period MA.
Entry: After a breakout of 200-period MA / 98.60
TP: 104.00
Potential profit: 5.40%
🤔Will you trade this movement?
💚 START TRADING 💚
👍28🔥11😁4❤3
🇪🇺🇺🇸#EURUSD
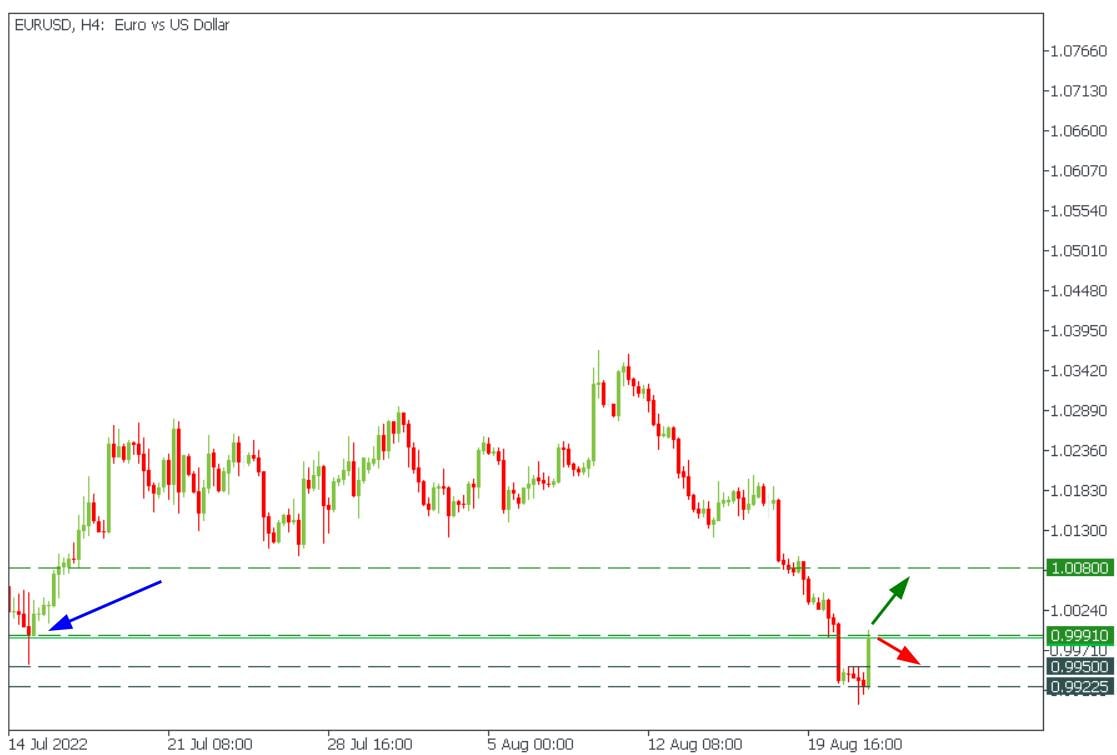
🔥EURUSD bounced to the resistance level of 0.99910 on the H4 timeframe! What is next?
Until the price stays until this resistance, you might look for sell trades with targets at 0.9950 and 0.99225!
However, as soon as the price breaks above 0.99910, it will head towards 1.0080!
Are you trading EURUSD right now?
💚 START TRADING 💚
🔥EURUSD bounced to the resistance level of 0.99910 on the H4 timeframe! What is next?
Until the price stays until this resistance, you might look for sell trades with targets at 0.9950 and 0.99225!
However, as soon as the price breaks above 0.99910, it will head towards 1.0080!
Are you trading EURUSD right now?
💚 START TRADING 💚
❤18👍16🔥9
🇺🇸🇨🇭#USDCHF
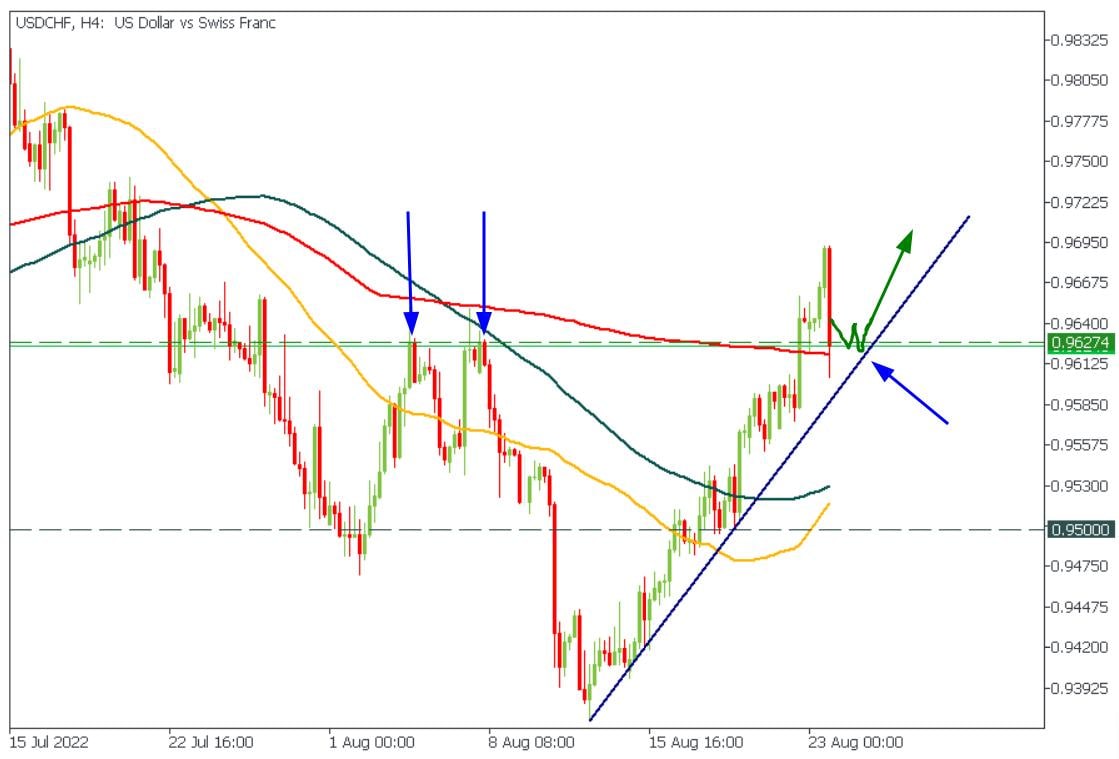
😱USDCHF dropped to a strong support level at 0.96274! Should we keep selling?
The current level is a cross point of a horizontal support and the 200-period moving average. Therefore, sellers might experience problems with breaking this level right away.
If the price consolidates above the mentioned level without a breakout below, the trend will continue.
💚 START TRADING 💚
😱USDCHF dropped to a strong support level at 0.96274! Should we keep selling?
The current level is a cross point of a horizontal support and the 200-period moving average. Therefore, sellers might experience problems with breaking this level right away.
If the price consolidates above the mentioned level without a breakout below, the trend will continue.
💚 START TRADING 💚
🔥24👍14
#MarketNews
Hello, our wonderful traders! It’s the middle of the trading week, so let’s see what news is important to know for today!✨
🇺🇸Investors will be keeping a close eye on Fed Chairman Jerome Powell's speech at the Jackson Hole symposium on Friday to see how hawkish the US central bank will be in the situation of growing economic troubles.
🛢Crude oil surged above $93 per barrel, helped by declining US crude inventories and a possible cut in OPEC+ production. WTIUSD is $93.70 at the moment, and XBRUSD is $99.42.
🇨🇳China's already fragile economy has been plagued by some of the driest riverbeds since 1865, disrupting hydroelectric power generation and causing energy chaos.
🀄️The yuan fell to its lowest level against the dollar in 2 years. USDCNH is $ 6.8766 now.
☢️Bitcoin and other major cryptocurrencies were largely flat on Tuesday, even as investors remained anxiously excited ahead of the Fed Chairman Jerome Powell's scheduled announcements on Friday about the central bank's direction on monetary policy.
💰Billionaire Warren Buffett is auctioning off his autographed high-tech portrait to raise money for the charity, and bidding has already topped $30,000.
✨Have a fantastic trading day! ✨
Hello, our wonderful traders! It’s the middle of the trading week, so let’s see what news is important to know for today!✨
🇺🇸Investors will be keeping a close eye on Fed Chairman Jerome Powell's speech at the Jackson Hole symposium on Friday to see how hawkish the US central bank will be in the situation of growing economic troubles.
🛢Crude oil surged above $93 per barrel, helped by declining US crude inventories and a possible cut in OPEC+ production. WTIUSD is $93.70 at the moment, and XBRUSD is $99.42.
🇨🇳China's already fragile economy has been plagued by some of the driest riverbeds since 1865, disrupting hydroelectric power generation and causing energy chaos.
🀄️The yuan fell to its lowest level against the dollar in 2 years. USDCNH is $ 6.8766 now.
☢️Bitcoin and other major cryptocurrencies were largely flat on Tuesday, even as investors remained anxiously excited ahead of the Fed Chairman Jerome Powell's scheduled announcements on Friday about the central bank's direction on monetary policy.
💰Billionaire Warren Buffett is auctioning off his autographed high-tech portrait to raise money for the charity, and bidding has already topped $30,000.
✨Have a fantastic trading day! ✨

👍29🔥5👏3🥰2
🇺🇸🇯🇵#USDJPY
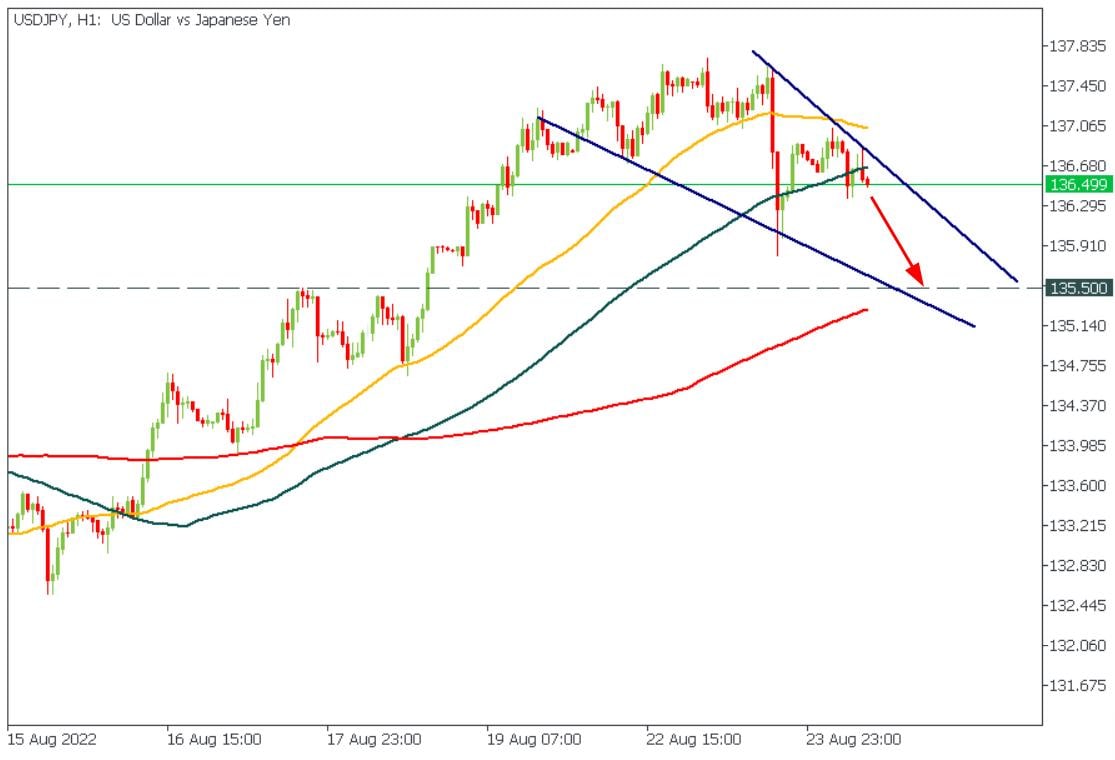
🔥USDJPY has formed support and resistance trendlines. It looks like the price is trying to form a bullish falling wedge!
We expect a decline to 135.50, a major resistance on higher timeframes for the currency pair!
🧐Are you in?
💚 START TRADING 💚
🔥USDJPY has formed support and resistance trendlines. It looks like the price is trying to form a bullish falling wedge!
We expect a decline to 135.50, a major resistance on higher timeframes for the currency pair!
🧐Are you in?
💚 START TRADING 💚
👍38🔥12💩5🤔1
🇨🇦🇯🇵#CADJPY
🔥Oil is going up! How does the CAD feel?
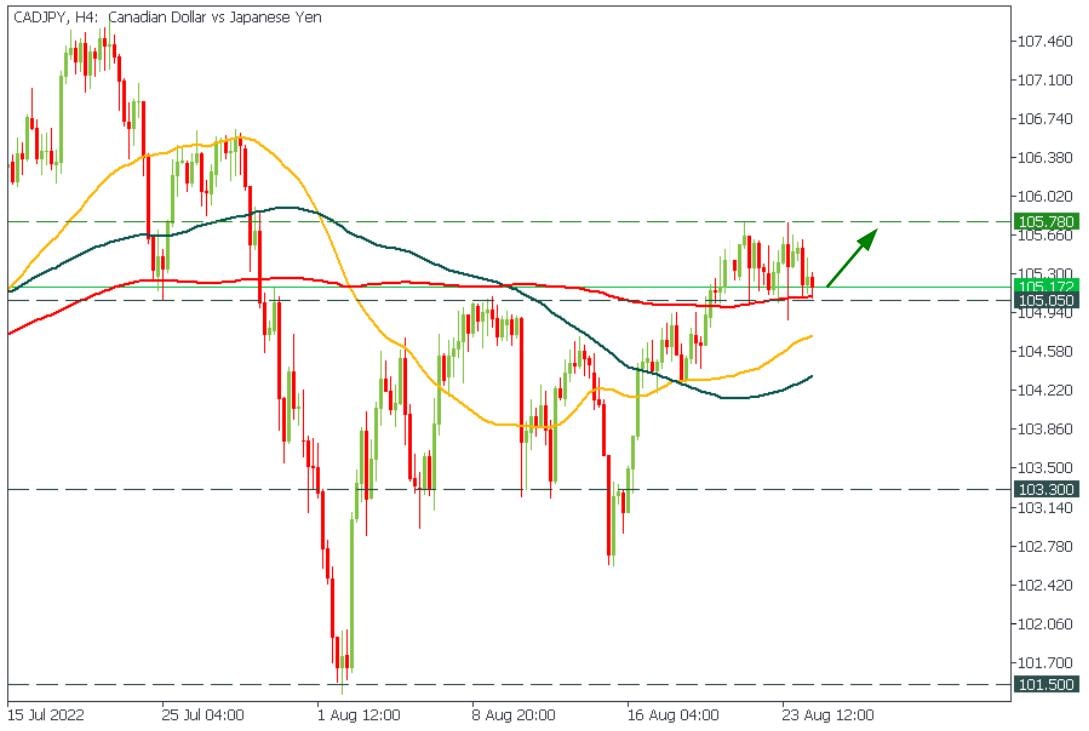
CADJPY is consolidating between 105.05 and 105.78! Also, the price gets supported by the 200-period moving average.
🌤We believe the oil market rally might support the Canadian dollar and bulls will be able to hold 105.50 support level. Therefore, we suggest buying oil around 105.50 with the target at 105.78!
❗️ If the price breaks above 105.78, it will keep going up towards 106.40.
💚 START TRADING 💚
🔥Oil is going up! How does the CAD feel?
CADJPY is consolidating between 105.05 and 105.78! Also, the price gets supported by the 200-period moving average.
🌤We believe the oil market rally might support the Canadian dollar and bulls will be able to hold 105.50 support level. Therefore, we suggest buying oil around 105.50 with the target at 105.78!
❗️ If the price breaks above 105.78, it will keep going up towards 106.40.
💚 START TRADING 💚
👍22🔥9
FBS Analytics
🇪🇺🇺🇸#EURUSD 🔥EURUSD bounced to the resistance level of 0.99910 on the H4 timeframe! What is next? Until the price stays until this resistance, you might look for sell trades with targets at 0.9950 and 0.99225! However, as soon as the price breaks above…
🎉This idea worked out perfectly! Congrats to everybody who followed!
Now buyers are attacking the 0.99910 level again. Consider buying EURUSD when the H4 candle closes above this level!
TP: 1.0080
❗️Until a breakout this level will act as the strongest resistance!
💚 START TRADING 💚
Now buyers are attacking the 0.99910 level again. Consider buying EURUSD when the H4 candle closes above this level!
TP: 1.0080
❗️Until a breakout this level will act as the strongest resistance!
💚 START TRADING 💚
👏34👍25🔥10❤8
💵 #USDJPY 💴
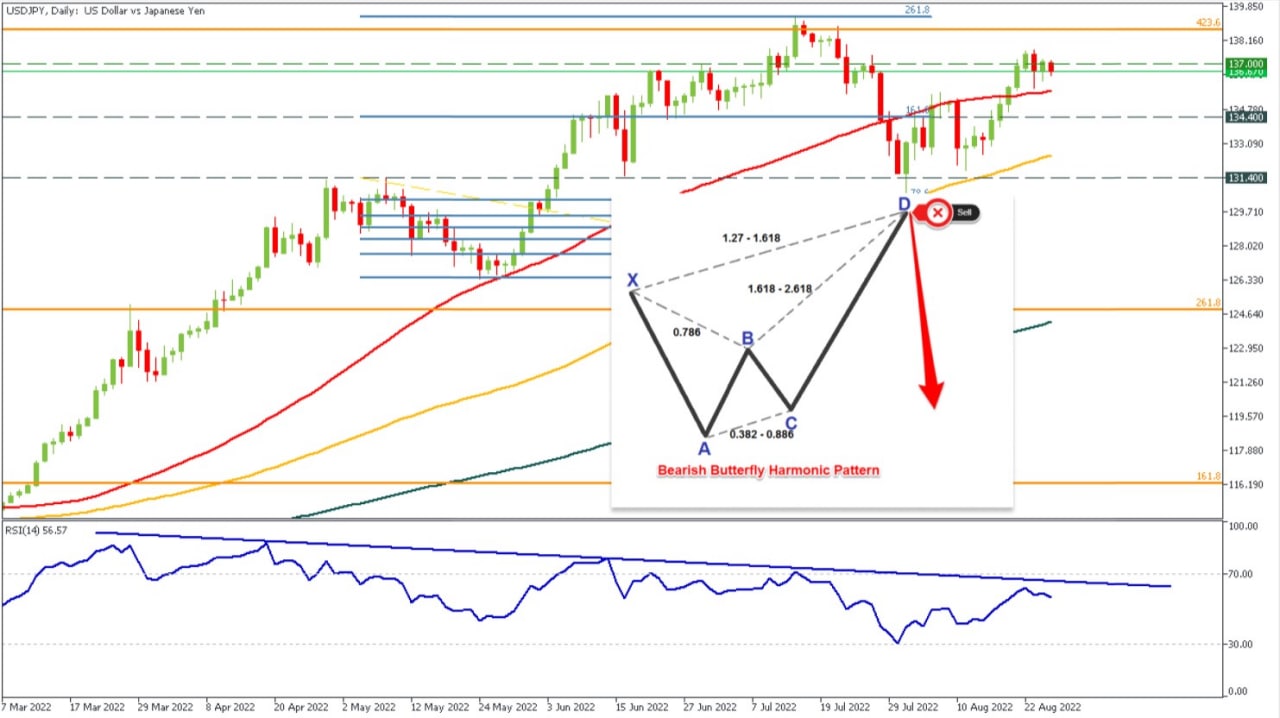
🦋The pair formed a pattern that looks like a bearish butterfly. Unfortunately, these patterns have a wide area from which it usually reverses.
📉 Nevertheless, you can now consider selling USDJPY with a stop loss above 140.00.
✅ Take profits in this trade should be placed at 131.40 and 125.00 (11 000 points of potential profit).
💭 Are you bullish on the JPY?
💚 START TRADING 💚
🦋The pair formed a pattern that looks like a bearish butterfly. Unfortunately, these patterns have a wide area from which it usually reverses.
📉 Nevertheless, you can now consider selling USDJPY with a stop loss above 140.00.
✅ Take profits in this trade should be placed at 131.40 and 125.00 (11 000 points of potential profit).
💭 Are you bullish on the JPY?
💚 START TRADING 💚
👍32❤🔥7🔥6👎4
#MarketNews
Hello, traders! Today is Thursday, usually one of the most volatile days on the forex market, so let’s see what news is important to know for today!✨
🇺🇸Today is the first day of Jackson Hole Symposium!
🇪🇺Fertilizer producers in the EU have begun shutting down plants due to gas prices. It can lead to a critical shortage of products already in winter.
🇯🇵Bank of Japan Governor Kuroda will continue to maintain the ultra-soft monetary policy in recent months even if inflation rises to 3% (above the target of 2%).
🇩🇪Germany's government is concerned about possible problems with the coal supply for power plants in the autumn and winter due to low water levels on the river Rhine and the oil supply in eastern parts of the country.
⛽️On Wednesday, a spike in LNG prices in Asia sent European gas prices up to new levels. Earlier this year, Asian buyers tried not to force gas purchases on the spot, giving up free volumes to Europeans. However, they are faced with forming their gas reserves as winter approaches. Russian Gazprom believes prices could rise to $4 000 per 1 000 cubic meters in winter, setting a new absolute record. Gas prices in the United States are trading under the resistance of 9.65.
🥇XAUUSD breaks above the 50-period moving average. Closest support 1759.00, closest resistance 1769.00.
🚘Tesla shares will start trading at around $300 today, at 16:30 GMT+3 after a 1:3 split. Increased volatility is expected.
🇨🇳Beijing has announced economic stimulus measures as China's economy is hit hard by a downturn in the property sector and a zero-tolerance policy for the virus.
China's State Council and Cabinet have added $44 billion in lending support to their decision banks and government agencies used by Beijing to spur economic growth.
✨Have a fantastic trading day! ✨
Hello, traders! Today is Thursday, usually one of the most volatile days on the forex market, so let’s see what news is important to know for today!✨
🇺🇸Today is the first day of Jackson Hole Symposium!
🇪🇺Fertilizer producers in the EU have begun shutting down plants due to gas prices. It can lead to a critical shortage of products already in winter.
🇯🇵Bank of Japan Governor Kuroda will continue to maintain the ultra-soft monetary policy in recent months even if inflation rises to 3% (above the target of 2%).
🇩🇪Germany's government is concerned about possible problems with the coal supply for power plants in the autumn and winter due to low water levels on the river Rhine and the oil supply in eastern parts of the country.
⛽️On Wednesday, a spike in LNG prices in Asia sent European gas prices up to new levels. Earlier this year, Asian buyers tried not to force gas purchases on the spot, giving up free volumes to Europeans. However, they are faced with forming their gas reserves as winter approaches. Russian Gazprom believes prices could rise to $4 000 per 1 000 cubic meters in winter, setting a new absolute record. Gas prices in the United States are trading under the resistance of 9.65.
🥇XAUUSD breaks above the 50-period moving average. Closest support 1759.00, closest resistance 1769.00.
🚘Tesla shares will start trading at around $300 today, at 16:30 GMT+3 after a 1:3 split. Increased volatility is expected.
🇨🇳Beijing has announced economic stimulus measures as China's economy is hit hard by a downturn in the property sector and a zero-tolerance policy for the virus.
China's State Council and Cabinet have added $44 billion in lending support to their decision banks and government agencies used by Beijing to spur economic growth.
✨Have a fantastic trading day! ✨

👍27🔥7
🇺🇸🇨🇭#USDCHF
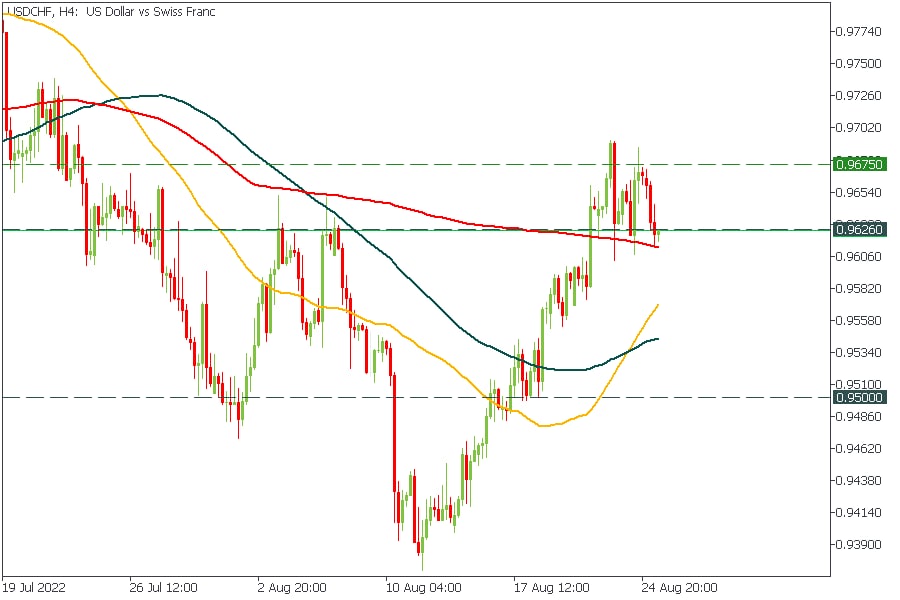
🔥The pair is consolidating above the cross point of the 200-period moving average and the horizontal support level.
Consider buying USDCHF with the target at 0.9675!
SL: below the 200-period MA
💚 START TRADING 💚
🔥The pair is consolidating above the cross point of the 200-period moving average and the horizontal support level.
Consider buying USDCHF with the target at 0.9675!
SL: below the 200-period MA
💚 START TRADING 💚
👍22❤8😁3
What you need to know about Fractals👍
Bill William’s indicators are many traders’ favourite. Let’s discuss one more, fractals. They not only look cute, but also can bring great signals for profitable trading.
🔸A fractal is a pattern in which the same configuration occurs throughout the structure, on a variety of different scales. In other words, it’s a pattern that can be subdivided into similar to each other patterns and to the parent pattern.
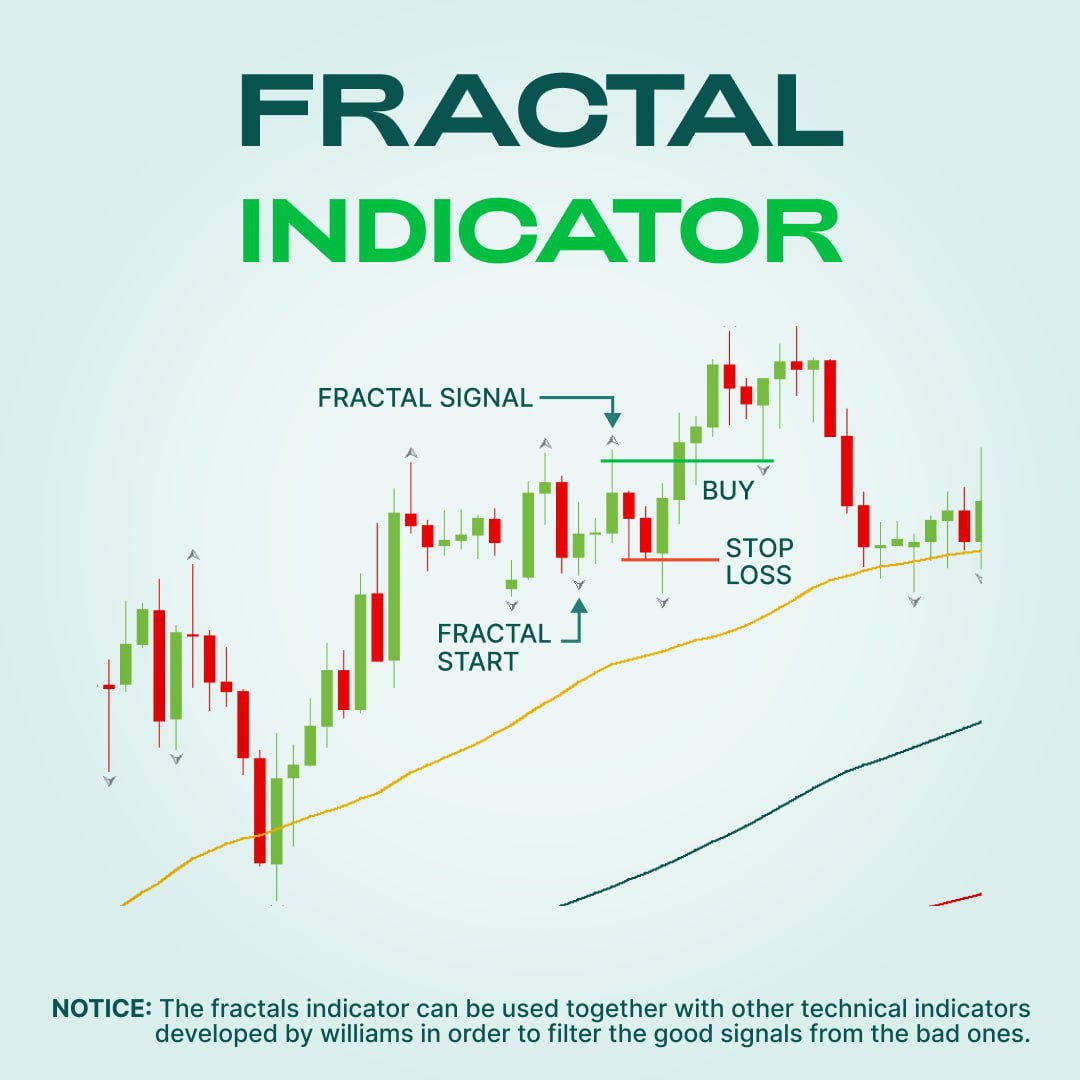
🔸If we get to the charts, a fractal is a pattern formed by at least 5 candlesticks. A fractal up is a series of five consecutive candlesticks where the highest high is preceded by two lower highs and is followed by two lower highs. The opposite situation is a fractal down. Both structures look like small reversals of the price.
How to trade using fractals?
After you added the Fractals indicator to a chart, you can hunt for trade signals. Here’s one of the methods:
1️⃣Wait for a situation when the latest fractal is pointing in the opposite direction from the previous one. This is called a fractal start. The trade should be in the direction of the second fractal.
2️⃣A trading signal will appear if the price goes beyond this fractal (i.e. its middle candlestick).
3️⃣Put a Stop Loss beyond a fractal stop, which is the furthest point from either of the previous two fractals in the opposite direction to the signal.
Note: the Fractals indicator can produce many signals. It’s wise to use it together with other technical indicators developed by Williams in order to filter the good signals from the bad ones.
Check our webinar to learn more https://bit.ly/3KiYWTA
Bill William’s indicators are many traders’ favourite. Let’s discuss one more, fractals. They not only look cute, but also can bring great signals for profitable trading.
🔸A fractal is a pattern in which the same configuration occurs throughout the structure, on a variety of different scales. In other words, it’s a pattern that can be subdivided into similar to each other patterns and to the parent pattern.
🔸If we get to the charts, a fractal is a pattern formed by at least 5 candlesticks. A fractal up is a series of five consecutive candlesticks where the highest high is preceded by two lower highs and is followed by two lower highs. The opposite situation is a fractal down. Both structures look like small reversals of the price.
How to trade using fractals?
After you added the Fractals indicator to a chart, you can hunt for trade signals. Here’s one of the methods:
1️⃣Wait for a situation when the latest fractal is pointing in the opposite direction from the previous one. This is called a fractal start. The trade should be in the direction of the second fractal.
2️⃣A trading signal will appear if the price goes beyond this fractal (i.e. its middle candlestick).
3️⃣Put a Stop Loss beyond a fractal stop, which is the furthest point from either of the previous two fractals in the opposite direction to the signal.
Note: the Fractals indicator can produce many signals. It’s wise to use it together with other technical indicators developed by Williams in order to filter the good signals from the bad ones.
Check our webinar to learn more https://bit.ly/3KiYWTA
👍17❤9🥰3👎1
🔔 Tesla shares will start trading at around $300 today, at 16:30 GMT+3 after a 1:3 split!
🤔What does it mean?
The allure is clear: Tesla’s stocks will now carry a price tag closer to $300 , giving traders 3 stocks for each one they currently own.
Plus, Tesla stock will be more affordable to retail traders and hence, a more attractive and volatile asset.
🧑💻How did the splits go before?
Tesla stock rose to 50% on the news of the last split in 2020 but lost 30% a day after.
The recent stock splits were done by Amazon and Google. The stocks didn't increase on the news but added 15% in value after the actual split.
What to expect?
The stock price didn't show a significant growth on the split news. Therefore, we doubt a significant crash is coming after the split. Vise versa, retail investors might start buying a "cheap" stock pushing the price higher.
Currently, the closest strong resistance for the price is $345.00. The closest support is $285.00.
😏Are you going to trade Tesla stock?
💚 START TRADING 💚
🤔What does it mean?
The allure is clear: Tesla’s stocks will now carry a price tag closer to $300 , giving traders 3 stocks for each one they currently own.
Plus, Tesla stock will be more affordable to retail traders and hence, a more attractive and volatile asset.
🧑💻How did the splits go before?
Tesla stock rose to 50% on the news of the last split in 2020 but lost 30% a day after.
The recent stock splits were done by Amazon and Google. The stocks didn't increase on the news but added 15% in value after the actual split.
What to expect?
The stock price didn't show a significant growth on the split news. Therefore, we doubt a significant crash is coming after the split. Vise versa, retail investors might start buying a "cheap" stock pushing the price higher.
Currently, the closest strong resistance for the price is $345.00. The closest support is $285.00.
😏Are you going to trade Tesla stock?
💚 START TRADING 💚

👍22❤8
🇨🇦🇯🇵#CADJPY
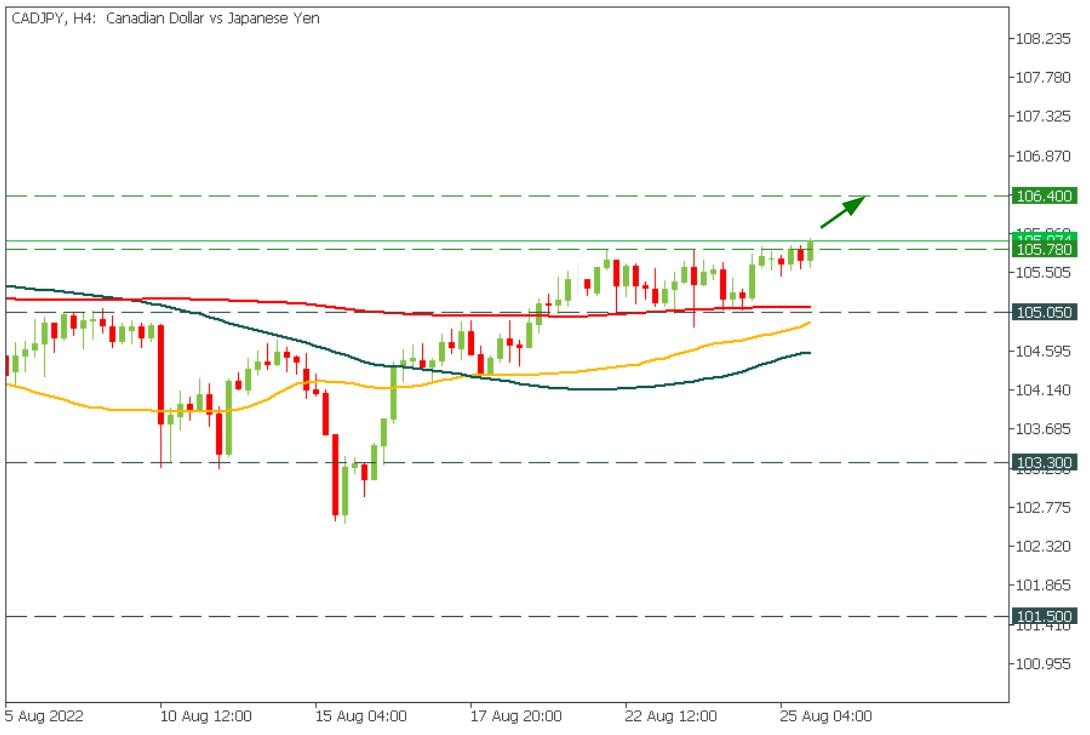
💥CADJPY is breaking above the strongest resistance level!
Buyers are pushing the price above 105.78, which has been acting as a resistance since August 22.
👆Consider buying the pair with the target at 106.40!
💚 START TRADING 💚
💥CADJPY is breaking above the strongest resistance level!
Buyers are pushing the price above 105.78, which has been acting as a resistance since August 22.
👆Consider buying the pair with the target at 106.40!
💚 START TRADING 💚
👍17❤7