
#Best_Investments
Part 2
Part one here
⤴️ The uptrend in Nifty Fifty ended at the beginning of the 1970-s, a period of the highest inflation, oil conflicts, and twofold Federal Reserve decisions.
1️⃣9️⃣7️⃣0️⃣ commodities and stagflation
🇮🇳 Many developing countries, such as India, experienced rapid economic growth in the 1970s, allowing investors to tap into these growth markets. For example, India showed average GDP growth of 6-7% in the 1970s, making the country one of the best performers.
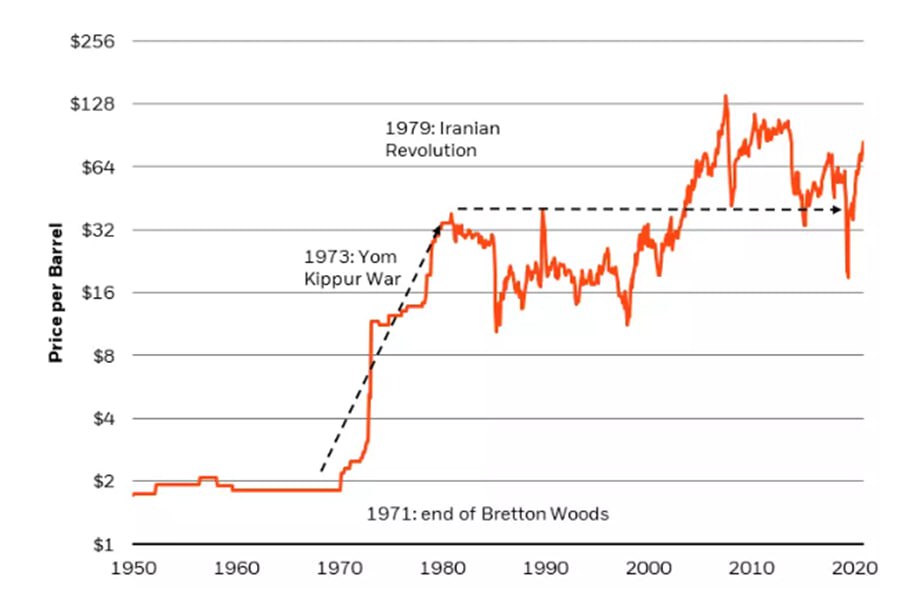
🏆 The Bretton Woods Agreement pegged the USD to gold and played a significant role in the post-World War II economic recovery. However, the system began to break down in the late 1960s due to the inability of the US to maintain the fixed exchange rate between the dollar and gold.
❌❌In 1971, the US abandoned the gold standard, and the Bretton Woods system effectively collapsed. The end of the agreement caused the oil price to skyrocket, making it the best investment of the decade.
🥇 Now, gold is gaining popularity in the world as the best asset to fight inflation. What price do you expect for gold and oil in the next five years? Share in the comments and give us more ❤️ reactions if you like such explanations
Part 2
Part one here
⤴️ The uptrend in Nifty Fifty ended at the beginning of the 1970-s, a period of the highest inflation, oil conflicts, and twofold Federal Reserve decisions.
1️⃣9️⃣7️⃣0️⃣ commodities and stagflation
🇮🇳 Many developing countries, such as India, experienced rapid economic growth in the 1970s, allowing investors to tap into these growth markets. For example, India showed average GDP growth of 6-7% in the 1970s, making the country one of the best performers.
🏆 The Bretton Woods Agreement pegged the USD to gold and played a significant role in the post-World War II economic recovery. However, the system began to break down in the late 1960s due to the inability of the US to maintain the fixed exchange rate between the dollar and gold.
❌❌In 1971, the US abandoned the gold standard, and the Bretton Woods system effectively collapsed. The end of the agreement caused the oil price to skyrocket, making it the best investment of the decade.
🥇 Now, gold is gaining popularity in the world as the best asset to fight inflation. What price do you expect for gold and oil in the next five years? Share in the comments and give us more ❤️ reactions if you like such explanations
❤🔥24👍16🔥9❤7✍3🤝2🎅1🎄1
What type of trader are you? Let's find out!
🏃Scalpers trade on the smallest timeframes. Their main objective is to grab small amount of points and exit the market immediately. They open dozens of trades throughout a day.
📆Day traders generate profits within the course of a day; they don’t like keeping their position open overnight.
🏄Swing traders hold their positions open for several days. It's important for them to be patient enough to tolerate the period of time when the price goes against them.
📈Position traders take advantage from the dominant trends rather than from short-term market fluctuations.
Share in the comments what trader you are!🤩
🏃Scalpers trade on the smallest timeframes. Their main objective is to grab small amount of points and exit the market immediately. They open dozens of trades throughout a day.
📆Day traders generate profits within the course of a day; they don’t like keeping their position open overnight.
🏄Swing traders hold their positions open for several days. It's important for them to be patient enough to tolerate the period of time when the price goes against them.
📈Position traders take advantage from the dominant trends rather than from short-term market fluctuations.
Share in the comments what trader you are!🤩
👍57❤🔥36🐳10✍5😍5🍾3😢2
#TradingEducation
🧐 How to identify the reversal?
It may be hard to spot a reversal when the price moves within a trend. However, there are certain signals that can actually help. Let's consider an example.
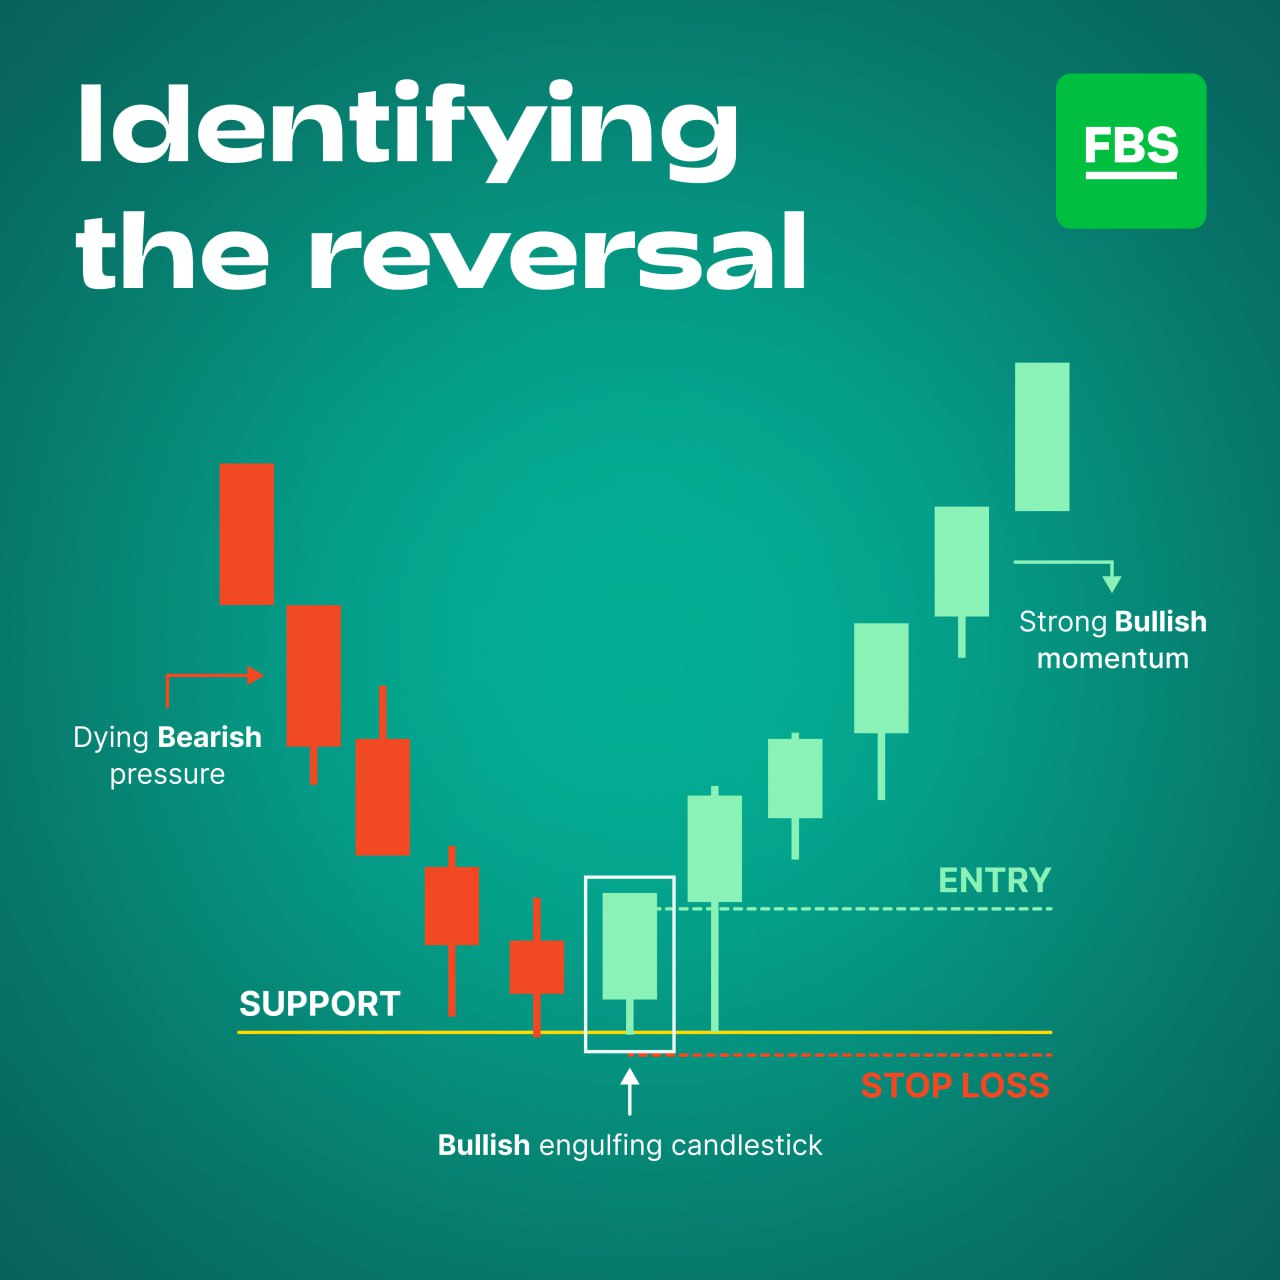
In the picture below, the price was moving within a downtrend. The price started forming candlesticks with long lower shadows and small real bodies. That was the first sign of the weakening trend.
After the price reached a strong support and formed a small candlestick, a big green candlestick appeared. The Bullish Engulfing pattern was confirmed by the following bullish candle.
This is a good moment for placing the long entry order near the opening price of the bullish candlestick after the Engulfing pattern.
A protective Stop Loss is recommended to set below the support level, where the reversal happened.
🫵 Do you use candlestick patterns to confirm a reversal?
🧐 How to identify the reversal?
It may be hard to spot a reversal when the price moves within a trend. However, there are certain signals that can actually help. Let's consider an example.
In the picture below, the price was moving within a downtrend. The price started forming candlesticks with long lower shadows and small real bodies. That was the first sign of the weakening trend.
After the price reached a strong support and formed a small candlestick, a big green candlestick appeared. The Bullish Engulfing pattern was confirmed by the following bullish candle.
This is a good moment for placing the long entry order near the opening price of the bullish candlestick after the Engulfing pattern.
A protective Stop Loss is recommended to set below the support level, where the reversal happened.
🫵 Do you use candlestick patterns to confirm a reversal?
👍91💯16🥰8❤5🐳5⚡4🔥1😢1
⚡️Attention all traders! Just a friendly reminder that due to Martin Luther King Jr. Day, several markets and instruments will be closed or closing early.
❗️US stocks will be closed for the entire day. The USDBRL will also be closed. Additionally, the following instruments will close early: XTIUSD, XBRUSD, XNGUSD, XAUUSD, XAGUSD, XAUGBP, XAUEUR, XAUAUD, XAGEUR, Platinum, Palladium will close at 21:15 (GMT+2).
❗️Please also note that JP225, US30, US100, US500 will close early at 20:00 (GMT+2). It's always important to keep track of market holidays and schedule adjustments to avoid any potential losses and make informed decisions.
❗️US stocks will be closed for the entire day. The USDBRL will also be closed. Additionally, the following instruments will close early: XTIUSD, XBRUSD, XNGUSD, XAUUSD, XAGUSD, XAUGBP, XAUEUR, XAUAUD, XAGEUR, Platinum, Palladium will close at 21:15 (GMT+2).
❗️Please also note that JP225, US30, US100, US500 will close early at 20:00 (GMT+2). It's always important to keep track of market holidays and schedule adjustments to avoid any potential losses and make informed decisions.

👍37🔥5❤4👏4😍2
💎 Happy Monday, our fellow traders. We are thrilled by what this week can give. Write in the comments what asset you want to trade today, and here’s what will wait for you this week:
📍 All times are given in GMT+2 time zone.
1️⃣ Monday:
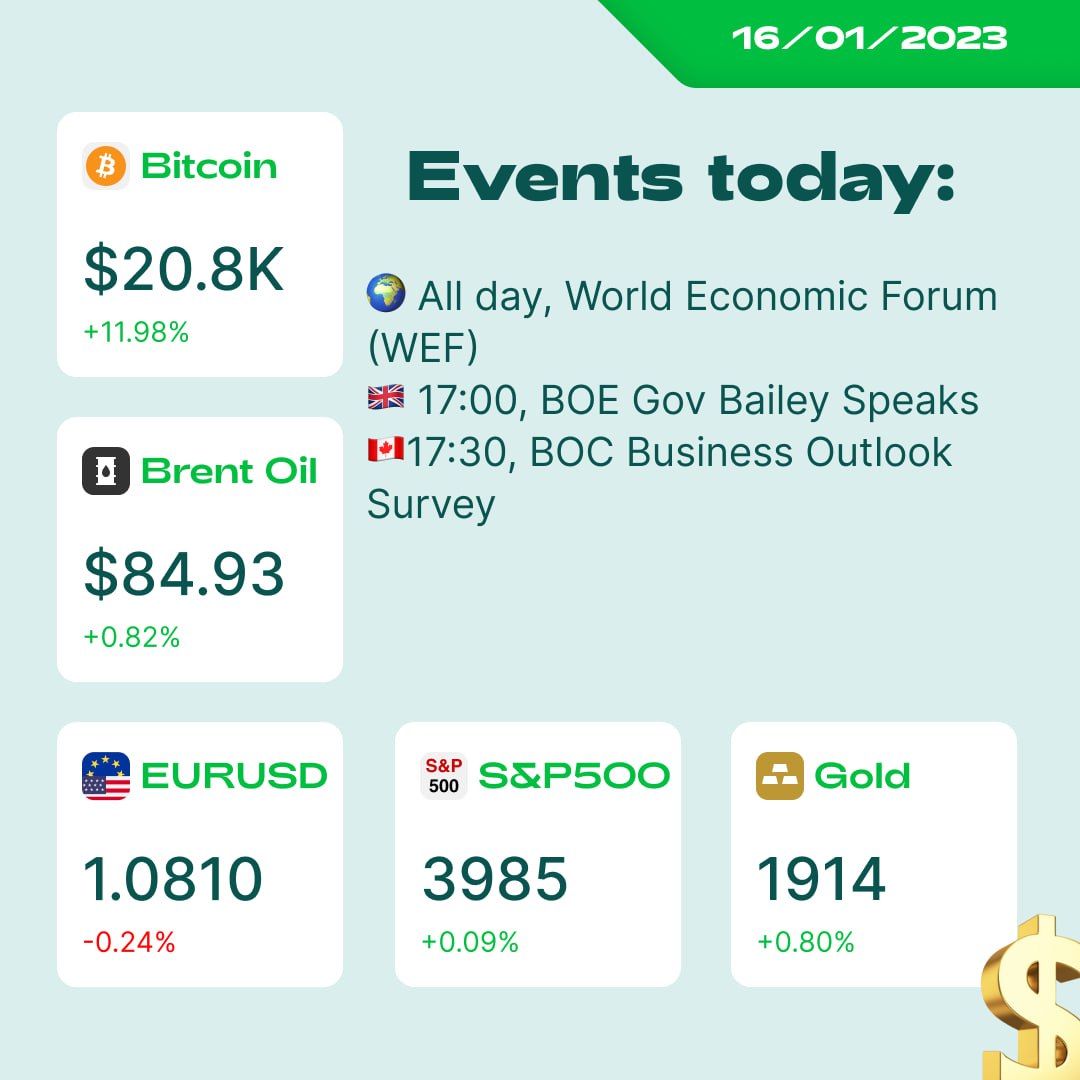
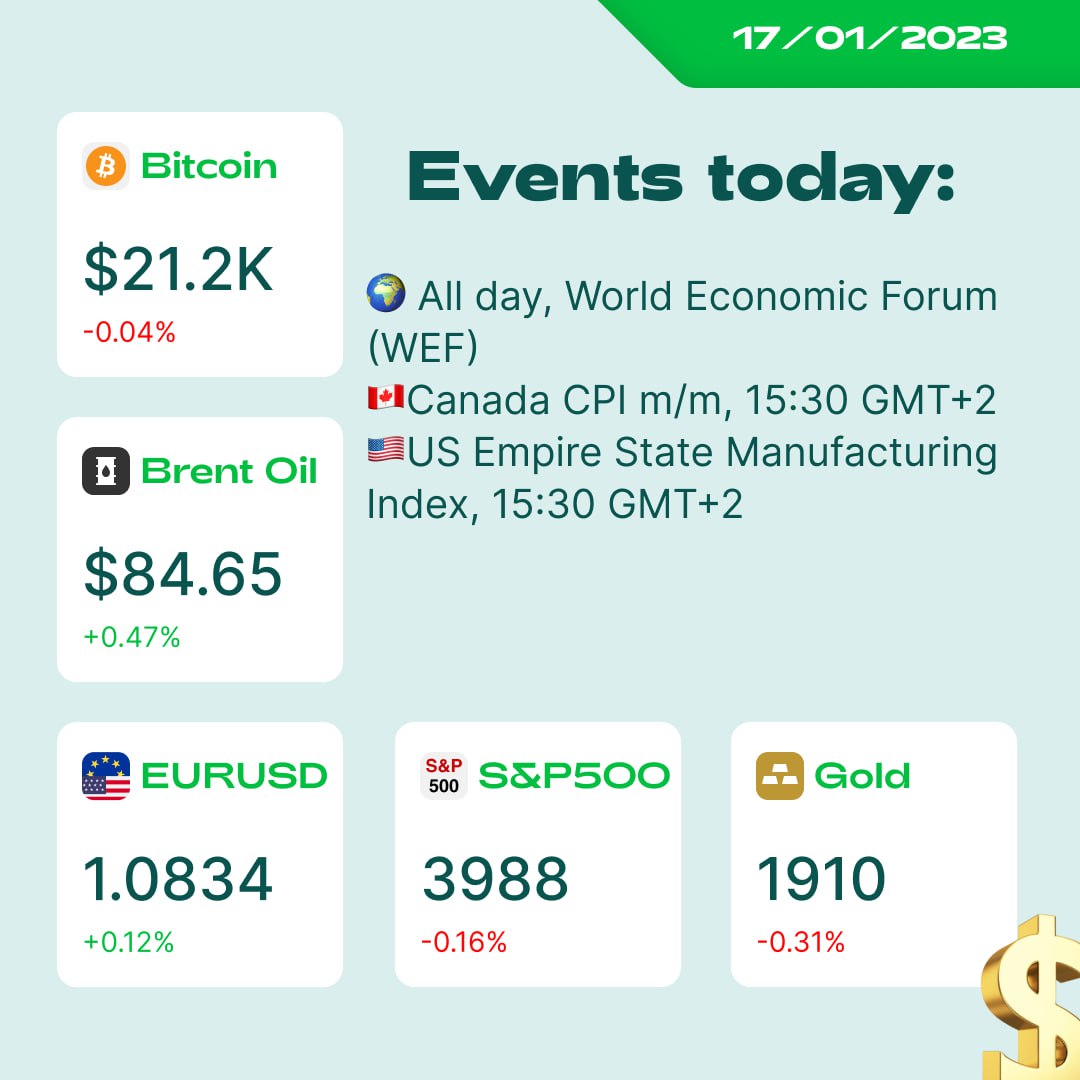
World Economic Forum (WEF) starts today. The meeting is a place for central bankers, investors, and business leaders to gather and comment on the current economic state. Usually, WEF generates news, thus creating extra volatility in the market.
17:00, BOE Gov Bailey Speaks
17:30, BOC Business Outlook Survey
2️⃣ Tuesday:
04:00, China GDP q/y
09:00, UK Claimant Count Change (NFP)
15:30, CAD CPI m/m, also Median, Trimmed, and Common CPI
15:30, US Empire State Manufacturing Index
3️⃣ Wednesday:
Japan Monetary Policy Statement, Press Conference, and Outlook Report
09:00, UK CPI y/y
15:30, US Core PPI m/m, Core Retail Sales, PPI, and Retail Sales.
4️⃣ Thursday:
12:30, ECB President Lagarde Speaks
20:15, FOMC Member Brainard Speaks
5️⃣ Friday:
10:00, SNB Chairman Jordan Speaks
12:00, ECB President Lagarde Speaks
20:00, FOMC Member Waller Speaks
🗞 And some news of the day:
💶 EURUSD is bullish at the start of the week; the level of 1.0925 is promising.
💴 Japanese companies paid more for goods and services in 2022 than in any year on record. PPI rose 9.7% from the year before.
🇨🇳 China’s economy is set to continue its recovery faster as consumption and emerging industries are set to be strong this year.
💸 Bitcoin surge last week caused more than $500 million in short sellers’ liquidations, the most in three months. Crypto traders are becoming greedy again, which is a reason to be careful.
📊 Polls predict the ECB Interest Rate will peak at 3.25% before a possible rate cut in July.
💰 Have a fantastic trading day!
📍 All times are given in GMT+2 time zone.
1️⃣ Monday:
World Economic Forum (WEF) starts today. The meeting is a place for central bankers, investors, and business leaders to gather and comment on the current economic state. Usually, WEF generates news, thus creating extra volatility in the market.
17:00, BOE Gov Bailey Speaks
17:30, BOC Business Outlook Survey
2️⃣ Tuesday:
04:00, China GDP q/y
09:00, UK Claimant Count Change (NFP)
15:30, CAD CPI m/m, also Median, Trimmed, and Common CPI
15:30, US Empire State Manufacturing Index
3️⃣ Wednesday:
Japan Monetary Policy Statement, Press Conference, and Outlook Report
09:00, UK CPI y/y
15:30, US Core PPI m/m, Core Retail Sales, PPI, and Retail Sales.
4️⃣ Thursday:
12:30, ECB President Lagarde Speaks
20:15, FOMC Member Brainard Speaks
5️⃣ Friday:
10:00, SNB Chairman Jordan Speaks
12:00, ECB President Lagarde Speaks
20:00, FOMC Member Waller Speaks
🗞 And some news of the day:
💶 EURUSD is bullish at the start of the week; the level of 1.0925 is promising.
💴 Japanese companies paid more for goods and services in 2022 than in any year on record. PPI rose 9.7% from the year before.
🇨🇳 China’s economy is set to continue its recovery faster as consumption and emerging industries are set to be strong this year.
💸 Bitcoin surge last week caused more than $500 million in short sellers’ liquidations, the most in three months. Crypto traders are becoming greedy again, which is a reason to be careful.
📊 Polls predict the ECB Interest Rate will peak at 3.25% before a possible rate cut in July.
💰 Have a fantastic trading day!
👍21❤2🔥2🐳2
🇺🇸#US500
🔥The US indices look bearish!
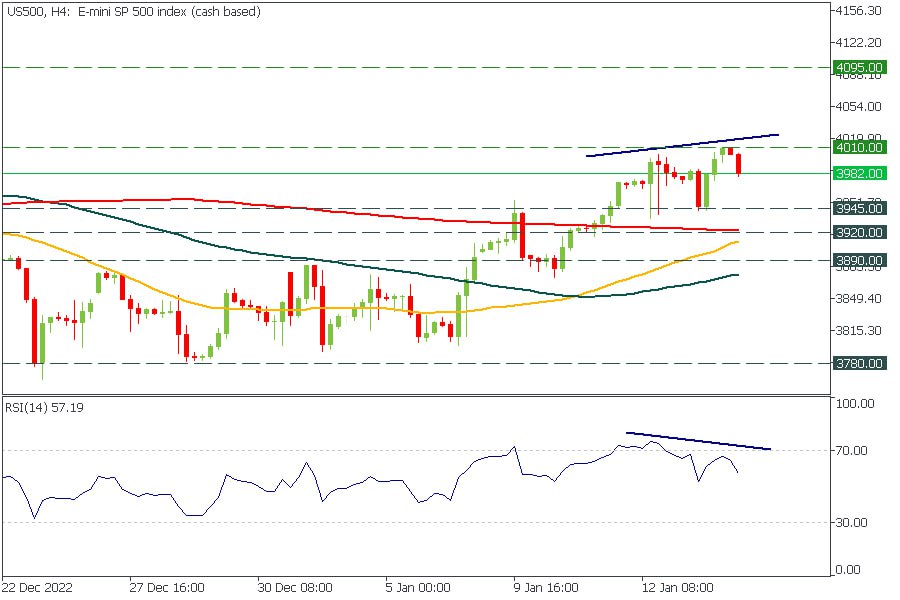
US500 has formed a bearish divergence with the RSI on the H4 timeframe. Thus, we expect the price to decline at least to 3945.00 support.
⬇️Trade: SELL
🎯Targets: 3945.00, 3920.00
✅START TRADING ✅
🔥The US indices look bearish!
US500 has formed a bearish divergence with the RSI on the H4 timeframe. Thus, we expect the price to decline at least to 3945.00 support.
⬇️Trade: SELL
🎯Targets: 3945.00, 3920.00
✅START TRADING ✅
👍19🔥5❤4🐳4
#Best_Investments
Part 3
Part two here
1️⃣9️⃣8️⃣0️⃣ — the rise and fall of Japan
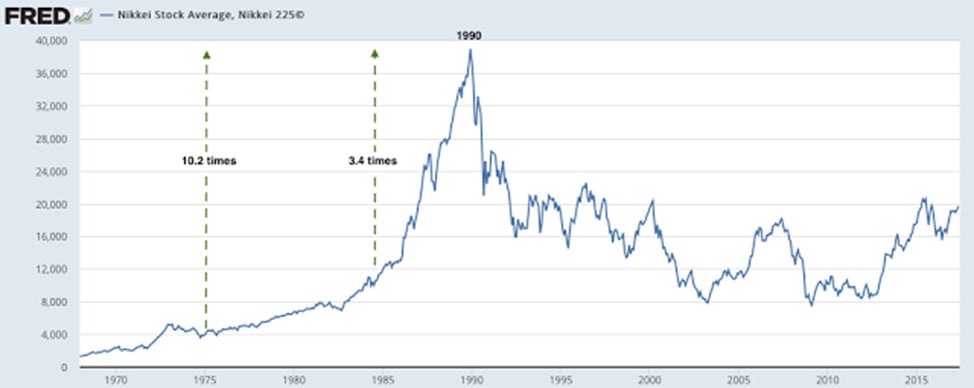
🚀 In the late 1980s, the Japanese stock market underwent a rapid expansion known as the “bubble economy,” driven by economic growth and speculation. During this time, stock prices soared to record highs, and the value of the real estate and other assets also rose dramatically.
🫧 However, this bubble eventually burst, leading to a sharp decline in stock prices and a recession in the Japanese economy. The stock market crash of 1990 wiped out billions of dollars in wealth and caused many companies to go bankrupt.
📉 Despite efforts to stimulate the economy, the stock market didn’t recover, and the Nikkei 225 (JP225) index is still lower than in the 1980s.
Give us ❤️ reaction if you like this educational posts!
Do you think the Japan market will reach its all-time high again?
On the figure: Japanese stock market since 1970
Part 3
Part two here
1️⃣9️⃣8️⃣0️⃣ — the rise and fall of Japan
🚀 In the late 1980s, the Japanese stock market underwent a rapid expansion known as the “bubble economy,” driven by economic growth and speculation. During this time, stock prices soared to record highs, and the value of the real estate and other assets also rose dramatically.
🫧 However, this bubble eventually burst, leading to a sharp decline in stock prices and a recession in the Japanese economy. The stock market crash of 1990 wiped out billions of dollars in wealth and caused many companies to go bankrupt.
📉 Despite efforts to stimulate the economy, the stock market didn’t recover, and the Nikkei 225 (JP225) index is still lower than in the 1980s.
Give us ❤️ reaction if you like this educational posts!
Do you think the Japan market will reach its all-time high again?
On the figure: Japanese stock market since 1970
❤41👍12🐳4🔥3❤🔥1😍1
🇺🇸🇯🇵#USDJPY
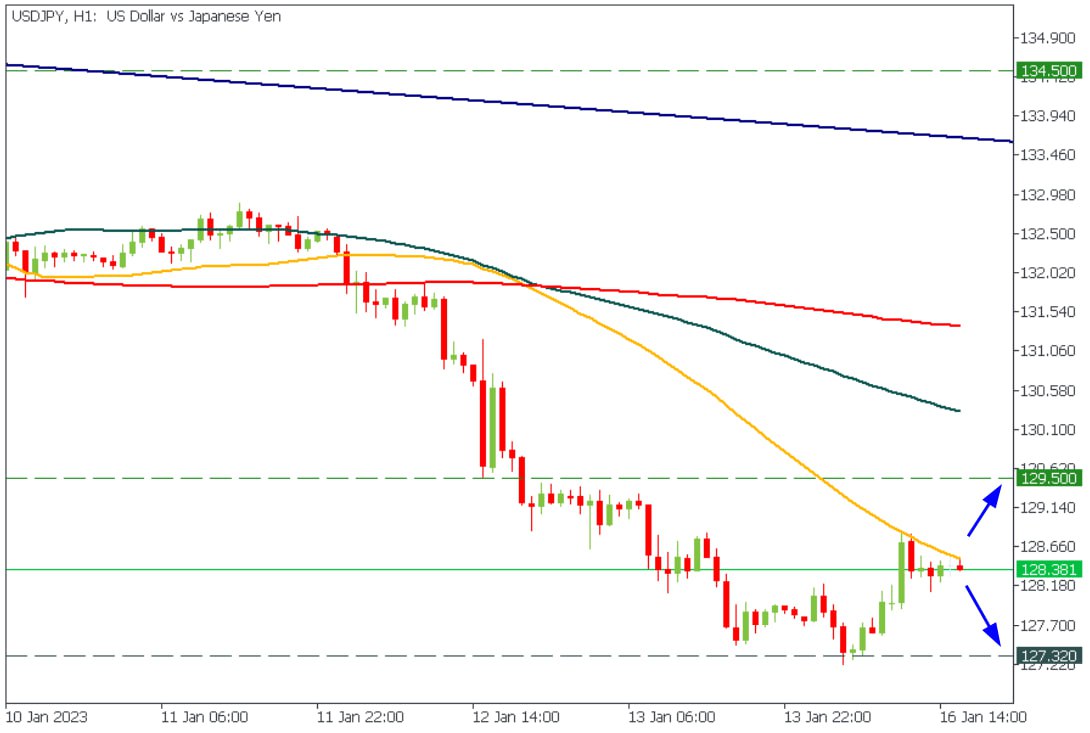
💥USDJPY is consolidating under the 50-hour moving average. Until the price breaks above this MA, we might be looking for trend continuation, selling the pair with the target at 127.32.
❗️However, when the price breaks above this moving average, we will buy the USDJPY with a target of 129.50.
Are you bullish or bearish on the USDJPY?
✅START TRADING ✅
💥USDJPY is consolidating under the 50-hour moving average. Until the price breaks above this MA, we might be looking for trend continuation, selling the pair with the target at 127.32.
❗️However, when the price breaks above this moving average, we will buy the USDJPY with a target of 129.50.
Are you bullish or bearish on the USDJPY?
✅START TRADING ✅
❤10👍9🔥5⚡4🐳3🍾3❤🔥2👎2🙏2🫡2
🥇#XAUUSD
🔥XAUUSD M15 analysis!
The price might form a double-bottom pattern soon. If the price breaks through 1919.00, we will buy gold with a target of 1928.75.
🟢Trade: buy
🎯Target: 1928.75
🆙Entry: breakout above the 1919.00 resistance
✅START TRADING ✅
🔥XAUUSD M15 analysis!
The price might form a double-bottom pattern soon. If the price breaks through 1919.00, we will buy gold with a target of 1928.75.
🟢Trade: buy
🎯Target: 1928.75
🆙Entry: breakout above the 1919.00 resistance
✅START TRADING ✅

👍48❤11👎10❤🔥7💩4🥱4🔥3🤪2😍1
#MarketNews
☀️ Happy Tuesday, traders! Let's check what news is moving the markets right now.
❗️🇯🇵The Central Bank of Japan may announce a significant policy change this week as bond yields start again to exceed the upper limit set by the central bank. The new nominee for Japan's central bank governor will likely be presented to parliament on February 10.
☢️Coinshares reports two-month high inflows to Solana-focused funds recorded last week, meaning "smart money" are bullish on SOLUSD.
🛢Goldman predicts that oil demand will rise by 2 million bpd this year if international shipping resumes, pushing the price to new highs. In their opinion, the current conditions resemble the 2007-2008 oil market.
🇪🇺 The European Central Bank’s battle with inflation may end within half a year as policymakers begin to reverse rate hikes as soon as July. Economists predict the deposit rate to be raised to a peak of 3.25% from its current level of 2% in three steps. The survey shows two half-point hikes at the February and March meetings, followed by a 25 basis-point increase in May or June.
🇨🇳Asian markets are falling. COVID has damaged not only the economy but also the demographics of China. In 2022, for the first time in 60 years, there will be a population decline by 850 thousand people.
💵The USD fell against major currencies to a minimum of six months. The US dollar index is currently trading at 102.25.
What are you going to trade today? Share your technical setups & trade ideas!
☀️ Happy Tuesday, traders! Let's check what news is moving the markets right now.
❗️🇯🇵The Central Bank of Japan may announce a significant policy change this week as bond yields start again to exceed the upper limit set by the central bank. The new nominee for Japan's central bank governor will likely be presented to parliament on February 10.
☢️Coinshares reports two-month high inflows to Solana-focused funds recorded last week, meaning "smart money" are bullish on SOLUSD.
🛢Goldman predicts that oil demand will rise by 2 million bpd this year if international shipping resumes, pushing the price to new highs. In their opinion, the current conditions resemble the 2007-2008 oil market.
🇪🇺 The European Central Bank’s battle with inflation may end within half a year as policymakers begin to reverse rate hikes as soon as July. Economists predict the deposit rate to be raised to a peak of 3.25% from its current level of 2% in three steps. The survey shows two half-point hikes at the February and March meetings, followed by a 25 basis-point increase in May or June.
🇨🇳Asian markets are falling. COVID has damaged not only the economy but also the demographics of China. In 2022, for the first time in 60 years, there will be a population decline by 850 thousand people.
💵The USD fell against major currencies to a minimum of six months. The US dollar index is currently trading at 102.25.
What are you going to trade today? Share your technical setups & trade ideas!
👍22🔥4🐳4❤🔥2❤1👎1🍌1🍾1
🇦🇺🇨🇭#AUDCHF
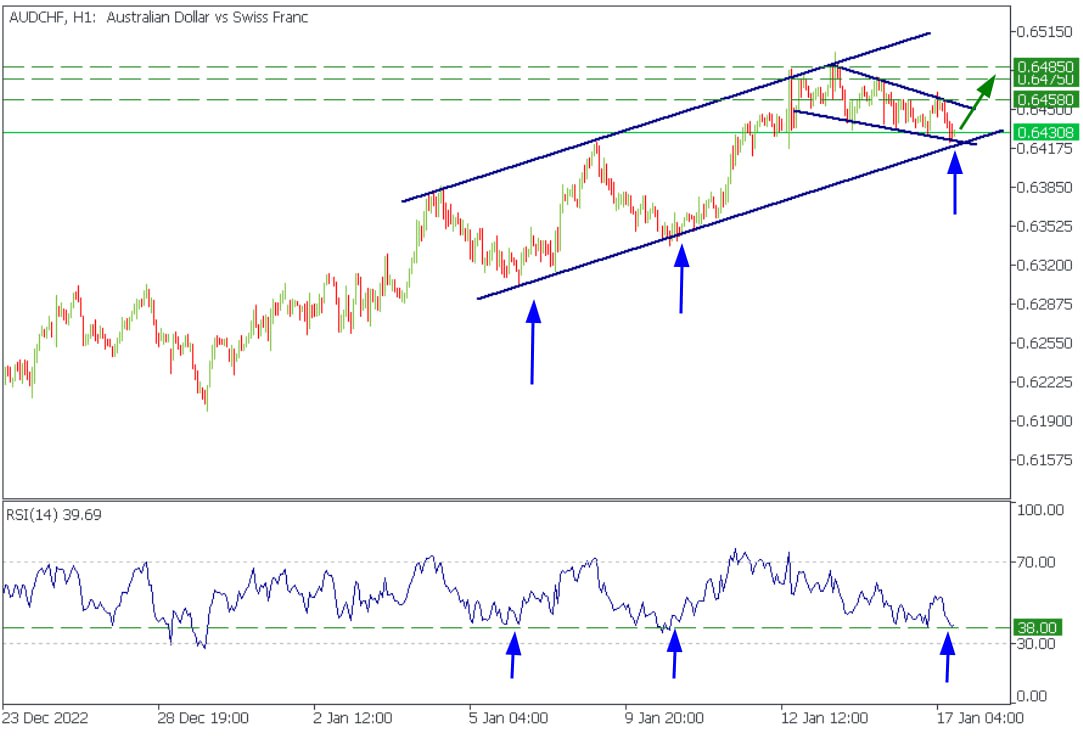
🔥An uptrend is about to continue!
There are several reasons for that:
1️⃣The price is trading inside the bullish wedge
2️⃣The price is trading above the lower border for the ascending channel
3️⃣The RSI is around 38.00, where two past reversals happened.
🔥🎯Our targets for AUDCHF are 0.6458, 0.6475, and 0.6485
❌SL: below the ascending trend line
😈Would you like to see a global analysis of this pair? Something is fantastic about it!
✅START TRADING ✅
🔥An uptrend is about to continue!
There are several reasons for that:
1️⃣The price is trading inside the bullish wedge
2️⃣The price is trading above the lower border for the ascending channel
3️⃣The RSI is around 38.00, where two past reversals happened.
🔥🎯Our targets for AUDCHF are 0.6458, 0.6475, and 0.6485
❌SL: below the ascending trend line
😈Would you like to see a global analysis of this pair? Something is fantastic about it!
✅START TRADING ✅
🔥20👍15🐳5❤3👏3🙏2🤔1🍾1🤪1
🥇#XAUUSD
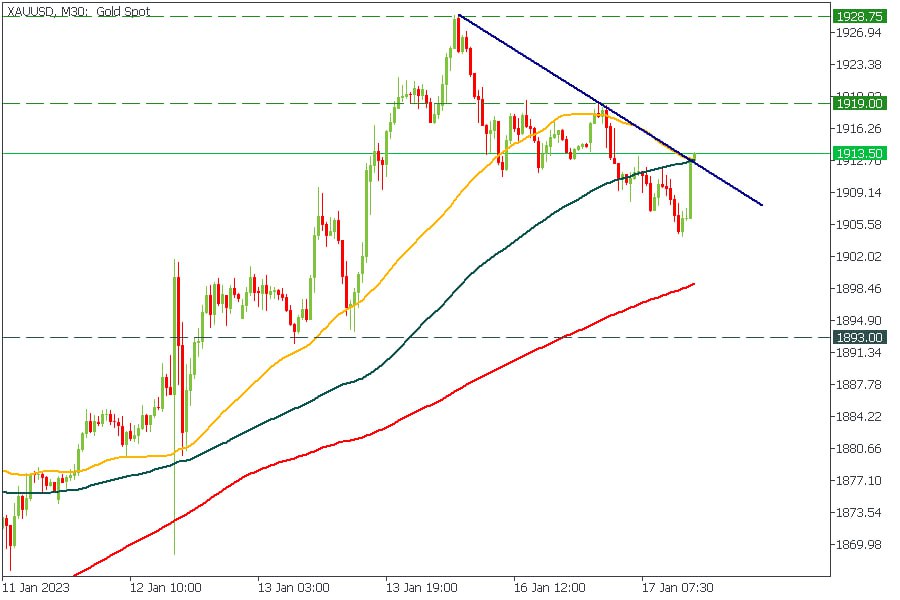
🔥XAUUSD might break out soon!
The price is testing the descending trend line. If the breakout happens, consider buying XAUUSD with targets of 1919.00 and 1928.75.
Are you buying gold now?
✅START TRADING ✅
🔥XAUUSD might break out soon!
The price is testing the descending trend line. If the breakout happens, consider buying XAUUSD with targets of 1919.00 and 1928.75.
Are you buying gold now?
✅START TRADING ✅
🔥16👍10🐳8❤3✍3🙏3💔2❤🔥1🤮1😍1
#XBRUSD
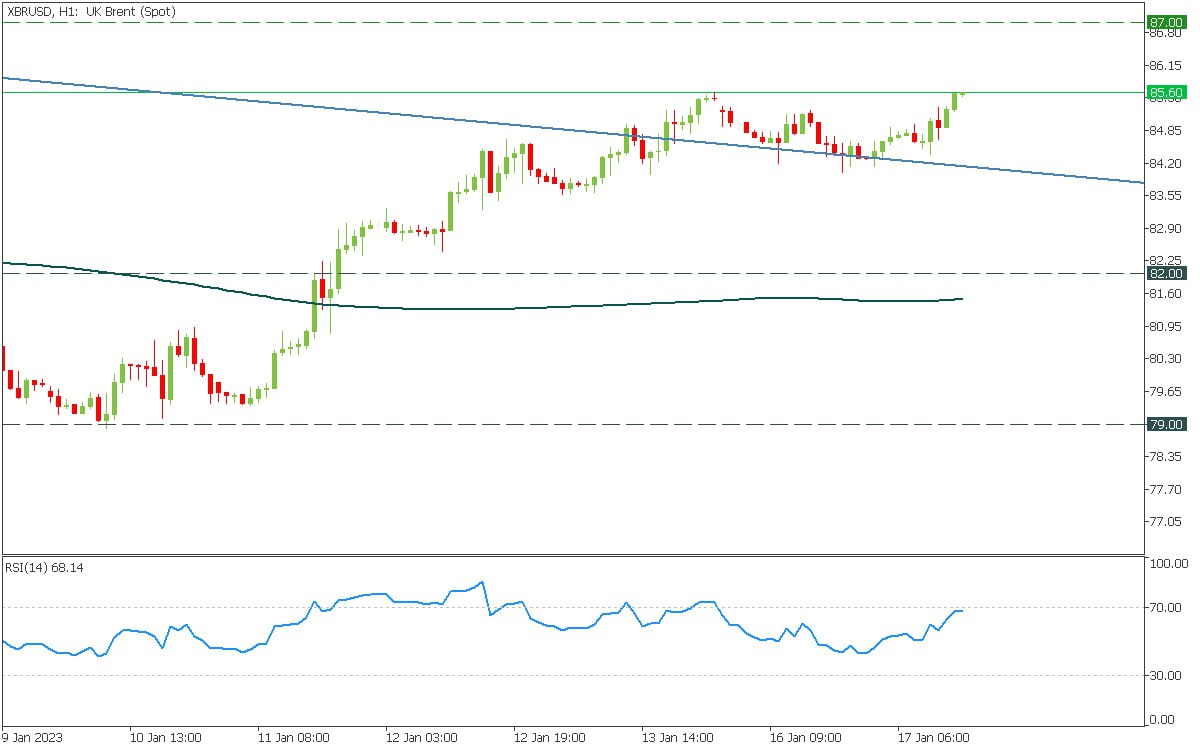
🛢 Oil is trying to break through the resistance of 85.60. If it succeeds, it will fly toward $87.00 per barrel.
📈 Buy traders may enter on the breakout after the retest.
Will it manage to break?
✅START TRADING ✅
🛢 Oil is trying to break through the resistance of 85.60. If it succeeds, it will fly toward $87.00 per barrel.
📈 Buy traders may enter on the breakout after the retest.
Will it manage to break?
✅START TRADING ✅
👍19🔥6🐳4🍓3❤🔥2❤1
#US500
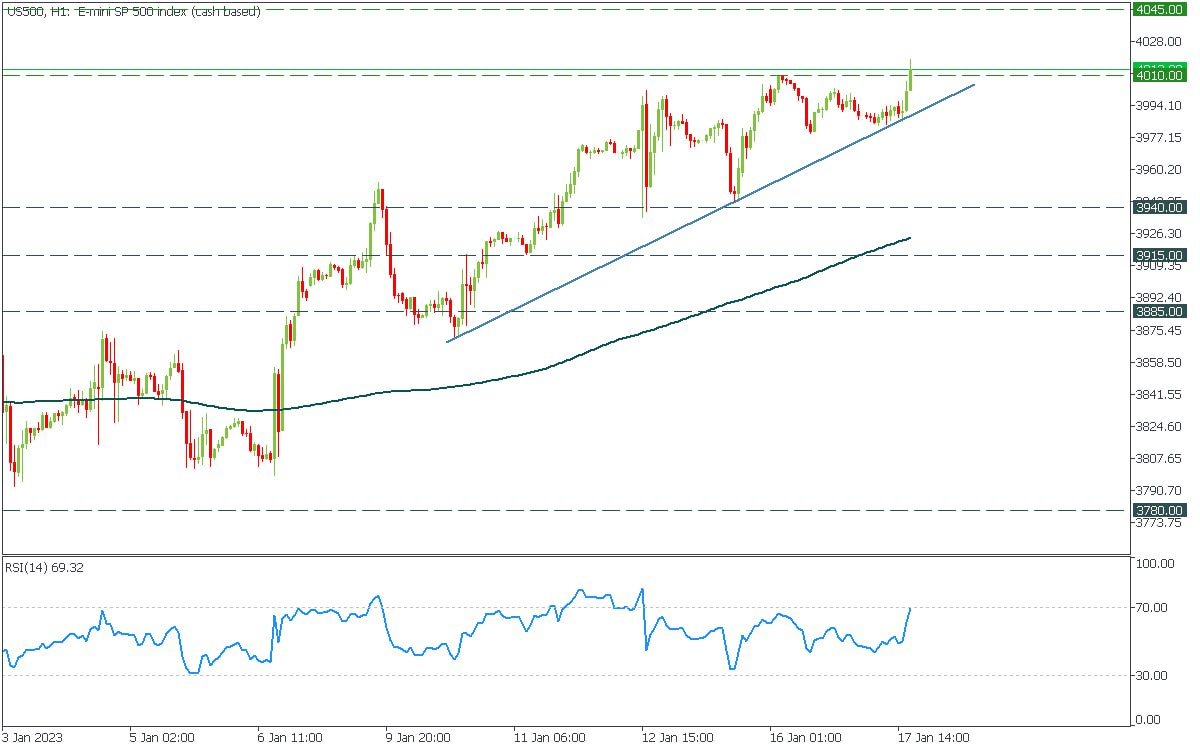
Stock market is rising
📈The US500 index is breaking through the resistance of 4010, another signal for buy traders to step into the game
🚀 If the H1 candle closes above the level, you may buy with a target of 4045 . However, be careful as the decline below 4010 would mean the movement was a fake
What are your thoughts?
✅START TRADING ✅
Stock market is rising
📈The US500 index is breaking through the resistance of 4010, another signal for buy traders to step into the game
🚀 If the H1 candle closes above the level, you may buy with a target of 4045 . However, be careful as the decline below 4010 would mean the movement was a fake
What are your thoughts?
✅START TRADING ✅
👍17❤🔥5🐳4🔥2😍2❤1👏1🍌1
#TradingEducation
Are you tired of trying to make sense of those chaotic charts and graphs? Well, fear not my friends, because today we're going to learn the ultimate secret of the Forex world: how to draw a trend line!
Now, before we begin, let me just say that drawing a trend line is like trying to tame a wild lion. It may seem intimidating at first, but with a little bit of practice and the right tools, you'll be the king of the chart jungle in no time!
1️⃣ Step 1: Identify the trend. This is where the real magic happens. Look for a series of higher highs and higher lows for an uptrend or lower lows and lower highs for a downtrend.
2️⃣ Step 2: Grab your trusty pen or pencil (or your digital equivalent) and start connecting the dots. A trend line is simply a straight line that connects two or more significant price points.
3️⃣ Step 3: Now, you may be tempted to just draw a straight line through the middle of all the price points, but that's where you'll go wrong. A true trend line should be touching at least two extreme points on the chart.
4️⃣Step 4: Once you have your trend line, it's time to put it to the test. As prices continue to move, use your trend line as a guide and see if the market is following it. If it holds, then congratulations, you've just tamed the lion!
And there you have it, folks! Now go forth and conquer the Forex world with your newfound trend line skills! To find out trend-trading strategies, visit the FBS website: https://bit.ly/3CVz3a9🏆
Are you tired of trying to make sense of those chaotic charts and graphs? Well, fear not my friends, because today we're going to learn the ultimate secret of the Forex world: how to draw a trend line!
Now, before we begin, let me just say that drawing a trend line is like trying to tame a wild lion. It may seem intimidating at first, but with a little bit of practice and the right tools, you'll be the king of the chart jungle in no time!
1️⃣ Step 1: Identify the trend. This is where the real magic happens. Look for a series of higher highs and higher lows for an uptrend or lower lows and lower highs for a downtrend.
2️⃣ Step 2: Grab your trusty pen or pencil (or your digital equivalent) and start connecting the dots. A trend line is simply a straight line that connects two or more significant price points.
3️⃣ Step 3: Now, you may be tempted to just draw a straight line through the middle of all the price points, but that's where you'll go wrong. A true trend line should be touching at least two extreme points on the chart.
4️⃣Step 4: Once you have your trend line, it's time to put it to the test. As prices continue to move, use your trend line as a guide and see if the market is following it. If it holds, then congratulations, you've just tamed the lion!
And there you have it, folks! Now go forth and conquer the Forex world with your newfound trend line skills! To find out trend-trading strategies, visit the FBS website: https://bit.ly/3CVz3a9🏆
👍44❤16🔥15❤🔥7😍4😈3🐳2👎1🍓1🍾1
#MarketNews
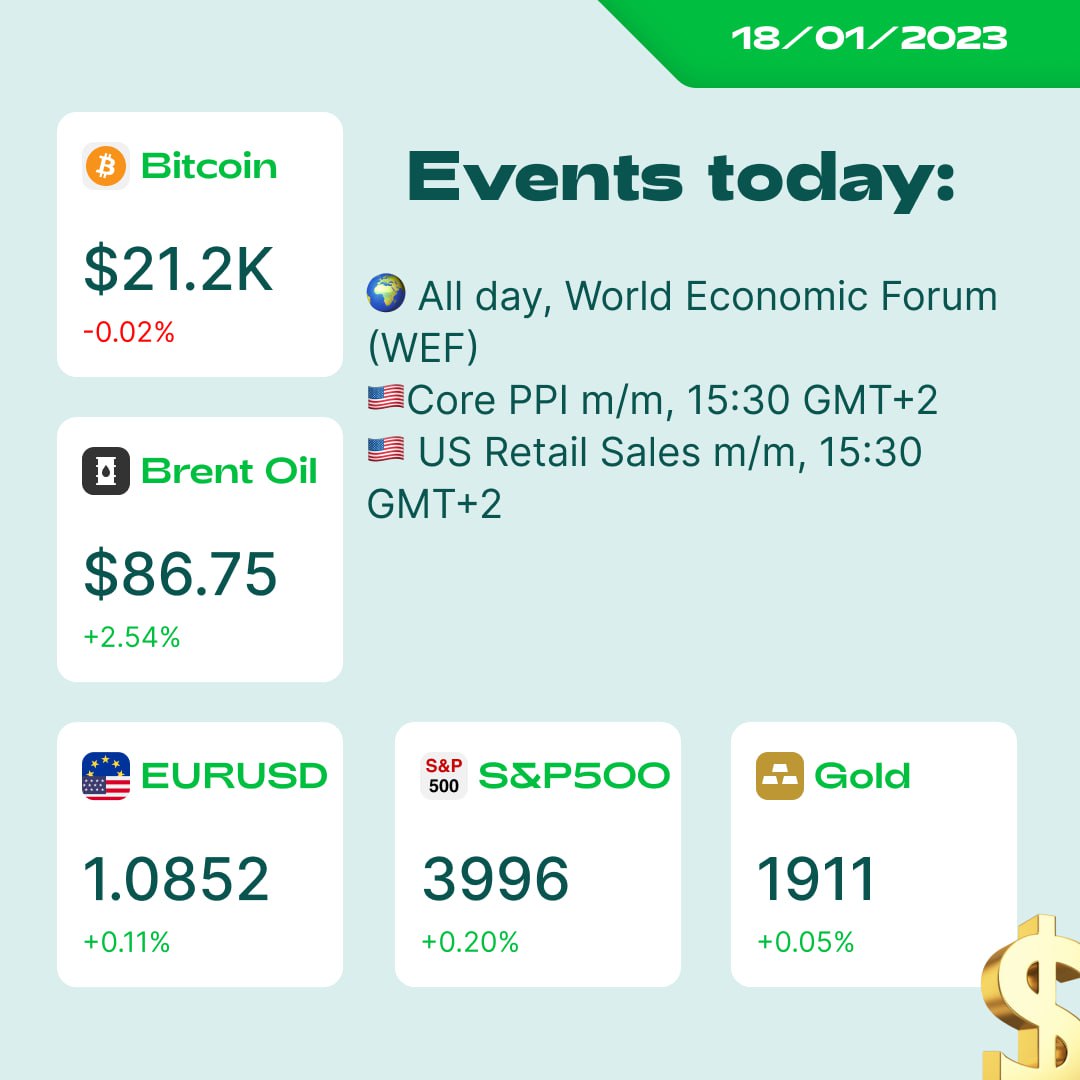
🌤 Good morning, traders! Here’s what we found for you:
🇨🇦 Canadian CPI releases surpassed expectations a little. Median and Trimmed CPI were above expectations by 0.1%. USDCAD is 650 points down.
🇺🇸 The US Empire State Manufacturing Index turned out to be lower than expected (-32.9 vs. -8.7 forecasted). The US dollar index fell 0.20%.
🇯🇵 The BOJ held a Press Conference on monetary policy. It decided to continue the QE (quantitative easing) and Monetary Easing policy, keeping the long-term interest rate at -0.1%. The bond’s yield is set to be in the range of around plus and minus 0.5%. USDJPY skyrocketed 3400 points.
🇪🇺 ECB member Villeroy said the EU should avoid recession this year. However, participants at the World Economic Forum disagree with him, putting a 63% chance of a recession in 2023.
💸 Bitcoin funding is mostly negative, meaning that there’re more short sellers on the market. Another bullish factor for the price.
🇬🇧 UK inflation dipped for a second month in December. Still, the annual CPI is 10.5%, and the crisis continues.
🇨🇳 All South Asian countries could benefit as Chinese travelers are spreading around the closest countries after the lockdowns ended.
🏆 Gold touched the support level of $1900 and is bouncing back up. Today the sentiment may drive the metal higher. What do you think about gold?
💚 Have a great day!
🌤 Good morning, traders! Here’s what we found for you:
🇨🇦 Canadian CPI releases surpassed expectations a little. Median and Trimmed CPI were above expectations by 0.1%. USDCAD is 650 points down.
🇺🇸 The US Empire State Manufacturing Index turned out to be lower than expected (-32.9 vs. -8.7 forecasted). The US dollar index fell 0.20%.
🇯🇵 The BOJ held a Press Conference on monetary policy. It decided to continue the QE (quantitative easing) and Monetary Easing policy, keeping the long-term interest rate at -0.1%. The bond’s yield is set to be in the range of around plus and minus 0.5%. USDJPY skyrocketed 3400 points.
🇪🇺 ECB member Villeroy said the EU should avoid recession this year. However, participants at the World Economic Forum disagree with him, putting a 63% chance of a recession in 2023.
💸 Bitcoin funding is mostly negative, meaning that there’re more short sellers on the market. Another bullish factor for the price.
🇬🇧 UK inflation dipped for a second month in December. Still, the annual CPI is 10.5%, and the crisis continues.
🇨🇳 All South Asian countries could benefit as Chinese travelers are spreading around the closest countries after the lockdowns ended.
🏆 Gold touched the support level of $1900 and is bouncing back up. Today the sentiment may drive the metal higher. What do you think about gold?
💚 Have a great day!
👍31❤🔥4🔥3🐳3❤2😍1🍓1
🇺🇸What are your expectations on USD after the US PPI release?
Anonymous Poll
48%
👆USD up
37%
👇USD down
15%
🤭I want to check the answers
🍾20👍8🐳4🔥3🤪3😢2
#Best_Investments
Part 4
Part three here
1️⃣9️⃣9️⃣0️⃣, the time before the bubble
🌐 The Internet came out of nowhere, creating hype and extolling Internet companies that people used to call dot-com companies.
🚀 Investors started to overvalue all companies that worked with the Internet, and the world started to think Internet companies would continue to grow incredibly fast and won’t stop. The bubble formed by the late 1990s.
During this time, the market was driven by several other factors, including a robust economy and low interest rates.
🤯 Surprisingly enough, people started to get the idea the Internet doesn't create any real-life things, and some Internet companies were just a junk.
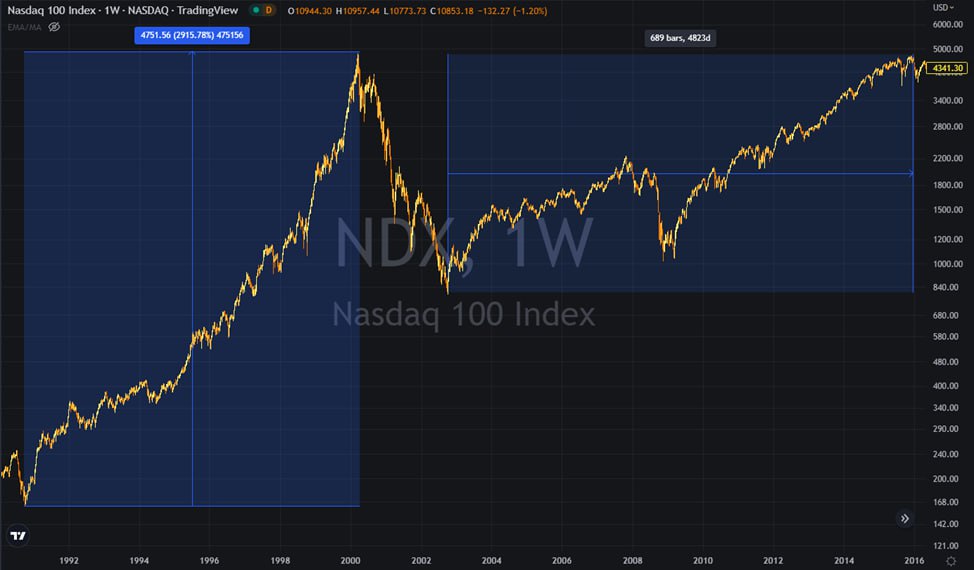
⚠️ Some companies, like AT&T, never fully recovered. Others, like Amazon, needed almost ten years to reach their previous all-time high. On average, the US100 index (NASDAQ) lost 83% of its market value. However, it gained almost 3000% over the decade.
💭 What do you think, where will the US100 be in five years?
Don't forget to give us a ❤️
Part 4
Part three here
1️⃣9️⃣9️⃣0️⃣, the time before the bubble
🌐 The Internet came out of nowhere, creating hype and extolling Internet companies that people used to call dot-com companies.
🚀 Investors started to overvalue all companies that worked with the Internet, and the world started to think Internet companies would continue to grow incredibly fast and won’t stop. The bubble formed by the late 1990s.
During this time, the market was driven by several other factors, including a robust economy and low interest rates.
🤯 Surprisingly enough, people started to get the idea the Internet doesn't create any real-life things, and some Internet companies were just a junk.
⚠️ Some companies, like AT&T, never fully recovered. Others, like Amazon, needed almost ten years to reach their previous all-time high. On average, the US100 index (NASDAQ) lost 83% of its market value. However, it gained almost 3000% over the decade.
💭 What do you think, where will the US100 be in five years?
Don't forget to give us a ❤️
❤38👍13❤🔥4🐳2🍌2👏1🍓1🍾1
🇺🇸🇯🇵#USDJPY
🔥USDJPY might bounce soon!
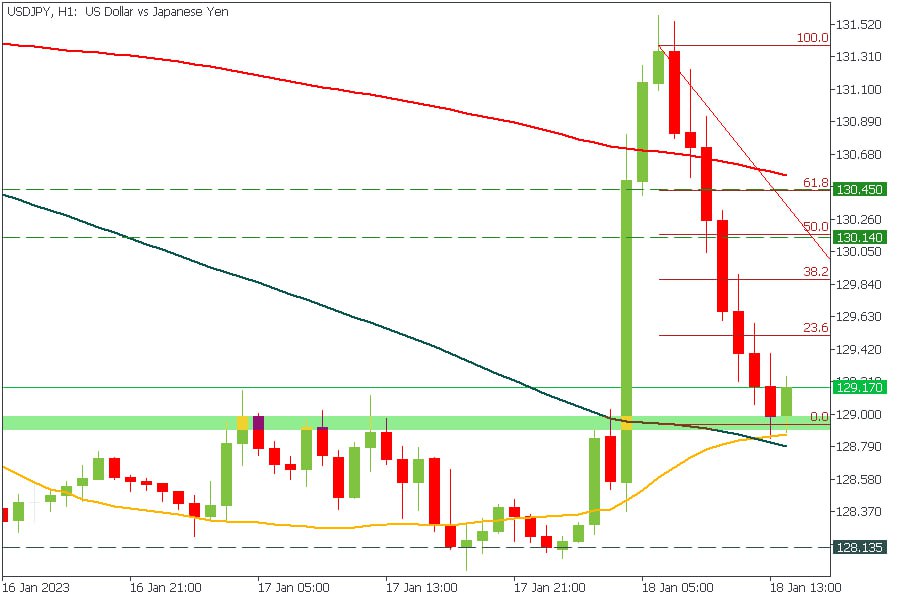
The price is consolidating above the support level in the H1 timeframe. According to the Fibonacci Retracement, we might see a bounce toward the 130.14 and 130.45, 50.0, and 61.8 Fibonacci levels, respectively.
❌SL: Below the support area
Be accurate! The US PPI will be announced in less than an hour!
✅START TRADING ✅
🔥USDJPY might bounce soon!
The price is consolidating above the support level in the H1 timeframe. According to the Fibonacci Retracement, we might see a bounce toward the 130.14 and 130.45, 50.0, and 61.8 Fibonacci levels, respectively.
❌SL: Below the support area
Be accurate! The US PPI will be announced in less than an hour!
✅START TRADING ✅
👍25🔥6❤3🤪3❤🔥2💔2🍾1
🔥US PPI Numbers!
🔥 PPI:
Actual: -0.5%
Forecast: -0.1%
Previous: 0.3%
🔥Core PPI:
Actual: 0.1%
Forecast: 0.1%
Previous: 0.4%
🔥Retail Sales:
Actual: -1.1%
Forecast: -0.8%
Previous: -0.6%
🔥Core Retail Sales:
Actual: -1.1%
Forecast: -0.5%
Previous: -0.2%
🔥 PPI:
Actual: -0.5%
Forecast: -0.1%
Previous: 0.3%
🔥Core PPI:
Actual: 0.1%
Forecast: 0.1%
Previous: 0.4%
🔥Retail Sales:
Actual: -1.1%
Forecast: -0.8%
Previous: -0.6%
🔥Core Retail Sales:
Actual: -1.1%
Forecast: -0.5%
Previous: -0.2%
👍21🐳6🔥4❤3❤🔥2